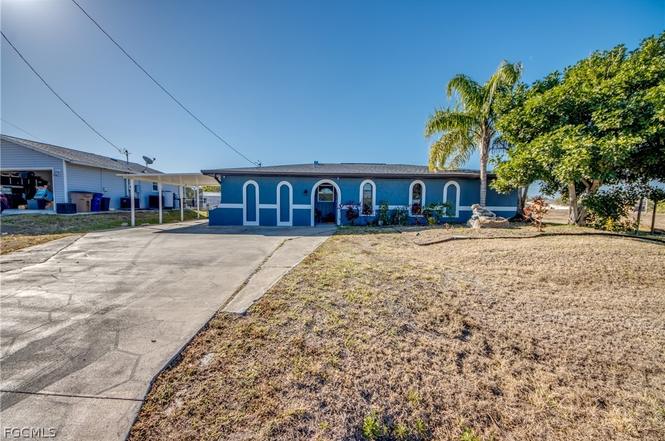
3015 8th St SW · Lehigh Acres, FL
Flood risk No data
- FEMA flood zone
- —
- Chance of flooding over 30 yrs
- —
- Est. flood insurance / yr
- —
Fire risk No data
- Est. fire insurance / yr
- —
Heat risk No data
- Hot days now (above threshold)
- —
- Hot days in 30 yrs
- —
Wind risk No data
- Chance of severe wind over 30 yrs
- —
Air-quality risk No data
- Unhealthy air days now
- —
- Unhealthy air days in 30 yrs
- —
Risk factors via First Street. Map © Google.
Why this score? — see what drove the D grade
The composite is a weighted blend of 9 inputs, each scored 0–100. Each bar is that input's sub-score; the figure is the points it added to the 100-point composite (weight × sub-score).
- Appreciation +10.0/10.0
- ARV discount +8.9/15.0
- Cash flow +8.0/30.0
- Schools +4.1/10.0
- Livability +3.0/5.0
- Condition / age +2.5/5.0
- Rent growth +2.1/5.0
- DSCR +2.0/10.0
- 1% rule +1.5/10.0
$345,000
🖨 Deal sheet 📄 Offer letter ✓ Due diligence
Listing remarks
Centrally located in Lehigh Acres making any commute convenient. This 4-bedroom, 2-bath pool home sits on an oversized double lot that stretches from street to street alongside a green belt and wide canal. The covered front entry opens to a bright, open floor plan with vinyl plank flooring and tile throughout with views of the expansive screened pool and spa. Kitchen has stainless Steel appliances, and granite countertops. The primary suite has private lanai access and Owners suite bathroom offers resort style relaxation that was recently remodeled to feel like a spa retreat, featuring a soaking tub and dual rainfall shower heads. A large adjoining bedroom with barn doors is perfect for a n
Key facts
- Wide canal
- Soaking tub
- Oversized double lot
Tags
Property features AI
Finance
- Financial info: Pets allowed
- HOA & community: Community has street lights; Association provides storage
Exterior
- Parking: Attached carport; 2 covered/carport spaces
- Security: Smoke detector(s)
- Utilities: Well water; Septic tank; Cable available; High-speed internet available
- Home design: Single-story home; Shingle roof; Block, concrete and stone construction
- Construction: Built with block, concrete and stone
- Exterior features: Fence; Patio; Storage; Lanai; Porch; Screened porch; Canal access (waterfront); Oversized lot; South exposure; North-facing property; Entry at level 1; Resale condition
Interior
- Kitchen: Dishwasher; Range; Microwave; Refrigerator; Freezer; Water purifier
- Bedrooms: Bedroom located on the main level
- Flooring: Tile; Vinyl
- Bathrooms: 2 full bathrooms; Dual sinks; Separate shower; Multiple shower heads; Bathtub
- Heating & cooling: Central heating (electric); Central air conditioning (electric)
- Interior features: Bedroom on main level; Bathtub; Dual sinks; Living/dining room; Multiple shower heads; Separate shower; Split bedrooms; Furnishing negotiable; Jalousie and single-hung windows
- Laundry & utility: Washer hookup; Dryer hookup; Washer; Dryer
Neighborhood map
What this means for you Summary
Snapshot
- This is a 4-bed/3.0-bath single-family listed at $345k.
Deal economics
- At list price, monthly cash flow is $-360 ($-4k/yr) — negative.
- To cash-flow at today's rent, offer at most $281k (18.4% below list).
- To meet the 1% rule (rent ≥ 1% of price), the offer needs to be $226k (34.6% below list).
- Recommended offer: $226k (34.6% below list) — sets the bar for 1% rule.
Location & tenants
- Location reads 59/100 on livability (#826 in FL) — a working-class tenant base; expect higher turnover. Strengths: cost of living A+, housing A+; Watch: crime C-, employment D+, schools D-.
- Lee (suburban): math 47% / reading 50% proficiency, ranked #42 of 73 in FL (top 58%) — families likely to look elsewhere, expect single-tenant / working-renter base with shorter leases.
- Market conditions: Rents soft (-1.5%/yr); 786 active listings in the ZIP; 40 comparable units currently listed for rent nearby; rentals at typical pace (median 22d on market — plan ~3-4 weeks tenant-placement turnaround); 15,411 units permitted in Lee County in 2024 (4,686 in 5+ unit buildings).
- This rent runs 37% of the median local income ($73k/yr) — at the standard rent-burdened threshold; future hikes will face affordability resistance.
Forward outlook
- In year one you build about $37k of equity ($2k loan paydown + $34k appreciation (10.0% local appreciation)).
- Lee County population projected at +44% by 2050 — long-run rental-demand tailwind backs the buy-and-hold thesis.
- By year 2, paydown + projected appreciation supports a ~$59k cash-out refi (75% LTV) — recoverable capital for the next deal without selling this one.
Negotiation context
- It's been on market 126 days — a 12% lower offer ($304k) is reasonable based on typical stale-listing flexibility.
- Current owner paid $35k; list at $345k implies a 886% gain — meaningful room to come down on a strong offer.
Questions for the listing agent
- What do current leases actually rent for vs. the listed asking? Can we see a recent rent roll and the last 12 months of T-12 income?
- It's been on market 126 days. Have you received any prior offers? Is the seller open to a 35% concession, seller financing, or rate buy-down credit?
- Why hasn't it sold? Are there any deal-killer items the seller is aware of (foundation, flood, title, zoning, code violations)?
- Is there a deadline driving the sale (1031 exchange, divorce, estate, relocation)? That informs how much negotiation room exists.
- Schools are D-rated, which usually means shorter tenancies and higher turnover. Who's the typical renter profile here, and what's been the actual vacancy rate?
- The area grade is low — what's the realistic commute time and amenity access for the typical tenant pool here? Any planned neighborhood developments (good or bad) we should know about?
- What's the average days-on-market for RENTAL listings here right now (not sales)? A rising rental-DOM trend means longer vacancies and softer asking-rent achievability than the comps imply.
- What's the recent tenant-quality profile in this submarket — average credit score on applications, eviction rate, late-payment / NSF rate, and stable-employment percentage? A property-management company in the area should have these aggregated.
- How much new for-sale + rental construction is in the pipeline within 1–3 miles? Heavy new supply typically softens prices + rents 12–24 months out; constrained supply supports both.
Investment metrics
- 1% rule
- 0.65% ✗
- Cap rate
- 5.04%
- Cash-on-cash
- -4.47%
- DSCR
- 0.80
- GRM
- 12.7
CMA / ARV
- ARV (on-the-fly)
- $355,806
- Comps found
- 12
Show comp detail 12 sales within ~0.75 mi
| Address | Dist | Beds/Ba | Sqft | Sold | Price | $/sf | Match |
|---|---|---|---|---|---|---|---|
| 3201 2nd St SW | 0.42mi | 3/2.0 (-1) | 1,797 (0%) | 8mo | $365,000 | $203 | 65 |
| 2813 10th St SW | 0.39mi | 4/2.0 | 1,824 (+2%) | 16mo | $335,000 | $184 | 62 |
| 3001 2nd St SW | 0.38mi | 3/2.0 (-1) | 1,789 (-0%) | 17mo | $320,000 | $179 | 58 |
| 3000 3rd St SW | 0.35mi | 3/2.0 (-1) | 1,630 (-9%) | 1mo | $309,998 | $190 | 58 |
| 3218 4th St SW | 0.44mi | 4/3.0 | 1,585 (-12%) | 7mo | $360,000 | $227 | 54 |
| 3113 14th St SW | 0.40mi | 3/2.0 (-1) | 2,012 (+12%) | 2mo | $350,000 | $174 | 51 |
| 2808 9th St SW | 0.40mi | 3/2.0 (-1) | 1,931 (+8%) | 15mo | $340,000 | $176 | 48 |
| 3206 14th St SW | 0.47mi | 3/2.0 (-1) | 1,554 (-14%) | 0mo | $349,900 | $225 | 46 |
| 2902 17th St SW | 0.64mi | 4/3.0 | 1,583 (-12%) | 12mo | $350,000 | $221 | 40 |
| 2721 1st St W | 0.72mi | 3/2.0 (-1) | 1,630 (-9%) | 8mo | $322,998 | $198 | 35 |
| 2906 18th St SW | 0.67mi | 3/2.0 (-1) | 1,536 (-14%) | 4mo | $340,000 | $221 | 32 |
| 3015 2nd St W | 0.60mi | 3/2.0 (-1) | 1,528 (-15%) | 8mo | $272,000 | $178 | 31 |
Match score weights: distance 35% · size 25% · config 20% · recency 20%. Top-matched comps best support the ARV.
Projected returns pro-forma
10.0% appreciation · 0.0% rent growth · sell at horizon
- IRR
- 20.3%
- Equity multiple
- 2.64×
- Total profit
- $158,254
- Equity at exit
- $310,803
- IRR
- 18.0%
- Equity multiple
- 5.89×
- Total profit
- $471,983
- Equity at exit
- $670,259
Cash invested: $96,600 (down + closing). Projections, not guarantees.
Landlord ↔ Tenant lean methodology
- Overall (STATE)
- 87 Strongly Landlord-Friendly
- State Florida
- 87 Strongly Landlord-Friendly · R+3
- County
- — inherits STATE
- City
- — inherits STATE
ZIP-level market 33976
- Home prices YoY
- 6.8%
- Rents YoY
- -1.5%
- Active inventory
- 786
- Price-to-rent
- 12.7×
Monthly cashflow live
- Estimated rent
- $2,257 high interval (Pro) →
- Mortgage (P&I)
- −$1,809
- Tax from tax record
- −$190 /mo · $2,274/yr
- Insurance
- −$144
- HOA
- −$0
- Vacancy / Maint / Mgmt
- −$474
- Net cashflow
- $-360
Break-even live
UW: 25.0% down · 7.5% · 30yr · 1.5% tax · 5.0% vac · 8.0% maint · 8.0% mgmt
Financing live
Cash to close
- Down payment
- $86,250
- Closing costs
- $10,350
- Reserves months
- —
- Total cash needed
- —
Loan-product check · same deal, 3 products live
Conventional
25% down · 7.5% · 30yr
- Down + closing
- —
- Monthly P&I
- —
- Monthly cashflow
- —
- DSCR
- —
- Eligible?
- —
Personal DTI + credit; lowest rate.
DSCR
20% down · 8.5% · 30yr
- Down + closing
- —
- Monthly P&I
- —
- Monthly cashflow
- —
- DSCR
- —
- Eligible?
- —
No personal income docs; deal must DSCR.
Hard money
10% down · 12.0% · 12mo
- Down + closing
- —
- Monthly P&I
- —
- Monthly cashflow
- —
- DSCR
- —
- Eligible?
- —
Short-term bridge; refi at stabilization.
Rent comps 40 comps
| Address | Beds | Baths | Sqft | Rent | $/sqft | DOM | Units | Dist |
|---|---|---|---|---|---|---|---|---|
| 2916 7th St SW Lehigh Acres, FL | 3.0 | 2.0 | 1357 | $1,900 | $1.40 | 23d | 1 | 0.21mi |
| 2906 14th St SW Lehigh Acres, FL | 3.0 | 2.0 | 1563 | $2,450 | $1.57 | 23d | 1 | 0.43mi |
| 2812 4th St SW Lehigh Acres, FL | 3.0 | 2.0 | 1751 | $1,856 | $1.06 | 23d | 1 | 0.46mi |
| 2909 15th St SW Lehigh Acres, FL | 3.0 | 2.0 | 1291 | $1,800 | $1.39 | 21d | 1 | 0.50mi |
| 1507 Paula Ave S Lehigh Acres, FL | 3.0 | 2.0 | 1547 | $2,000 | $1.29 | 19d | 1 | 0.56mi |
| 3417 7th St SW Lehigh Acres, FL | 4.0 | 2.0 | 1833 | $1,850 | $1.01 | 10d | 1 | 0.67mi |
| 3408 10th St SW Lehigh Acres, FL | 4.0 | 2.0 | 1385 | $1,850 | $1.34 | 21d | 1 | 0.70mi |
| 3408 10th St SW Lehigh Acres, FL | 4.0 | 2.0 | 1920 | $1,750 | $0.91 | 14d | 1 | 0.70mi |
| 3303 8th St SW Lehigh Acres, FL | 3.0 | 2.0 | 1400 | $2,250 | $1.61 | 3d | 1 | 0.81mi |
| 3209 21st St SW Lehigh Acres, FL | 3.0 | 2.0 | 1418 | $1,699 | $1.20 | 3d | 1 | 0.89mi |
| 3008 23rd St SW Lehigh Acres, FL | 3.0 | 2.0 | 1640 | $2,350 | $1.43 | 23d | 1 | 0.94mi |
| 1511 Terry Ave S Lehigh Acres, FL | 3.0 | 2.0 | 1579 | $1,996 | $1.26 | 23d | 1 | 0.96mi |
| 3615 6th St SW Lehigh Acres, FL | 3.0 | 2.0 | 1378 | $1,825 | $1.32 | 23d | 1 | 0.98mi |
| 3109 8th St SW Lehigh Acres, FL | 3.0 | 2.0 | 1324 | $1,845 | $1.39 | 21d | 1 | 1.00mi |
| 2701 20th St SW Lehigh Acres, FL | 3.0 | 2.0 | 2019 | $1,900 | $0.94 | 19d | 1 | 1.00mi |
| 2902 7th St W Lehigh Acres, FL | 3.0 | 2.0 | 1841 | $2,215 | $1.20 | 14d | 1 | 1.01mi |
| 2902 7th St W Lehigh Acres, FL | 3.0 | 2.0 | 1841 | $2,085 | $1.13 | 2d | 1 | 1.01mi |
| 2914 24th St SW Lehigh Acres, FL | 3.0 | 2.0 | 1537 | $2,250 | $1.46 | 23d | 1 | 1.01mi |
| 3201 23rd St SW Lehigh Acres, FL | 3.0 | 2.0 | 1324 | $1,845 | $1.39 | 21d | 1 | 1.03mi |
| 2709 6th St W Lehigh Acres, FL | 4.0 | 3.0 | 1915 | $2,400 | $1.25 | 19d | 1 | 1.05mi |
| 2709 6th St W Lehigh Acres, FL | 4.0 | 3.0 | 1915 | $2,400 | $1.25 | 21d | 1 | 1.05mi |
| 3008 25th St SW Lehigh Acres, FL | 4.0 | 2.0 | 1565 | $1,711 | $1.09 | 21d | 1 | 1.06mi |
| 3203 24th St SW Lehigh Acres, FL | 3.0 | 2.0 | 1498 | $2,300 | $1.54 | 21d | 1 | 1.09mi |
| 3705 9th St SW Lehigh Acres, FL | 3.0 | 2.0 | 1272 | $1,695 | $1.33 | 14d | 1 | 1.10mi |
| 3208 9th St W Lehigh Acres, FL | 3.0 | 2.0 | 1423 | $1,916 | $1.35 | 3d | 1 | 1.11mi |
| 3109 10th St W Lehigh Acres, FL | 3.0 | 2.0 | 1472 | $1,950 | $1.32 | 23d | 1 | 1.12mi |
| 3702 14th St SW Lehigh Acres, FL | 4.0 | 2.0 | 1472 | $1,995 | $1.36 | 23d | 1 | 1.13mi |
| 3310 9th St W Lehigh Acres, FL | 3.0 | 2.0 | 1488 | $2,300 | $1.55 | 16d | 1 | 1.14mi |
| 2811 25th St SW Unit NA Lehigh Acres, FL | 3.0 | 2.0 | 1430 | $1,990 | $1.39 | 23d | 1 | 1.15mi |
| 3309 10th St W Lehigh Acres, FL | 4.0 | 2.0 | 1575 | $2,199 | $1.40 | 11d | 1 | 1.16mi |
| 2614 7th St W Lehigh Acres, FL | 3.0 | 2.0 | 1912 | $2,500 | $1.31 | 23d | 1 | 1.20mi |
| 209 Punta Alta Ct Lehigh Acres, FL | 4.0 | 2.0 | 1860 | $1,950 | $1.05 | 19d | 1 | 1.20mi |
| 2612 7th St W Lehigh Acres, FL | 3.0 | 2.0 | 1492 | $2,295 | $1.54 | 23d | 1 | 1.20mi |
| 2602 24th St SW Lehigh Acres, FL | 3.0 | 2.0 | 1358 | $1,800 | $1.33 | 3d | 1 | 1.24mi |
| 3312 11th St W Lehigh Acres, FL | 3.0 | 2.5 | 1354 | $2,000 | $1.48 | 3d | 1 | 1.26mi |
| 3310 11th St W Lehigh Acres, FL | 3.0 | 2.5 | 1354 | $2,000 | $1.48 | 3d | 1 | 1.26mi |
| 2708 27th St SW Lehigh Acres, FL | 4.0 | 2.0 | 1698 | $2,280 | $1.34 | 3d | 1 | 1.30mi |
| 3714 17th St SW Lehigh Acres, FL | 4.0 | 2.0 | 1833 | $1,890 | $1.03 | 23d | 1 | 1.30mi |
| 3201 28th St Lehigh Acres, FL | 4.0 | 2.0 | 1389 | $2,000 | $1.44 | 3d | 1 | 1.32mi |
| 2710 28th St SW Lehigh Acres, FL | 4.0 | 2.0 | 1742 | $2,450 | $1.41 | 23d | 1 | 1.34mi |
Listing history 15 events
-
2026-06-17days on market $345,000 Active 126 DOM
-
2026-06-16days on market $345,000 Active 125 DOM
-
2026-06-15days on market $345,000 Active 124 DOM
-
2026-06-13days on market $345,000 Active 122 DOM
-
2026-06-10days on market $345,000 Active 119 DOM
-
2026-06-09days on market $345,000 Active 118 DOM
-
2026-06-07pricedays on market $345,000 Active 116 DOM
-
2026-06-02days on market $355,000 Active 111 DOM
-
2026-06-01days on market $355,000 Active 110 DOM
-
2026-06-01days on market $355,000 Active 109 DOM
-
2026-02-27price $355,000
-
2026-02-20price $362,500
-
2026-02-11$365,000 Active
-
1987-03-20soldstatus $35,000
-
1986-04-01soldstatus $41,400
ⓘ Source: listings_history table (triggers on properties + properties_extension) + one-shot
backfill from property_details.listing_events for pre-trigger history.
Tax reassessment forecast FL · Resets to sale price
- Current annual tax
- $2,274 · $190/mo
- Projected year-2 tax
- $2,864 · $239/mo
- Expected delta
- +$589/yr (+$49/mo · 25.9%)
ⓘ Screening estimate from a state-policy table — verify with the county assessor before closing.
Nearby sold comps map
Loading sold comps map…
Walkable amenities ~0.75 mi
Loading nearby amenities…
Taxation est. · year 1
- Rental income
- $27,079
- − Mortgage interest
- −$19,325
- − Property taxes
- −$2,274
- − Insurance
- −$1,725
- − Repairs & maintenance
- −$2,166
- − Management
- −$2,166
- − Depreciation
- −$10,036
- Taxable loss
- −$10,614
- Est. tax savings @ 24.0%
- +$2,547
- After-tax cash flow
- $-1,770/yr
For passive investors: Depreciation is non-cash, so a rental often shows a tax loss while cash-flowing — sheltering income. Rental losses are passive: they offset passive income freely, and up to $25,000/yr can offset ordinary (W-2) income if you actively participate and your MAGI is under $100k (phasing out to $0 by $150k); unused losses carry forward. On sale, claimed depreciation is recaptured at up to 25%, and gains may owe capital-gains tax (a 1031 exchange can defer both). Figures are a year-1 estimate at your 24.0% rate — not tax advice; consult a CPA.
Schools (NCES district)
- District
- Lee
- NCES district ID
- 1201080
- Math proficiency
- 47% ▼ -11.00%
- Reading proficiency
- 50% ▼ -4.00%
- Median HH income
- $49,518
- Composite
- 41.49/100
- National rank
- #3458
- State rank
- #42 of 73 in FL
Livability — Lehigh Acres
- Score
- 59/100
- State rank
- #826
- US rank
- #20055
Category grades
Schools grade is shown separately in the Schools card above.
Census & demographics
- Census place
- Lehigh Acres, FL
- County
- Lee County · 788,662 people
- City population
- 130,638
- Metro
- Cape Coral-Fort Myers, FL
- Population (ZIP)
- 20,277
- Household income
- $72,679
- Rent vs Own
- Severe rent burden
- 574.0
Population outlook (Lee County) Hauer SSP2
- Today (2025)
- 871,946 people
- By 2030
- 955,468 · +9.6%
- By 2040
- 1,113,587 · +27.7%
- By 2050
- 1,256,891 · +44.1%
- By 2075
- 1,560,270 · +78.9%
- By 2100
- 1,726,848 · +98.0%
Race, ethnicity, and origin ACS 2023
- Neighborhood character
- Diverse neighborhood (Simpson 0.65)
- Race & ethnicity
- Hispanic / Latino 50% Two or more races 30% White 24% Black 20% Asian 3%
- Hispanic origin (detail)
- Mexican 8% Puerto Rican 8% Cuban 18% Dominican 4%
- Common ancestry
- Hispanic 8% Slovak 1% Lithuanian 1%
- Foreign-born
- 35% · Canada, Jamaica, Vietnam
- Languages at home
- 46% English-only · Spanish 43% French/Haitian/Cajun 8% Vietnamese 1%
Political lean MEDSL · Lee
- 2024 margin
- Strong R (+28.4) · D 35.5% · R 63.9%
- 2008→2024 swing
- -18.0pp toward R · 2008: -10.4pp · 2024: -28.4pp
- All cycles
- 2024: R+28.4 2020: R+19.2 2016: R+20.4 2012: R+16.6 2008: R+10.4
Not yet ingested
- Civics
- —
Market trends
- HPI YoY
- ▲ 21.77%
- Current HPI
- 340.4255
- Rent YoY
- ▼ -1.54%
- Metro
- Cape Coral-Fort Myers, FL
- State GDP YoY
- ▲ 3.28%
- F500 in state
- 36
Industry mix (Fortune 500 HQ in FL)
| Industry | F500 HQs | Revenue |
|---|---|---|
| Industrial Technology | 2 | $29B |
|
||
| Insurance | 2 | $17B |
|
||
| Retail | 1 | $60B |
|
||
| Technology Distribution | 1 | $58B |
|
||
| Homebuilding | 1 | $35B |
|
||
| Technology Manufacturing | 1 | $35B |
|
||
Price history
+757.5% since first listed5 events — show timeline
- 2026-02-27 Price Changed $355,000 FORTMLS
- 2026-02-20 Price Changed $362,500 FORTMLS
- 2026-02-11 Listed $365,000 FORTMLS
- 1987-03-20 Sold (Public Records) $35,000 Public Records
- 1986-04-01 Sold (Public Records) $41,400 Public Records
Property tax history
+11.7%/yrLatest (2023): $2,274 · +5.5% YoY. Source: county tax records.
Cash-flow waterfall
monthlySold comps — $/sqft
last 12 mo · ≤1 miLoading sold comps…