 🏷️ Likely Rental
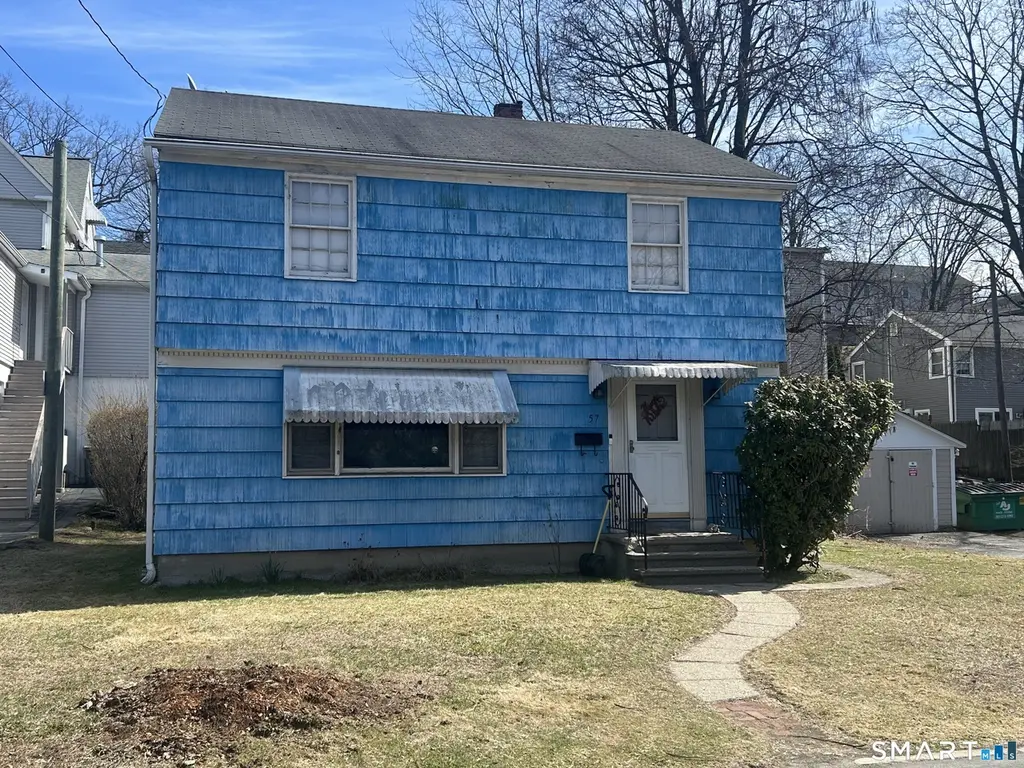
57 Curtiss St · Naugatuck, CT
Flood risk 9/10 · Severe
- FEMA flood zone
- X (shaded)
- Chance of flooding over 30 yrs
- 0.99%
- Est. flood insurance / yr
- $473 – $860
Fire risk 3/10 · Minor
- Est. fire insurance / yr
- $829 – $1,539
Heat risk 5/10 · Moderate
- Hot days now (above 97°F)
- 7 days/yr
- Hot days in 30 yrs
- 16 days/yr
Wind risk 6/10 · Moderate
- Chance of severe wind over 30 yrs
- 27.0%
Air-quality risk 3/10 · Minor
- Unhealthy air days now
- 2 days/yr
- Unhealthy air days in 30 yrs
- 4 days/yr
Risk factors via First Street. Map © Google.
Why this score? — see what drove the C- grade
The composite is a weighted blend of 9 inputs, each scored 0–100. Each bar is that input's sub-score; the figure is the points it added to the 100-point composite (weight × sub-score).
- ARV discount +15.0/15.0
- Cash flow +13.9/30.0
- DSCR +4.2/10.0
- 1% rule +4.1/10.0
- Rent growth +4.1/5.0
- Livability +3.9/5.0
- Schools +3.3/10.0
- Condition / age +2.5/5.0
- Appreciation +0.0/10.0
$235,000
🖨 Deal sheet (PDF) 📄 Offer letter ✓ Due diligence
Listing remarks MLS
INVESTORS TAKE NOTICE. 6 room, 3 bedroom, 1 bath colonial with incredible potential! Newer oil-fired furnace and electric hot water heater. Walk-up attic access in 2nd floor bedroom area. Property to be sold AS IS and CASH ONLY. Tenant will provide showing access.
Key facts
- Walk-up attic access
- 4,356 sq ft lot
- Built 1946
Tags
Neighborhood map
What this means for you Summary
Snapshot
- This is a 3-bed/1.0-bath single-family listed at $235k.
Deal economics
- At list price, monthly cash flow is $-31 ($-373/yr) — negative.
- To cash-flow at today's rent, offer at most $230k (2.3% below list).
- To meet the 1% rule (rent ≥ 1% of price), the offer needs to be $213k (9.2% below list).
- Recommended offer: $213k (9.2% below list) — sets the bar for 1% rule.
- Cap rate 6.4% vs local median 3.4% in Naugatuck — top-decile yield for the area; either an underpriced asset or a hidden risk that comps aren't pricing in. Stress-test before assuming the spread holds.
Location & tenants
- Location reads 77/100 on livability (#42 in CT, #2,997 nationally) — a middle-class / working-renter tenant base. Strengths: crime A+, housing A+, health & safety A+; Watch: amenities F, commute D-.
- Naugatuck School District (suburban): math 32% / reading 43% proficiency, ranked #105 of 153 in CT (top 69%) — families likely to look elsewhere, expect single-tenant / working-renter base with shorter leases.
- Market conditions: Rents rising fast (+6.2%/yr); 112 active listings in the ZIP; 26 comparable units currently listed for rent nearby; rentals at typical pace (median 22d on market — plan ~3-4 weeks tenant-placement turnaround); solid renter incomes; 502 units permitted in Naugatuck Valley Planning Region in 2024 (171 in 5+ unit buildings).
Forward outlook
- Local home prices are declining (-3.0%/yr); year-one equity from $2k of loan paydown is wiped out by about $7k of value loss. Plan a longer hold.
Negotiation context
- It's been on market 89 days — a 6% lower offer ($221k) is reasonable based on typical stale-listing flexibility.
- 2 sale attempts since 12y ago; this cycle's ask has dropped $24k (9%) from the opening price — seller is motivated, your offer sets the floor, not the list.
- Current owner paid $100k; list at $235k implies a 135% gain — meaningful room to come down on a strong offer.
Risks & watch-outs
- Watch-outs: flood insurance adds $56/mo; built in 1946 — expect roof / HVAC / electrical / plumbing capex.
- Climate carrying-cost: severe flood risk; major wind risk, 27% chance of damaging wind over 30y; extreme-heat days projected 7→16/yr by 2055 (HVAC capex compounding) — expect insurance premiums to compound above CPI over the hold.
Questions for the listing agent
- What do current leases actually rent for vs. the listed asking? Can we see a recent rent roll and the last 12 months of T-12 income?
- It's been on market 89 days. Have you received any prior offers? Is the seller open to a 9% concession, seller financing, or rate buy-down credit?
- Built in 1946 — when were the roof, HVAC, electrical panel, plumbing, and water heater last replaced?
- What's the actual annual flood-insurance premium (NFIP or private), and is the property in a SFHA with mandatory coverage?
- Why hasn't it sold? Are there any deal-killer items the seller is aware of (foundation, flood, title, zoning, code violations)?
- Is there a deadline driving the sale (1031 exchange, divorce, estate, relocation)? That informs how much negotiation room exists.
- What's the average days-on-market for RENTAL listings here right now (not sales)? A rising rental-DOM trend means longer vacancies and softer asking-rent achievability than the comps imply.
- What's the recent tenant-quality profile in this submarket — average credit score on applications, eviction rate, late-payment / NSF rate, and stable-employment percentage? A property-management company in the area should have these aggregated.
- How much new for-sale + rental construction is in the pipeline within 1–3 miles? Heavy new supply typically softens prices + rents 12–24 months out; constrained supply supports both.
Investment metrics
- 1% rule
- 0.91% ✗
- Cap rate
- 6.42%
- Cash-on-cash
- 0.45%
- DSCR
- 1.02
- GRM
- 9.2
CMA / ARV
- ARV (median comp)
- $299,900
- List price
- $235,000
- Delta
- -21.64%
- Verdict
- UNDERPRICED
- Comps
- 20 within 1.0 mi
Show comp detail 12 sales within ~0.75 mi
| Address | Dist | Beds/Ba | Sqft | Sold | Price | $/sf | Match |
|---|---|---|---|---|---|---|---|
| 24 New St | 0.35mi | 3/1.0 | 1,344 (-2%) | 5mo | $320,000 | $238 | 76 |
| 146 Johnson St | 0.36mi | 3/1.5 | 1,466 (+7%) | 5mo | $299,900 | $205 | 65 |
| 53 Walnut St | 0.56mi | 3/2.0 | 1,332 (-3%) | 4mo | $385,000 | $289 | 62 |
| 210 Johnson St | 0.27mi | 3/2.5 | 1,536 (+12%) | 3mo | $299,900 | $195 | 59 |
| 4 Culver Ct | 0.73mi | 3/1.5 | 1,393 (+2%) | 4mo | $332,040 | $238 | 58 |
| 41 Quinn St | 0.66mi | 3/2.0 | 1,336 (-3%) | 4mo | $355,000 | $266 | 57 |
| 80 Cliff St | 0.75mi | 3/1.5 | 1,427 (+4%) | 0mo | $330,000 | $231 | 56 |
| 137 Lincoln St | 0.71mi | 3/2.0 | 1,280 (-7%) | 2mo | $320,000 | $250 | 50 |
| 15 Summit Rd | 0.71mi | 3/1.5 | 1,469 (+7%) | 4mo | $400,000 | $272 | 50 |
| 89 Alma St | 0.52mi | 3/2.5 | 1,536 (+12%) | 1mo | $350,000 | $228 | 49 |
| 31 June St | 0.64mi | 2/1.0 (-1) | 1,512 (+10%) | 4mo | $285,000 | $188 | 45 |
| 22 Neagle St | 0.69mi | 3/2.5 | 1,512 (+10%) | 0mo | $367,000 | $243 | 44 |
Match score weights: distance 35% · size 25% · config 20% · recency 20%. Top-matched comps best support the ARV.
Projected returns pro-forma
-3.0% appreciation · 6.23% rent growth · sell at horizon
- IRR
- -13.4%
- Equity multiple
- 0.50×
- Total profit
- $-32,810
- Equity at exit
- $35,039
- IRR
- 0.1%
- Equity multiple
- 1.01×
- Total profit
- $649
- Equity at exit
- $20,319
Cash invested: $65,800 (down + closing). Projections, not guarantees.
Landlord ↔ Tenant lean methodology
- Overall (STATE)
- 27 Tenant-Leaning
- State Connecticut
- 27 Tenant-Leaning · D+7
- County
- — inherits STATE
- City
- — inherits STATE
ZIP-level market 06770
- Home prices YoY
- -33.3%
- Rents YoY
- 6.2%
- Active inventory
- 112
- Price-to-rent
- 9.2×
Monthly cashflow live
- Estimated rent
- $2,135 high interval (Pro) →
- Mortgage (P&I)
- −$1,232
- Tax from tax record
- −$332 /mo · $3,979/yr
- Insurance
- −$98
- Flood insurance flood zone
- −$56 /mo · $666/yr
- HOA
- −$0
- Vacancy / Maint / Mgmt
- −$448
- Net cashflow
- $-31
Break-even live
Sensitivity live
| Price | -10% $102 | -5% $35 | +0% $-31 | +5% $-98 | +10% $-164 |
|---|---|---|---|---|---|
| Rent | -10% $-200 | -5% $-115 | +0% $-31 | +5% $53 | +10% $138 |
| Rate | -1.0pp $87 | -0.5pp $29 | base $-31 | +0.5pp $-92 | +1.0pp $-154 |
UW: 25.0% down · 7.5% · 30yr · 1.5% tax · 5.0% vac · 8.0% maint · 8.0% mgmt
Financing live
Cash to close
- Down payment
- $58,750
- Closing costs
- $7,050
- Reserves months
- —
- Total cash needed
- —
Loan-product check · same deal, 3 products live
Conventional
25% down · 7.5% · 30yr
- Down + closing
- —
- Monthly P&I
- —
- Monthly cashflow
- —
- DSCR
- —
- Eligible?
- —
Personal DTI + credit; lowest rate.
DSCR
20% down · 8.5% · 30yr
- Down + closing
- —
- Monthly P&I
- —
- Monthly cashflow
- —
- DSCR
- —
- Eligible?
- —
No personal income docs; deal must DSCR.
Hard money
10% down · 12.0% · 12mo
- Down + closing
- —
- Monthly P&I
- —
- Monthly cashflow
- —
- DSCR
- —
- Eligible?
- —
Short-term bridge; refi at stabilization.
Rent comps 26 comps
| Address | Beds | Baths | Sqft | Rent | $/sqft | DOM | Units | Dist |
|---|---|---|---|---|---|---|---|---|
| 550 High St Unit 2 Naugatuck, CT | 2.0 | 1.5 | 1100 | $2,500 | $2.27 | 44d | 1 | 0.07mi |
| 108 Curtiss St Naugatuck, CT | 2.0 | 1.0 | 1000 | $2,000 | $2.00 | 14d | 1 | 0.12mi |
| 223 Meadow St Naugatuck, CT | 2.0–3.0 | 1.0–1.5 | 1500 | $2,400 | $1.60 | 3d | 3 | 0.38mi |
| 304 Hillside Ave Naugatuck, CT | 2.0 | 1.0 | 1088 | $1,650 | $1.52 | 21d | 1 | 0.38mi |
| 48 Anderson St Naugatuck, CT | 4.0 | 1.0 | 1144 | $2,500 | $2.19 | 14d | 1 | 0.45mi |
| 49 Golden Hill St Unit 2 Naugatuck, CT | 3.0 | 1.0 | 1050 | $1,850 | $1.76 | 44d | 1 | 0.52mi |
| 299 High St Unit 2nd Floor Naugatuck, CT | 2.0 | 1.0 | 1000 | $1,500 | $1.50 | 3d | 1 | 0.55mi |
| 46 Carroll St Unit left side Naugatuck, CT | 2.0 | 2.0 | 1632 | $1,575 | $0.97 | 24d | 1 | 0.58mi |
| 63 Woodbine St Naugatuck, CT | 2.0 | 1.0 | 1150 | $1,400 | $1.22 | 44d | 1 | 0.60mi |
| 551 Main St Unit 1R Naugatuck, CT | 2.0 | 1.0 | 974 | $1,600 | $1.64 | 44d | 1 | 0.64mi |
| 270 Spring St Naugatuck, CT | 1.0–2.0 | 1.0 | 915 | $2,259 | $2.47 | 3d | 11 | 0.71mi |
| 270 Spring St Naugatuck, CT | 1.0–2.0 | 1.0 | 915 | $2,220 | $2.43 | 11d | 8 | 0.71mi |
| 303 Millville Ave Naugatuck, CT | 3.0 | 2.0 | 1518 | $2,500 | $1.65 | 11d | 1 | 0.77mi |
| 303 Millville Ave Naugatuck, CT | 3.0 | 1.5 | 1518 | $2,500 | $1.65 | 44d | 1 | 0.77mi |
| 8 Garden St Naugatuck, CT | 3.0 | 1.0 | 1401 | $2,000 | $1.43 | 44d | 1 | 0.79mi |
| 33 Pond St Naugatuck, CT | 2.0 | 1.0 | 1058 | $1,700 | $1.61 | 44d | 1 | 0.81mi |
| 139 Phyllis Dr Naugatuck, CT | 3.0 | 1.0 | 956 | $1,975 | $2.07 | 14d | 1 | 0.85mi |
| 111 Mallane Ln Unit 14D Naugatuck, CT | 2.0 | 1.5 | 1152 | $2,400 | $2.08 | 19d | 1 | 0.88mi |
| 56 Aetna St Unit 2B Naugatuck, CT | 2.0 | 1.0 | 900 | $1,690 | $1.88 | 24d | 1 | 0.89mi |
| 8 Scott St Unit 2 Naugatuck, CT | 3.0 | 1.0 | 1000 | $1,900 | $1.90 | 44d | 1 | 0.91mi |
| 516 S Main St Naugatuck, CT | 2.0 | 1.0 | 1730 | $1,425 | $0.82 | 3d | 1 | 1.14mi |
| 151 Andrew Ave Naugatuck, CT | 1.0–2.0 | 1.0 | 856 | $1,970 | $2.30 | 3d | 3 | 1.18mi |
| 49 Tudor Ln Naugatuck, CT | 3.0 | 1.5 | 1282 | $2,700 | $2.11 | 3d | 1 | 1.36mi |
| 675 Millville Ave Naugatuck, CT | 2.0 | 1.5 | 1472 | $2,100 | $1.43 | 3d | 1 | 1.43mi |
| 684 Field St Naugatuck, CT | 3.0 | 1.5 | 1718 | $2,200 | $1.28 | 24d | 1 | 1.46mi |
| 1585 Highland Ave Waterbury, CT | 2.0 | 1.5 | 1050 | $1,875 | $1.79 | 44d | 1 | 1.50mi |
Listing history 19 events
-
2026-06-18days on market $235,000 Active 89 DOM
-
2026-06-17days on market $235,000 Active 88 DOM
-
2026-06-16days on market $235,000 Active 87 DOM
-
2026-06-15days on market $235,000 Active 86 DOM
-
2026-06-14days on market $235,000 Active 84 DOM
-
2026-06-10days on market $235,000 Active 81 DOM
-
2026-06-09days on market $235,000 Active 80 DOM
-
2026-06-08days on market $235,000 Active 79 DOM
-
2026-06-07days on market $235,000 Active 78 DOM
-
2026-06-05days on market $235,000 Active 75 DOM
-
2026-06-03days on market $235,000 Active 74 DOM
-
2026-06-03days on market $235,000 Active 73 DOM
-
2026-06-01days on market $235,000 Active 72 DOM
-
2026-05-31days on market $235,000 Active 71 DOM
-
2026-04-22price $235,000 264-char remark
Show marketing remark (264 chars)
INVESTORS TAKE NOTICE. 6 room, 3 bedroom, 1 bath colonial with incredible potential! Newer oil-fired furnace and electric hot water heater. Walk-up attic access in 2nd floor bedroom area. Property to be sold AS IS and CASH ONLY. Tenant will provide showing access.
-
2026-03-20$259,000 Active 264-char remark
Show marketing remark (264 chars)
INVESTORS TAKE NOTICE. 6 room, 3 bedroom, 1 bath colonial with incredible potential! Newer oil-fired furnace and electric hot water heater. Walk-up attic access in 2nd floor bedroom area. Property to be sold AS IS and CASH ONLY. Tenant will provide showing access.
-
2014-10-08soldstatus $100,000
-
2014-10-07soldstatus $100,000 37-char remark
Show marketing remark (37 chars)
Solid older house in need of updating
-
2014-06-27$139,000 37-char remark
Show marketing remark (37 chars)
Solid older house in need of updating
ⓘ Source: listings_history table (triggers on properties + properties_extension) + one-shot
backfill from property_details.listing_events for pre-trigger history.
Tax reassessment forecast CT · Partial reset (capped growth)
- Current annual tax
- $3,979 · $332/mo
- Projected year-2 tax
- $4,504 · $375/mo
- Expected delta
- +$525/yr (+$44/mo · 13.2%)
ⓘ Screening estimate from a state-policy table — verify with the county assessor before closing.
Climate risk First Street
- Flood 9/10 Extreme FEMA zone X (shaded) · 99% chance over 30 yrs
- Wildfire 3/10 Moderate
- Heat 5/10 Major 7 d/yr ≥97°F today · 16 d/yr by 30 yrs out
- Wind 6/10 Major 27% chance of damaging wind over 30 yrs
- Air quality 3/10 Moderate 2 unhealthy d/yr today · 4 by 30 yrs out
Nearby sold comps map
Loading sold comps map…
Walkable amenities ~0.75 mi
Loading nearby amenities…
Taxation est. · year 1
- Rental income
- $25,615
- − Mortgage interest
- −$13,164
- − Property taxes
- −$3,979
- − Insurance
- −$1,842
- − Repairs & maintenance
- −$2,049
- − Management
- −$2,049
- − Depreciation
- −$6,836
- Taxable loss
- −$4,304
- Est. tax savings @ 24.0%
- +$1,033
- After-tax cash flow
- $660/yr
For passive investors: Depreciation is non-cash, so a rental often shows a tax loss while cash-flowing — sheltering income. Rental losses are passive: they offset passive income freely, and up to $25,000/yr can offset ordinary (W-2) income if you actively participate and your MAGI is under $100k (phasing out to $0 by $150k); unused losses carry forward. On sale, claimed depreciation is recaptured at up to 25%, and gains may owe capital-gains tax (a 1031 exchange can defer both). Figures are a year-1 estimate at your 24.0% rate — not tax advice; consult a CPA.
Schools (NCES district)
- District
- Naugatuck School District
- NCES district ID
- 0902640
- Math proficiency
- 32% ▼ -13.00%
- Reading proficiency
- 43% ▼ -11.00%
- Median HH income
- $61,060
- Composite
- 33.44/100
- National rank
- #5463
- State rank
- #105 of 153 in CT
Livability — Naugatuck
- Score
- 77/100
- State rank
- #42
- US rank
- #2997
Category grades
Schools grade is shown separately in the Schools card above.
Census & demographics
- Census place
- Naugatuck, CT
- County
- New Haven County · 688,236 people
- City population
- 31,823
- Metro
- New Haven-Milford, CT
- Population (ZIP)
- 31,823
- Household income
- $96,208
- Rent vs Own
- Severe rent burden
- 788.0
Population outlook (Naugatuck Valley County) Hauer SSP2
- By 2040
- 496,846
Race, ethnicity, and origin ACS 2023
- Neighborhood character
- Diverse neighborhood (Simpson 0.59)
- Race & ethnicity
- White 61% Hispanic / Latino 17% Two or more races 12% Black 11% Asian 4%
- Hispanic origin (detail)
- Puerto Rican 10% Dominican 1%
- Common ancestry
- Romanian 7% Russian 6% Lithuanian 4%
- Foreign-born
- 17% · Canada, Jamaica, China
- Languages at home
- 77% English-only · Spanish 10% Other Indo-European 7% Other Asian/Pacific 2%
Political lean MEDSL · Naugatuck Valley
- 2024 margin
- Lean R (+7.4) · D 45.6% · R 53.0% · Other 1.4%
- All cycles
- 2024: R+7.4
Not yet ingested
- Civics
- —
Market trends
- HPI YoY
- ▼ -108.73%
- Current HPI
- 217.6177
- Rent YoY
- ▲ 6.23%
- Metro
- New Haven-Milford, CT
- State GDP YoY
- ▲ 1.06%
- F500 in state
- 38
Industry mix (Fortune 500 HQ in CT)
| Industry | F500 HQs | Revenue |
|---|---|---|
| Industrial Machinery | 4 | $38B |
|
||
| Insurance | 3 | $71B |
|
||
| Financial Services | 2 | $25B |
|
||
| Transportation / Logistics | 2 | $18B |
|
||
| Healthcare | 1 | $247B |
|
||
| Telecommunications | 1 | $55B |
|
||
Price history
+69.1% since first listed5 events — show timeline
- 2026-04-22 Price Changed $235,000 Smart MLS
- 2026-03-20 Listed $259,000 Smart MLS
- 2014-10-08 Sold (Public Records) $100,000 Public Records
- 2014-10-07 Sold (MLS) $100,000 Smart MLS
- 2014-06-27 Listed $139,000 Smart MLS
Property tax history
+1.9%/yrLatest (2022): $3,979 · +0.0% YoY. Source: county tax records.
Cash-flow waterfall
monthlySold comps — $/sqft
last 12 mo · ≤1 miLoading sold comps…