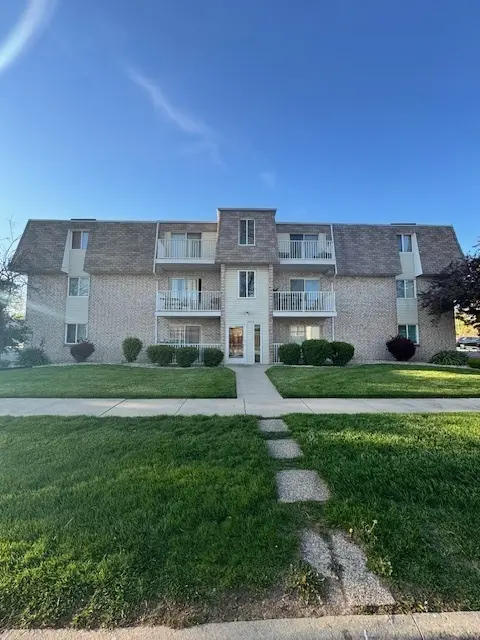
2614 E Goodrich Ave Unit 3A · Burnham, IL
Flood risk 1/10 · Minimal
- FEMA flood zone
- X (unshaded)
- Chance of flooding over 30 yrs
- 0.0%
- Est. flood insurance / yr
- $507 – $1,088
Fire risk 1/10 · Minimal
- Est. fire insurance / yr
- $804 – $1,492
Heat risk 3/10 · Minor
- Hot days now (above 102°F)
- 7 days/yr
- Hot days in 30 yrs
- 15 days/yr
Wind risk 2/10 · Minimal
- Chance of severe wind over 30 yrs
- —
Air-quality risk 4/10 · Minor
- Unhealthy air days now
- 4 days/yr
- Unhealthy air days in 30 yrs
- 5 days/yr
Risk factors via First Street. Map © Google.
Why this score? — see what drove the D grade
The composite is a weighted blend of 9 inputs, each scored 0–100. Each bar is that input's sub-score; the figure is the points it added to the 100-point composite (weight × sub-score).
- Cash flow +13.1/30.0
- ARV discount +7.5/15.0
- 1% rule +7.0/10.0
- DSCR +3.9/10.0
- Livability +3.7/5.0
- Rent growth +2.5/5.0
- Condition / age +2.5/5.0
- Schools +1.0/10.0
- Appreciation +0.0/10.0
$119,900
🖨 Deal sheet (PDF) 📄 Offer letter ✓ Due diligence
Listing remarks
THIS SPACIOUS END UNIT 2 BEDROOM, 2 BATH CONDO. EXCELLENT LOCATION ~ THE GOODRICH COMMONS. .. THIS LARGE UNIT FEATURES MASTER BDRM WITH PRIVATE BATH, BALCONY OFF LIVING ROOM- APPLIANCES AND WASHER/DRYER PLUS 1 CAR GARAGE. JUST A LITTLE TLC WILL DO IT!!! THIS CONDO IS LOCATED NEAR BUS ROUTES, THE METRA AND INTERSTATE ACCESS. COME SEE THE POTENTIAL FOR YOURSELF!
Key facts
- Near metra
- Near bus routes
- Private bath
Tags
Neighborhood map
What this means for you Summary
Snapshot
- This is a 2-bed/2.0-bath condo listed at $120k.
Deal economics
- At list price, monthly cash flow is $-4 ($-43/yr) — negative.
- To cash-flow at today's rent, offer at most $119k (0.5% below list).
- Meets the 1% rule at list price ($1k rent vs $120k).
- Recommended offer: $116k (3.0% below list) — sets the bar for market timing.
Location & tenants
- Location reads 74/100 on livability (#264 in IL, #4,889 nationally) — a middle-class / working-renter tenant base. Strengths: commute A+, cost of living A+, housing A+; Watch: employment D+, amenities F, health & safety F.
- Thornton Fractional Twp Hsd 215 (suburban): math 9% / reading 13% proficiency, ranked #563 of 620 in IL (top 91%) — low school quality limits family demand, transient renter base, plan for 1-2y turnover.
- Zoned schools: Wilson Elementary School (366 students, 0% FRL); Wentworth Jr High School (math 10% / reading 13%, grade F, #571 of 665 statewide, top 86%, 311 students, 0% FRL); Thornton Fractnl No High School (math 6% / reading 10%, grade F, #587 of 693 statewide, top 85%, 1,383 students, 0% FRL).
- Market conditions: 23 active listings in the ZIP; 26 comparable units currently listed for rent nearby; rentals at typical pace (median 16d on market — plan ~3-4 weeks tenant-placement turnaround); 6,272 units permitted in Cook County in 2024 (4,658 in 5+ unit buildings).
Forward outlook
- Local home prices are declining (-3.0%/yr); year-one equity from $829 of loan paydown is wiped out by about $4k of value loss. Plan a longer hold.
Negotiation context
- It's been on market 40 days — a 3% lower offer ($116k) is reasonable based on typical stale-listing flexibility.
- 5 sale attempts with the ask held roughly flat each time — persistent listings suggest the price (not the market) is what's stuck; bring a comps-based counter.
- Current owner paid $22k; list at $120k implies a 433% gain — meaningful room to come down on a strong offer.
Risks & watch-outs
- Watch-outs: property tax is 2.6% of price.
Questions for the listing agent
- What do current leases actually rent for vs. the listed asking? Can we see a recent rent roll and the last 12 months of T-12 income?
- It's been on market 40 days. Have you received any prior offers? Is the seller open to a 3% concession, seller financing, or rate buy-down credit?
- Property tax is high relative to price — has the assessment been appealed recently, and will the sale trigger a re-assessment?
- What does the HOA fee cover, when was the last increase, and are there any pending special assessments or reserve-fund shortfalls?
- Any open or pending special assessments — roof, HVAC, plumbing, elevator, façade? What's the per-unit balance and payoff schedule, and is the seller paying it off at close or rolling it to the buyer?
- Is there a deadline driving the sale (1031 exchange, divorce, estate, relocation)? That informs how much negotiation room exists.
- Schools are F-rated, which usually means shorter tenancies and higher turnover. Who's the typical renter profile here, and what's been the actual vacancy rate?
- The area grade is low — what's the realistic commute time and amenity access for the typical tenant pool here? Any planned neighborhood developments (good or bad) we should know about?
- What's the average days-on-market for RENTAL listings here right now (not sales)? A rising rental-DOM trend means longer vacancies and softer asking-rent achievability than the comps imply.
- What's the recent tenant-quality profile in this submarket — average credit score on applications, eviction rate, late-payment / NSF rate, and stable-employment percentage? A property-management company in the area should have these aggregated.
- How much new apartment / multifamily construction is in the pipeline within 1–3 miles? Heavy new supply (>2% of stock underway) typically softens rents 12–24 months out; light construction supports rent growth.
Investment metrics
- 1% rule
- 1.20% ✓
- Cap rate
- 6.26%
- Cash-on-cash
- -0.13%
- DSCR
- 0.99
- GRM
- 6.9
CMA / ARV
No comps found within radius.
Projected returns pro-forma
-3.0% appreciation · 3.0% rent growth · sell at horizon
- IRR
- -16.3%
- Equity multiple
- 0.42×
- Total profit
- $-19,445
- Equity at exit
- $17,877
- IRR
- -7.7%
- Equity multiple
- 0.51×
- Total profit
- $-16,360
- Equity at exit
- $10,367
Cash invested: $33,572 (down + closing). Projections, not guarantees.
Landlord ↔ Tenant lean methodology
- Overall (STATE)
- 43 Moderately Tenant-Leaning
- State Illinois
- 43 Moderately Tenant-Leaning · D+7
- County
- — inherits STATE
- City
- — inherits STATE
ZIP-level market 60633
- Home prices YoY
- -24.8%
- Active inventory
- 23
- Price-to-rent
- 6.9×
Monthly cashflow live
- Estimated rent
- $1,439 high interval (Pro) →
- Mortgage (P&I)
- −$629
- Tax from tax record
- −$262 /mo · $3,140/yr
- Insurance
- −$50
- HOA
- −$200
- Vacancy / Maint / Mgmt
- −$302
- Net cashflow
- $-4
Break-even live
Sensitivity live
| Price | -10% $64 | -5% $30 | +0% $-4 | +5% $-38 | +10% $-71 |
|---|---|---|---|---|---|
| Rent | -10% $-117 | -5% $-60 | +0% $-4 | +5% $53 | +10% $110 |
| Rate | -1.0pp $57 | -0.5pp $27 | base $-4 | +0.5pp $-35 | +1.0pp $-66 |
UW: 25.0% down · 7.5% · 30yr · 1.5% tax · 5.0% vac · 8.0% maint · 8.0% mgmt
Financing live
Cash to close
- Down payment
- $29,975
- Closing costs
- $3,597
- Reserves months
- —
- Total cash needed
- —
Loan-product check · same deal, 3 products live
Conventional
25% down · 7.5% · 30yr
- Down + closing
- —
- Monthly P&I
- —
- Monthly cashflow
- —
- DSCR
- —
- Eligible?
- —
Personal DTI + credit; lowest rate.
DSCR
20% down · 8.5% · 30yr
- Down + closing
- —
- Monthly P&I
- —
- Monthly cashflow
- —
- DSCR
- —
- Eligible?
- —
No personal income docs; deal must DSCR.
Hard money
10% down · 12.0% · 12mo
- Down + closing
- —
- Monthly P&I
- —
- Monthly cashflow
- —
- DSCR
- —
- Eligible?
- —
Short-term bridge; refi at stabilization.
Rent comps 26 comps
| Address | Beds | Baths | Sqft | Rent | $/sqft | DOM | Units | Dist |
|---|---|---|---|---|---|---|---|---|
| 2790 E State St Apt 2E Burnham, IL | 3.0 | 2.0 | 1100 | $1,695 | $1.54 | 26d | 1 | 0.19mi |
| 14501 Torrence Ave Unit 1B Chicago, IL | 1.0 | 1.0 | 675 | $1,095 | $1.62 | 12d | 1 | 0.31mi |
| 14501 S Torrence Ave Chicago, IL | 1.0–2.0 | 1.0 | 737 | $1,250 | $1.69 | 14d | 2 | 0.31mi |
| 14501 Torrence Ave Unit 3A Burnham, IL | 2.0 | 1.0 | 800 | $1,250 | $1.56 | 12d | 1 | 0.31mi |
| 14507 Torrence Ave Unit 3C Burnham, IL | 1.0 | 1.0 | 675 | $1,150 | $1.70 | 12d | 1 | 0.31mi |
| 14507 Torrence Ave Unit 1C Burnham, IL | 1.0 | 1.0 | 675 | $1,095 | $1.62 | 12d | 1 | 0.31mi |
| 14500 Torrence Ave Unit 1B Burnham, IL | 1.0 | 1.0 | 675 | $1,195 | $1.77 | 26d | 1 | 0.33mi |
| 14500 S Torrence Ave Apt 1C Burnham, IL | 1.0 | 1.0 | 675 | $1,195 | $1.77 | 1d | 1 | 0.35mi |
| 14446 Torrence Ave Unit 2C Burnham, IL | 1.0 | 1.0 | 700 | $1,195 | $1.71 | 26d | 1 | 0.35mi |
| 1601 Downs Dr Unit 3S Calumet City, IL | 2.0 | 1.0 | 750 | $1,400 | $1.87 | 26d | 1 | 0.59mi |
| 250 Yates Ave Unit 1616 Dolton 1E Calumet City, IL | 2.0 | 1.0 | 875 | $1,465 | $1.67 | 9d | 1 | 0.59mi |
| 101 Oglesby Ave Calumet City, IL | 2.0 | 1.0 | 1100 | $1,800 | $1.64 | 14d | 1 | 0.62mi |
| 101 Oglesby Ave Calumet City, IL | 2.0 | 1.0 | 1000 | $1,800 | $1.80 | 21d | 1 | 0.62mi |
| 101 Oglesby Ave Calumet City, IL | 2.0 | 1.0 | 1000 | $1,800 | $1.80 | 24d | 1 | 0.62mi |
| 460 Hoxie Ave Unit R Calumet City, IL | 2.0 | 1.0 | 800 | $1,650 | $2.06 | 9d | 1 | 0.66mi |
| 460 Hoxie Ave Unit R Calumet City, IL | 2.0 | 1.0 | 800 | $1,650 | $2.06 | 16d | 1 | 0.66mi |
| 486 Buffalo Ave Unit 1C Calumet City, IL | 1.0 | 1.0 | 800 | $1,500 | $1.88 | 26d | 1 | 0.77mi |
| 486 Buffalo Ave Unit 1D Calumet City, IL | 1.0 | 1.0 | 800 | $975 | $1.22 | 26d | 1 | 0.77mi |
| 1860 State St Calumet City, IL | 3.0 | 1.0 | 1100 | $1,800 | $1.64 | 19d | 1 | 0.91mi |
| 405 Clyde Ave Calumet City, IL | 3.0 | 1.0 | 973 | $2,300 | $2.36 | 0d | 1 | 1.01mi |
| 634 Sibley Blvd Calumet City, IL | 1.0–2.0 | 1.0 | 710 | $1,450 | $2.04 | 6d | 2 | 1.10mi |
| 495 Madison Ave Unit 1D Calumet City, IL | 1.0 | 1.0 | 595 | $1,175 | $1.97 | 16d | 1 | 1.27mi |
| 323 Memorial Dr #1 Calumet City, IL | 1.0 | 1.0 | 1000 | $1,250 | $1.25 | 26d | 1 | 1.31mi |
| 323 Memorial Dr Unit 2 Calumet City, IL | 2.0 | 1.0 | 1000 | $1,600 | $1.60 | 26d | 1 | 1.31mi |
| 14610 Blackstone Ave Dolton, IL | 3.0 | 1.0 | 1017 | $2,400 | $2.36 | 8d | 1 | 1.46mi |
| 14738 Blackstone Ave Dolton, IL | 3.0 | 1.0 | 1017 | $2,400 | $2.36 | 12d | 1 | 1.49mi |
HOA detail condo
- Monthly dues
- $200 · $2,400/yr
- Assessments
- None detected in remarks — confirm with the listing agent.
Listing history 24 events
-
2026-06-21days on market $119,900 Active 40 DOM
-
2026-06-18days on market $119,900 Active 37 DOM
-
2026-06-17days on market $119,900 Active 36 DOM
-
2026-06-16days on market $119,900 Active 35 DOM
-
2026-06-15days on market $119,900 Active 34 DOM
-
2026-06-13days on market $119,900 Active 32 DOM
-
2026-06-09days on market $119,900 Active 28 DOM
-
2026-06-08days on market $119,900 Active 27 DOM
-
2026-06-07days on market $119,900 Active 26 DOM
-
2026-06-04days on market $119,900 Active 23 DOM
-
2026-06-03days on market $119,900 Active 22 DOM
-
2026-06-02days on market $119,900 Active 21 DOM
-
2026-06-01days on market $119,900 Active 20 DOM
-
2026-05-31days on market $119,900 Active 19 DOM
-
2026-05-12$119,900 Active
-
2026-04-22historical
-
2026-03-26Active
-
2025-09-01historical $1,500
-
2025-05-28$1,500
-
2025-05-22historical
-
2025-05-12Active
-
2025-05-06historical
-
2025-04-08Active
-
2015-05-07soldstatus $22,500
ⓘ Source: listings_history table (triggers on properties + properties_extension) + one-shot
backfill from property_details.listing_events for pre-trigger history.
Tax reassessment forecast IL · Partial reset (capped growth)
- Current annual tax
- $3,140 · $262/mo
- Projected year-2 tax
- $3,140 · $262/mo
- Expected delta
- $0/yr ($0/mo · 0.0%)
ⓘ Screening estimate from a state-policy table — verify with the county assessor before closing.
Climate risk First Street
- Flood 1/10 Low FEMA zone X (unshaded) · 0% chance over 30 yrs
- Wildfire 1/10 Low
- Heat 3/10 Moderate 7 d/yr ≥102°F today · 15 d/yr by 30 yrs out
- Wind 2/10 Low
- Air quality 4/10 Moderate 4 unhealthy d/yr today · 5 by 30 yrs out
Nearby sold comps map
Loading sold comps map…
Walkable amenities ~0.75 mi
Loading nearby amenities…
Taxation est. · year 1
- Rental income
- $17,268
- − Mortgage interest
- −$6,716
- − Property taxes
- −$3,140
- − Insurance
- −$600
- − Repairs & maintenance
- −$1,381
- − Management
- −$1,381
- − HOA
- −$2,400
- − Depreciation
- −$3,488
- Taxable loss
- −$1,839
- Est. tax savings @ 24.0%
- +$441
- After-tax cash flow
- $398/yr
For passive investors: Depreciation is non-cash, so a rental often shows a tax loss while cash-flowing — sheltering income. Rental losses are passive: they offset passive income freely, and up to $25,000/yr can offset ordinary (W-2) income if you actively participate and your MAGI is under $100k (phasing out to $0 by $150k); unused losses carry forward. On sale, claimed depreciation is recaptured at up to 25%, and gains may owe capital-gains tax (a 1031 exchange can defer both). Figures are a year-1 estimate at your 24.0% rate — not tax advice; consult a CPA.
Schools (NCES district)
- District
- Thornton Fractional Twp Hsd 215
- NCES district ID
- 1738940
- Math proficiency
- 9% ▼ -3.00%
- Reading proficiency
- 13% ▼ -3.00%
- Median HH income
- $48,207
- Composite
- 10.27/100
- National rank
- #9793
- State rank
- #563 of 620 in IL
Livability — Burnham
- Score
- 74/100
- State rank
- #264
- US rank
- #4889
Category grades
Schools grade is shown separately in the Schools card above.
Census & demographics
- Census place
- Burnham, IL
- Population (ZIP)
- 12,485
Population outlook (Cook County) Hauer SSP2
- Today (2025)
- 5,347,519 people
- By 2030
- 5,357,703 · +0.2%
- By 2040
- 5,324,924 · -0.4%
- By 2050
- 5,230,762 · -2.2%
- By 2075
- 4,785,735 · -10.5%
- By 2100
- 4,188,836 · -21.7%
Race, ethnicity, and origin ACS 2023
- Neighborhood character
- Diverse neighborhood (Simpson 0.65)
- Race & ethnicity
- Hispanic / Latino 45% Black 29% White 25% Two or more races 13%
- Hispanic origin (detail)
- Mexican 40% Puerto Rican 3%
- Common ancestry
- Romanian 12% Armenian 2% Iranian 1%
- Foreign-born
- 15% · Canada
- Languages at home
- 69% English-only · Spanish 27% Arabic 2% Other Indo-European 1%
Political lean MEDSL · Cook
- 2024 margin
- Solid D (+42.0) · D 70.4% · R 28.4% · Other 1.2%
- 2008→2024 swing
- -11.4pp toward R · 2008: 53.4pp · 2024: 42.0pp
- All cycles
- 2024: D+42.0 2020: D+50.3 2016: D+53.0 2012: D+49.4 2008: D+53.4
Not yet ingested
- Civics
- —
Market trends
- HPI YoY
- ▼ -90.46%
- Current HPI
- 274.4127
- Rent YoY
- —
- Metro
- —
- State GDP YoY
- ▲ 1.59%
- F500 in state
- 60
Industry mix (Fortune 500 HQ in IL)
| Industry | F500 HQs | Revenue |
|---|---|---|
| Insurance | 4 | $201B |
|
||
| Consumer Goods | 4 | $87B |
|
||
| Industrial Machinery | 3 | $64B |
|
||
| Healthcare | 2 | $55B |
|
||
| Retail / Pharmacy | 1 | $148B |
|
||
| Agriculture / Food | 1 | $86B |
|
||
Price history
+432.9% since first listed10 events — show timeline
- 2026-05-12 Listed $119,900 MRED as Distributed by MLS Grid
- 2026-04-22 Listing Removed — MRED as Distributed by MLS Grid
- 2026-03-26 Listed — MRED as Distributed by MLS Grid
- 2025-09-01 Rental Removed $1,500 MRED
- 2025-05-28 Listed for Rent $1,500 MRED
- 2025-05-22 Listing Removed — MRED as Distributed by MLS Grid
- 2025-05-12 Listed — MRED as Distributed by MLS Grid
- 2025-05-06 Listing Removed — MRED as Distributed by MLS Grid
- 2025-04-08 Listed — MRED as Distributed by MLS Grid
- 2015-05-07 Sold (Public Records) $22,500 Public Records
Property tax history
+2.2%/yrLatest (2023): $3,140 · +5042.5% YoY. Source: county tax records.
Cash-flow waterfall
monthlySold comps — $/sqft
last 12 mo · ≤1 miLoading sold comps…