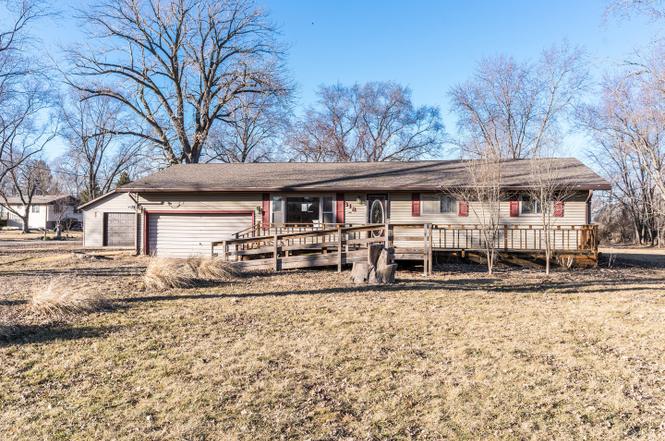
318 W Main St · Braceville, IL
Flood risk 3/10 · Minor
- FEMA flood zone
- X (unshaded)
- Chance of flooding over 30 yrs
- 0.2%
- Est. flood insurance / yr
- $473 – $860
Fire risk 3/10 · Minor
- Est. fire insurance / yr
- $804 – $1,492
Heat risk 3/10 · Minor
- Hot days now (above 104°F)
- 7 days/yr
- Hot days in 30 yrs
- 16 days/yr
Wind risk 2/10 · Minimal
- Chance of severe wind over 30 yrs
- 1.0%
Air-quality risk 2/10 · Minimal
- Unhealthy air days now
- 1 days/yr
- Unhealthy air days in 30 yrs
- 2 days/yr
Risk factors via First Street. Map © Google.
Why this score? — see what drove the C- grade
The composite is a weighted blend of 9 inputs, each scored 0–100. Each bar is that input's sub-score; the figure is the points it added to the 100-point composite (weight × sub-score).
- ARV discount +15.0/15.0
- Cash flow +12.3/30.0
- 1% rule +4.8/10.0
- Appreciation +4.5/10.0
- DSCR +3.6/10.0
- Livability +3.2/5.0
- Schools +2.6/10.0
- Rent growth +2.5/5.0
- Condition / age +2.5/5.0
$159,900
🖨 Deal sheet (PDF) 📄 Offer letter ✓ Due diligence
Listing remarks
Adorable corner lot 3 bedroom, 1 bath ranch home sitting on oversized 150x150 lot. Traditional layout with living room, kitchen, bedrooms and laundry room. BONUS: 4 car garage, 2 car attached and 2 car detached garage is perfect for the car enthusiast/mechanic. Large kitchen has 32" cabinets/gooseneck faucet and laminate flooring. Boiler heat and wall ac units.
Key facts
- Laminate flooring
- 4 car garage
- Large kitchen
Tags
Property features AI
Finance
- Other: Fee simple ownership
- HOA & community: No master association fee required
Exterior
- Parking: Attached and detached garage space (4 garage spaces total, 4 parking total)
- Utilities: Public water; Public sewer; Electric with circuit breakers
- Home design: Detached single-family home; One-story
- Construction: Vinyl siding; Built approximately 61–70 years ago; Home built before 1978
- Exterior features: Half-acre to one-acre lot (approx. 0.50–0.99 acre); Lot dimensions approximately 150 x 150
Interior
- Kitchen: Kitchen on main level (19 x 14); Wood laminate flooring in kitchen
- Bedrooms: Master bedroom on main level (13 x 12); Bedroom on main level (12 x 11); Bedroom on main level (11 x 11)
- Flooring: Carpet in living areas and bedrooms; Wood laminate in kitchen; Other flooring in laundry
- Bathrooms: One full bathroom
- Heating & cooling: Forced air heating; Wall unit cooling
- Interior features: Five total rooms; Crawl space basement
- Laundry & utility: Main-level laundry room (8 x 8)
Neighborhood map
What this means for you Summary
Snapshot
- This is a 3-bed/1.0-bath single-family listed at $160k.
Deal economics
- At list price, monthly cash flow is $-30 ($-359/yr) — negative.
- To cash-flow at today's rent, offer at most $155k (3.3% below list).
- To meet the 1% rule (rent ≥ 1% of price), the offer needs to be $156k (2.2% below list).
- Recommended offer: $150k (6.0% below list) — sets the bar for market timing.
Location & tenants
- Location reads 63/100 on livability (#814 in IL) — a middle-class / working-renter tenant base. Strengths: cost of living A+, housing A+, employment A; Watch: crime C-, health & safety C-, amenities F.
- Gardner S Wilmington Twp Hsd 73 (rural): math 20% / reading 30% proficiency, ranked #567 of 919 in IL (top 62%) — low school quality limits family demand, transient renter base, plan for 1-2y turnover.
- Zoned schools: Braceville Elem School (math 12% / reading 2%, grade F, #1,673 of 2,056 statewide, top 84%, 122 students, 0% FRL); Gardner-South Wilmington Twp H S (math 24% / reading 34%, grade F, #187 of 693 statewide, top 30%, 147 students, 0% FRL).
- Market conditions: 13 active listings in the ZIP; 84 units permitted in Grundy County in 2024 (0 in 5+ unit buildings).
Forward outlook
- Local home prices are declining (-1.0%/yr); year-one equity from $1k of loan paydown is wiped out by about $2k of value loss. Plan a longer hold.
- Grundy County population projected to shrink 9% by 2050 — rents likely to lag national; underwrite the cash flow, not the appreciation.
Negotiation context
- It's been on market 79 days — a 6% lower offer ($150k) is reasonable based on typical stale-listing flexibility.
- 2 sale attempts; this cycle's ask has dropped $10k (6%) from the opening price — seller is motivated, your offer sets the floor, not the list.
Risks & watch-outs
- Watch-outs: property tax is 2.7% of price.
Questions for the listing agent
- What do current leases actually rent for vs. the listed asking? Can we see a recent rent roll and the last 12 months of T-12 income?
- It's been on market 79 days. Have you received any prior offers? Is the seller open to a 6% concession, seller financing, or rate buy-down credit?
- Built in 1960 — when were the roof, HVAC, electrical panel, plumbing, and water heater last replaced?
- Property tax is high relative to price — has the assessment been appealed recently, and will the sale trigger a re-assessment?
- Why hasn't it sold? Are there any deal-killer items the seller is aware of (foundation, flood, title, zoning, code violations)?
- Is there a deadline driving the sale (1031 exchange, divorce, estate, relocation)? That informs how much negotiation room exists.
- Schools are F-rated, which usually means shorter tenancies and higher turnover. Who's the typical renter profile here, and what's been the actual vacancy rate?
- What's the average days-on-market for RENTAL listings here right now (not sales)? A rising rental-DOM trend means longer vacancies and softer asking-rent achievability than the comps imply.
- What's the recent tenant-quality profile in this submarket — average credit score on applications, eviction rate, late-payment / NSF rate, and stable-employment percentage? A property-management company in the area should have these aggregated.
- How much new for-sale + rental construction is in the pipeline within 1–3 miles? Heavy new supply typically softens prices + rents 12–24 months out; constrained supply supports both.
Investment metrics
- 1% rule
- 0.98% ✗
- Cap rate
- 6.07%
- Cash-on-cash
- -0.80%
- DSCR
- 0.96
- GRM
- 8.5
CMA / ARV
- ARV (on-the-fly)
- $236,160
- Comps found
- 8
Show comp detail 8 sales within ~0.75 mi
| Address | Dist | Beds/Ba | Sqft | Sold | Price | $/sf | Match |
|---|---|---|---|---|---|---|---|
| 216 W Main St | 0.08mi | 4/1.0 (+1) | 1,512 (+5%) | 6mo | $180,000 | $119 | 78 |
| 109 N Van Horn St | 0.07mi | 3/2.0 | 1,354 (-6%) | 8mo | $199,999 | $148 | 76 |
| 504 Settlers Trl | 0.25mi | 3/2.0 | 1,456 (+1%) | 14mo | $297,000 | $204 | 71 |
| 133 E Gould St | 0.29mi | 3/2.0 | 1,414 (-2%) | 12mo | $253,000 | $179 | 70 |
| 206 Gould St | 0.09mi | 3/1.0 | 1,256 (-13%) | 6mo | $175,000 | $139 | 69 |
| 409 W Division St | 0.34mi | 3/2.0 | 1,520 (+6%) | 12mo | $250,000 | $164 | 61 |
| 414 N Carey St | 0.47mi | 2/2.0 (-1) | 1,404 (-2%) | 20mo | $220,000 | $157 | 48 |
| 602 W North St | 0.23mi | 2/1.5 (-1) | 1,240 (-14%) | 16mo | $245,000 | $198 | 46 |
Match score weights: distance 35% · size 25% · config 20% · recency 20%. Top-matched comps best support the ARV.
Projected returns pro-forma
-1.01% appreciation · 3.0% rent growth · sell at horizon
- IRR
- -7.2%
- Equity multiple
- 0.69×
- Total profit
- $-13,897
- Equity at exit
- $38,517
- IRR
- -0.3%
- Equity multiple
- 0.98×
- Total profit
- $-1,110
- Equity at exit
- $40,376
Cash invested: $44,772 (down + closing). Projections, not guarantees.
Landlord ↔ Tenant lean methodology
- Overall (STATE)
- 43 Moderately Tenant-Leaning
- State Illinois
- 43 Moderately Tenant-Leaning · D+7
- County
- — inherits STATE
- City
- — inherits STATE
ZIP-level market 60407
- Home prices YoY
- -0.5%
- Active inventory
- 13
- Price-to-rent
- 8.5×
Monthly cashflow live
- Estimated rent
- $1,564 medium interval (Pro) →
- Mortgage (P&I)
- −$839
- Tax from tax record
- −$360 /mo · $4,324/yr
- Insurance
- −$67
- HOA
- −$0
- Vacancy / Maint / Mgmt
- −$328
- Net cashflow
- $-30
Break-even live
Sensitivity live
| Price | -10% $61 | -5% $15 | +0% $-30 | +5% $-75 | +10% $-120 |
|---|---|---|---|---|---|
| Rent | -10% $-153 | -5% $-92 | +0% $-30 | +5% $32 | +10% $94 |
| Rate | -1.0pp $51 | -0.5pp $11 | base $-30 | +0.5pp $-71 | +1.0pp $-113 |
UW: 25.0% down · 7.5% · 30yr · 1.5% tax · 5.0% vac · 8.0% maint · 8.0% mgmt
Financing live
Cash to close
- Down payment
- $39,975
- Closing costs
- $4,797
- Reserves months
- —
- Total cash needed
- —
Loan-product check · same deal, 3 products live
Conventional
25% down · 7.5% · 30yr
- Down + closing
- —
- Monthly P&I
- —
- Monthly cashflow
- —
- DSCR
- —
- Eligible?
- —
Personal DTI + credit; lowest rate.
DSCR
20% down · 8.5% · 30yr
- Down + closing
- —
- Monthly P&I
- —
- Monthly cashflow
- —
- DSCR
- —
- Eligible?
- —
No personal income docs; deal must DSCR.
Hard money
10% down · 12.0% · 12mo
- Down + closing
- —
- Monthly P&I
- —
- Monthly cashflow
- —
- DSCR
- —
- Eligible?
- —
Short-term bridge; refi at stabilization.
Listing history 5 events
-
2026-05-21status Pending
-
2026-04-23price $159,900
-
2026-04-06status Active
-
2026-03-26status Pending
-
2026-02-19$169,900 Active
ⓘ Source: listings_history table (triggers on properties + properties_extension) + one-shot
backfill from property_details.listing_events for pre-trigger history.
Tax reassessment forecast IL · Partial reset (capped growth)
- Current annual tax
- $4,324 · $360/mo
- Projected year-2 tax
- $4,324 · $360/mo
- Expected delta
- $0/yr ($0/mo · 0.0%)
ⓘ Screening estimate from a state-policy table — verify with the county assessor before closing.
Climate risk First Street
- Flood 3/10 Moderate FEMA zone X (unshaded) · 20% chance over 30 yrs
- Wildfire 3/10 Moderate
- Heat 3/10 Moderate 7 d/yr ≥104°F today · 16 d/yr by 30 yrs out
- Wind 2/10 Low 100% chance of damaging wind over 30 yrs
- Air quality 2/10 Low 1 unhealthy d/yr today · 2 by 30 yrs out
Nearby sold comps map
Loading sold comps map…
Walkable amenities ~0.75 mi
Loading nearby amenities…
Taxation est. · year 1
- Rental income
- $18,768
- − Mortgage interest
- −$8,957
- − Property taxes
- −$4,324
- − Insurance
- −$800
- − Repairs & maintenance
- −$1,501
- − Management
- −$1,501
- − Depreciation
- −$4,652
- Taxable loss
- −$2,966
- Est. tax savings @ 24.0%
- +$712
- After-tax cash flow
- $353/yr
For passive investors: Depreciation is non-cash, so a rental often shows a tax loss while cash-flowing — sheltering income. Rental losses are passive: they offset passive income freely, and up to $25,000/yr can offset ordinary (W-2) income if you actively participate and your MAGI is under $100k (phasing out to $0 by $150k); unused losses carry forward. On sale, claimed depreciation is recaptured at up to 25%, and gains may owe capital-gains tax (a 1031 exchange can defer both). Figures are a year-1 estimate at your 24.0% rate — not tax advice; consult a CPA.
Schools (NCES district)
- District
- Gardner S Wilmington Twp Hsd 73
- NCES district ID
- 1716260
- Math proficiency
- 20% ▬ 0.00%
- Reading proficiency
- 30% ▬ 0.00%
- Median HH income
- $61,618
- Composite
- 26.19/100
- National rank
- #12712
- State rank
- #567 of 919 in IL
Livability — Braceville
- Score
- 63/100
- State rank
- #814
- US rank
- #16042
Category grades
Schools grade is shown separately in the Schools card above.
Census & demographics
- Census place
- Braceville, IL
- Population (ZIP)
- 1,723
Population outlook (Grundy County) Hauer SSP2
- Today (2025)
- 50,716 people
- By 2030
- 50,218 · -1.0%
- By 2040
- 48,599 · -4.2%
- By 2050
- 46,212 · -8.9%
- By 2075
- 40,033 · -21.1%
- By 2100
- 32,966 · -35.0%
Race, ethnicity, and origin ACS 2023
- Neighborhood character
- Predominantly White (86%)
- Race & ethnicity
- White 86% Hispanic / Latino 12% Two or more races 1%
- Hispanic origin (detail)
- Mexican 12%
- Common ancestry
- Romanian 7% Slovak 2% Iranian 1%
- Foreign-born
- 1%
- Languages at home
- 97% English-only · Spanish 1% Other Asian/Pacific 1%
Political lean MEDSL · Grundy
- 2024 margin
- Strong R (+29.6) · D 34.5% · R 64.0% · Other 1.5%
- 2008→2024 swing
- -31.3pp toward R · 2008: 1.7pp · 2024: -29.6pp
- All cycles
- 2024: R+29.6 2020: R+25.8 2016: R+23.6 2012: R+9.0 2008: D+1.7
Not yet ingested
- Civics
- —
Market trends
- HPI YoY
- ▼ -1.01%
- Current HPI
- 187.8
- Rent YoY
- —
- Metro
- —
- State GDP YoY
- ▲ 1.59%
- F500 in state
- 60
Industry mix (Fortune 500 HQ in IL)
| Industry | F500 HQs | Revenue |
|---|---|---|
| Insurance | 4 | $201B |
|
||
| Consumer Goods | 4 | $87B |
|
||
| Industrial Machinery | 3 | $64B |
|
||
| Healthcare | 2 | $55B |
|
||
| Retail / Pharmacy | 1 | $148B |
|
||
| Agriculture / Food | 1 | $86B |
|
||
Price history
-5.9% since first listed5 events — show timeline
- 2026-05-21 Pending — MRED as Distributed by MLS Grid
- 2026-04-23 Price Changed $159,900 MRED as Distributed by MLS Grid
- 2026-04-06 Relisted — MRED as Distributed by MLS Grid
- 2026-03-26 Pending — MRED as Distributed by MLS Grid
- 2026-02-19 Listed $169,900 MRED as Distributed by MLS Grid
Property tax history
+3.5%/yrLatest (2024): $4,324 · +4.0% YoY. Source: county tax records.
Cash-flow waterfall
monthlySold comps — $/sqft
last 12 mo · ≤1 miLoading sold comps…