 Multi-family
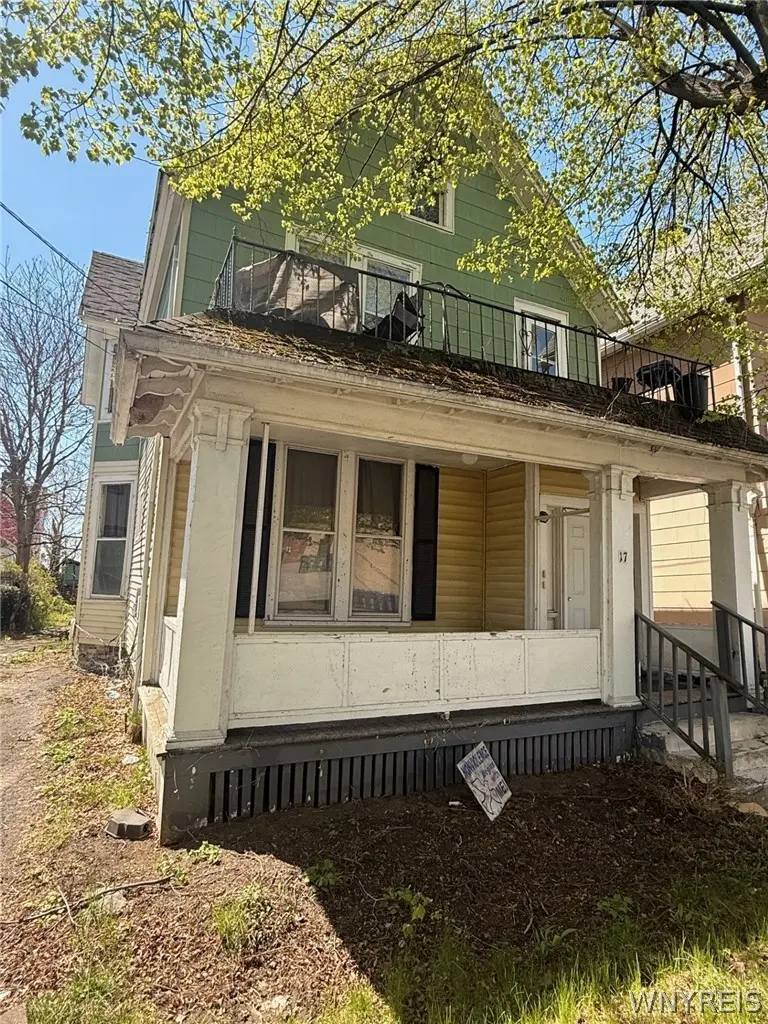
17 E Oakwood Pl Unit S · Buffalo, NY
Flood risk 1/10 · Minimal
- FEMA flood zone
- X (unshaded)
- Chance of flooding over 30 yrs
- 0.0%
- Est. flood insurance / yr
- $473 – $860
Fire risk 1/10 · Minimal
- Est. fire insurance / yr
- $691 – $1,283
Heat risk 3/10 · Minor
- Hot days now (above 93°F)
- 7 days/yr
- Hot days in 30 yrs
- 15 days/yr
Wind risk 1/10 · Minimal
- Chance of severe wind over 30 yrs
- —
Air-quality risk 3/10 · Minor
- Unhealthy air days now
- 2 days/yr
- Unhealthy air days in 30 yrs
- 3 days/yr
Risk factors via First Street. Map © Google.
Why this score? — see what drove the B grade
The composite is a weighted blend of 9 inputs, each scored 0–100. Each bar is that input's sub-score; the figure is the points it added to the 100-point composite (weight × sub-score).
- Cash flow +30.0/30.0
- 1% rule +10.0/10.0
- DSCR +10.0/10.0
- ARV discount +7.5/15.0
- Rent growth +4.0/5.0
- Livability +3.9/5.0
- Schools +3.3/10.0
- Condition / age +2.5/5.0
- Appreciation +0.0/10.0
$79,900
🖨 Deal sheet 📄 Offer letter ✓ Due diligence
Multi-family units
County records classify this as Multi-Family (2-4 Unit). Listing-text estimate: 1 unit. estimate disagrees with records
Listing remarks
Opportunity knocks for a savvy investor who is willing to invest in this 2/2 double and help bring it back to life. Located in a desirable area close to Sister's hospital, Main Street, short drive to UB and with easy access to downtown and all that Buffalo has to offer. The investment will be worth the effort as area sales show values over $220,000 and with new development happening on and near Main Street. Please note this a cash sale only due to the condition of the home. The home will need extensive rehab but worth the investment, buyer will pay for search survey and transfer tax some contents will remain seller has no means to do any repairs, there are two electric meters shared water a
Key facts
- Short drive to ub
- Desirable area
- 3,905 sq ft lot
Tags
Property features AI
Finance
- Other: Two total units in the building; Two electric meters and one shared gas meter; Property described as resale/fixer
- Financial info: Owner pays heat, water, trash collection, snow removal, and other items (see remarks); Rent may include heat, water, trash collection, and snow removal; Operating expenses include trash and water/sewer
Exterior
- Parking: Paved on-street parking available; Off-site parking
- Utilities: Public water connected; Sewer connected; Circuit breaker electrical service
- Home design: Two-story building; Residential 2-unit zoning; Existing structure
- Construction: Vinyl and wood siding; Asphalt roof; Stone foundation; Built previously (existing)
- Exterior features: Partial fencing; Fence; Near public transit; Rectangular residential lot; City street frontage
Interior
- Kitchen: Eat-in kitchen (per unit); Formal dining room (per unit)
- Bedrooms: Units include 2-bedroom layouts
- Flooring: Hardwood; Laminate; Varies
- Bathrooms: Two full bathrooms in the building; individual units include one full bathroom
- Heating & cooling: Forced air heating; Heating present (see remarks)
- Interior features: Hardwood and laminate flooring; flooring varies by area; Full basement; Other/see remarks
- Laundry & utility: Gas water heater
Neighborhood map
What this means for you Summary
Snapshot
- This is a 4-bed/2.0-bath multifamily listed at $80k.
Deal economics
- At list price, monthly cash flow is $2k ($25k/yr) — positive.
- The deal already cash-flows at list — no discount required.
- Meets the 1% rule at list price ($3k rent vs $80k).
- Recommended offer: $78k (3.0% below list) — sets the bar for market timing.
- Cap rate 37.5% vs local median 8.0% in Buffalo — top-decile yield for the area; either an underpriced asset or a hidden risk that comps aren't pricing in. Stress-test before assuming the spread holds.
Location & tenants
- Location reads 77/100 on livability (#195 in NY, #3,011 nationally) — a middle-class / working-renter tenant base. Strengths: commute A+, housing A+, health & safety A+; Watch: crime F, employment D-.
- Buffalo City School District (urban): math 41% / reading 40% proficiency, ranked #535 of 590 in NY (top 91%) — families likely to look elsewhere, expect single-tenant / working-renter base with shorter leases; 75% free/reduced lunch — lower-income household profile, screen leases tightly.
- Market conditions: Rents rising fast (+5.8%/yr); 90 active listings in the ZIP; 15 comparable units currently listed for rent nearby; rentals at typical pace (median 24d on market — plan ~3-4 weeks tenant-placement turnaround); 1,244 units permitted in Erie County in 2024 (563 in 5+ unit buildings).
- At $3,264/mo this rent would consume 67% of the median local household income ($58k/yr) (locally 1820% of renters already pay >50% of income on rent) — very limited rent-growth headroom before tenants either downsize or default.
Forward outlook
- Local home prices are declining (-3.0%/yr); year-one equity from $552 of loan paydown is wiped out by about $2k of value loss. Plan a longer hold.
- At projected returns (-3.0% appreciation + 5.8% rent growth), your $22k cash investment doubles in ~1 year — after that, you're playing with house money.
Negotiation context
- It's been on market 42 days — a 3% lower offer ($78k) is reasonable based on typical stale-listing flexibility.
- Current owner paid $18k; list at $80k implies a 344% gain — meaningful room to come down on a strong offer.
Risks & watch-outs
- Watch-outs: built in 1920 — expect roof / HVAC / electrical / plumbing capex.
Questions for the listing agent
- It's been on market 42 days. Have you received any prior offers? Is the seller open to a 3% concession, seller financing, or rate buy-down credit?
- Built in 1920 — when were the roof, HVAC, electrical panel, plumbing, and water heater last replaced?
- Is there a deadline driving the sale (1031 exchange, divorce, estate, relocation)? That informs how much negotiation room exists.
- Crime grade is F in this area — have there been break-ins, vandalism, or insurance claims at this property in the last 3 years? What carrier currently insures it and at what premium?
- What's the average days-on-market for RENTAL listings here right now (not sales)? A rising rental-DOM trend means longer vacancies and softer asking-rent achievability than the comps imply.
- What's the recent tenant-quality profile in this submarket — average credit score on applications, eviction rate, late-payment / NSF rate, and stable-employment percentage? A property-management company in the area should have these aggregated.
- How much new apartment / multifamily construction is in the pipeline within 1–3 miles? Heavy new supply (>2% of stock underway) typically softens rents 12–24 months out; light construction supports rent growth.
Investment metrics
- 1% rule
- 4.09% ✓
- Cap rate
- 37.49%
- Cash-on-cash
- 111.42%
- DSCR
- 5.96
- GRM
- 2.0
CMA / ARV
- ARV (median comp)
- $688,768
- List price
- $79,900
- Delta
- -88.40%
- Verdict
- UNDERPRICED
- Comps
- 20 within 1.0 mi
Show comp detail 9 sales within ~0.75 mi
| Address | Dist | Beds/Ba | Sqft | Sold | Price | $/sf | Match |
|---|---|---|---|---|---|---|---|
| 2006 Fillmore Ave | 0.40mi | 5/2.0 (+1) | 2,390 (+0%) | 3mo | $84,800 | $35 | 73 |
| 213 Jewett Ave | 0.49mi | 4/2.0 | 2,154 (-9%) | 3mo | $116,000 | $54 | 59 |
| 2166 Main St | 0.30mi | 4/2.0 | 2,670 (+12%) | 15mo | $285,000 | $107 | 53 |
| 41 Vernon Pl Pl | 0.57mi | 5/2.0 (+1) | 2,330 (-2%) | 21mo | $344,000 | $148 | 48 |
| 1683 Amherst St | 0.58mi | 4/3.0 | 2,432 (+2%) | 23mo | $397,000 | $163 | 46 |
| 17 Oakgrove Ave | 0.66mi | 5/2.0 (+1) | 2,374 (-0%) | 23mo | $190,000 | $80 | 45 |
| 320 Jewett Ave | 0.69mi | 4/2.0 | 2,192 (-8%) | 13mo | $210,000 | $96 | 44 |
| 19 Orchard Pl | 0.51mi | 4/3.0 | 2,174 (-8%) | 17mo | $260,100 | $120 | 44 |
| 329 Jewett Ave | 0.70mi | 4/4.0 | 2,053 (-14%) | 8mo | $165,000 | $80 | 30 |
Match score weights: distance 35% · size 25% · config 20% · recency 20%. Top-matched comps best support the ARV.
Projected returns pro-forma
-3.0% appreciation · 5.81% rent growth · sell at horizon
- IRR
- —
- Equity multiple
- 6.76×
- Total profit
- $128,861
- Equity at exit
- $11,913
- IRR
- —
- Equity multiple
- 15.48×
- Total profit
- $323,888
- Equity at exit
- $6,908
Cash invested: $22,372 (down + closing). Projections, not guarantees.
Landlord ↔ Tenant lean methodology
- Overall (STATE)
- 15 Strongly Tenant-Friendly
- State New York
- 15 Strongly Tenant-Friendly · D+10
- County
- — inherits STATE
- City
- — inherits STATE
ZIP-level market 14214
- Rents YoY
- 5.8%
- Active inventory
- 90
- Price-to-rent
- 4.1×
Monthly cashflow live
- Estimated rent
- $3,264 high interval (Pro) →
- Mortgage (P&I)
- −$419
- Tax from tax record
- −$49 /mo · $588/yr
- Insurance
- −$33
- HOA
- −$0
- Vacancy / Maint / Mgmt
- −$685
- Net cashflow
- $2,077
Break-even live
2-unit breakdown (identical units grouped — click to expand)
| Units | Beds | Baths | Est. rent |
|---|---|---|---|
| 2× units | 2 | 2 | $3,264 |
| #1 | 2 | 2 | $1,632 |
| #2 | 2 | 2 | $1,632 |
| Total (2 units) | $3,264 | ||
UW: 25.0% down · 7.5% · 30yr · 1.5% tax · 5.0% vac · 8.0% maint · 8.0% mgmt
Financing live
Cash to close
- Down payment
- $19,975
- Closing costs
- $2,397
- Reserves months
- —
- Total cash needed
- —
Loan-product check · same deal, 3 products live
Conventional
25% down · 7.5% · 30yr
- Down + closing
- —
- Monthly P&I
- —
- Monthly cashflow
- —
- DSCR
- —
- Eligible?
- —
Personal DTI + credit; lowest rate.
DSCR
20% down · 8.5% · 30yr
- Down + closing
- —
- Monthly P&I
- —
- Monthly cashflow
- —
- DSCR
- —
- Eligible?
- —
No personal income docs; deal must DSCR.
Hard money
10% down · 12.0% · 12mo
- Down + closing
- —
- Monthly P&I
- —
- Monthly cashflow
- —
- DSCR
- —
- Eligible?
- —
Short-term bridge; refi at stabilization.
Rent comps 15 comps
| Address | Beds | Baths | Sqft | Rent | $/sqft | DOM | Units | Dist |
|---|---|---|---|---|---|---|---|---|
| 91 W Humboldt Pkwy Buffalo, NY | 4.0 | 2.0 | 3017 | $3,400 | $1.13 | 43d | 1 | 0.45mi |
| 202 Summit Ave Unit 1 Buffalo, NY | 3.0 | 1.0 | 2000 | $2,400 | $1.20 | 23d | 1 | 0.48mi |
| 98 E Delavan Ave Buffalo, NY | 4.0 | 2.0 | 3105 | $2,000 | $0.64 | 43d | 1 | 0.77mi |
| 563 Humboldt Pkwy Buffalo, NY | 3.0 | 1.0 | 2004 | $1,200 | $0.60 | 23d | 1 | 0.86mi |
| 30 Wellington Rd Buffalo, NY | 3.0 | 1.0 | 3150 | $1,850 | $0.59 | 11d | 1 | 0.96mi |
| 146 Wallace Ave Buffalo, NY | 3.0 | 1.0 | 2706 | $1,700 | $0.63 | 43d | 1 | 1.05mi |
| 82 Butler Ave Unit 2 Buffalo, NY | 3.0 | 1.0 | 2752 | $1,300 | $0.47 | 43d | 1 | 1.09mi |
| 28 Lonsdale Rd Buffalo, NY | 3.0 | 1.0 | 2735 | $1,725 | $0.63 | 43d | 1 | 1.18mi |
| 73 Inter Park Ave Buffalo, NY | 3.0 | 1.0 | 2080 | $1,300 | $0.62 | 14d | 1 | 1.19mi |
| 7 Berkley Pl Buffalo, NY | 3.0 | 1.0 | 2879 | $1,250 | $0.43 | 3d | 1 | 1.22mi |
| 25 Parkridge Ave Buffalo, NY | 3.0 | 1.0 | 1914 | $1,350 | $0.71 | 14d | 1 | 1.27mi |
| 89 Lasalle Ave Buffalo, NY | 1.0–4.0 | 1.0–4.0 | 1024 | $2,997 | $2.93 | 1d | 10 | 1.31mi |
| 88 Commonwealth Ave Buffalo, NY | 3.0 | 1.0 | 2710 | $1,695 | $0.63 | 11d | 1 | 1.33mi |
| 359 Colvin Ave Buffalo, NY | 3.0 | 1.0 | 2010 | $2,100 | $1.04 | 23d | 1 | 1.44mi |
| 59 Lisbon Ave Buffalo, NY | 3.0 | 1.0 | 2521 | $1,250 | $0.50 | 23d | 1 | 1.49mi |
Listing history 13 events
-
2026-06-15days on market $79,900 Active 42 DOM
-
2026-06-13days on market $79,900 Active 40 DOM
-
2026-06-13days on market $79,900 Active 39 DOM
-
2026-06-10days on market $79,900 Active 37 DOM
-
2026-06-09days on market $79,900 Active 36 DOM
-
2026-06-08days on market $79,900 Active 35 DOM
-
2026-06-07days on market $79,900 Active 34 DOM
-
2026-06-03days on market $79,900 Active 30 DOM
-
2026-06-02days on market $79,900 Active 29 DOM
-
2026-06-01days on market $79,900 Active 28 DOM
-
2026-05-31days on market $79,900 Active 27 DOM
-
2026-05-04$79,900 Active 819-char remark
-
1995-10-04soldstatus $18,000
ⓘ Source: listings_history table (triggers on properties + properties_extension) + one-shot
backfill from property_details.listing_events for pre-trigger history.
Tax reassessment forecast NY · Partial reset (capped growth)
- Current annual tax
- $588 · $49/mo
- Projected year-2 tax
- $969 · $81/mo
- Expected delta
- +$381/yr (+$32/mo · 64.9%)
ⓘ Screening estimate from a state-policy table — verify with the county assessor before closing.
Climate risk First Street
- Flood 1/10 Low FEMA zone X (unshaded) · 0% chance over 30 yrs
- Wildfire 1/10 Low
- Heat 3/10 Moderate 7 d/yr ≥93°F today · 15 d/yr by 30 yrs out
- Wind 1/10 Low
- Air quality 3/10 Moderate 2 unhealthy d/yr today · 3 by 30 yrs out
Nearby sold comps map
Loading sold comps map…
Walkable amenities ~0.75 mi
Loading nearby amenities…
Taxation est. · year 1
- Rental income
- $39,168
- − Mortgage interest
- −$4,476
- − Property taxes
- −$588
- − Insurance
- −$400
- − Repairs & maintenance
- −$3,133
- − Management
- −$3,133
- − Depreciation
- −$2,324
- Taxable income
- $25,114
- Est. tax owed @ 24.0%
- −$6,027
- After-tax cash flow
- $18,900/yr
For passive investors: Depreciation is non-cash, so a rental often shows a tax loss while cash-flowing — sheltering income. Rental losses are passive: they offset passive income freely, and up to $25,000/yr can offset ordinary (W-2) income if you actively participate and your MAGI is under $100k (phasing out to $0 by $150k); unused losses carry forward. On sale, claimed depreciation is recaptured at up to 25%, and gains may owe capital-gains tax (a 1031 exchange can defer both). Figures are a year-1 estimate at your 24.0% rate — not tax advice; consult a CPA.
Schools (NCES district)
- District
- Buffalo City School District
- NCES district ID
- 3605850
- Math proficiency
- 41% ▲ 11.00%
- Reading proficiency
- 40% ▲ 7.00%
- Median HH income
- $31,665
- Composite
- 33.17/100
- National rank
- #5544
- State rank
- #535 of 590 in NY
Livability — Buffalo
- Score
- 77/100
- State rank
- #195
- US rank
- #3011
Category grades
Schools grade is shown separately in the Schools card above.
Census & demographics
- Census place
- Buffalo, NY
- County
- Erie County · 714,559 people
- City population
- 440,021
- Metro
- Buffalo-Cheektowaga, NY
- Population (ZIP)
- 21,314
- Household income
- $58,228
- Rent vs Own
- Severe rent burden
- 1820.0
Population outlook (Erie County) Hauer SSP2
- Today (2025)
- 933,037 people
- By 2030
- 935,181 · +0.2%
- By 2040
- 928,531 · -0.5%
- By 2050
- 905,725 · -2.9%
- By 2075
- 834,037 · -10.6%
- By 2100
- 708,033 · -24.1%
Race, ethnicity, and origin ACS 2023
- Neighborhood character
- Diverse neighborhood (Simpson 0.67)
- Race & ethnicity
- White 47% Black 31% Asian 11% Hispanic / Latino 7% Two or more races 6%
- Hispanic origin (detail)
- Puerto Rican 3%
- Common ancestry
- Romanian 5% Lithuanian 2% Scotch-Irish 1%
- Foreign-born
- 14% · Canada, China
- Languages at home
- 81% English-only · Other Indo-European 7% Spanish 4% Other Asian/Pacific 1%
Political lean MEDSL · Erie
- 2024 margin
- Lean D (+9.7) · D 54.8% · R 45.2%
- 2008→2024 swing
- -7.9pp toward R · 2008: 17.5pp · 2024: 9.7pp
- All cycles
- 2024: D+9.7 2020: D+14.7 2016: D+4.8 2012: D+15.6 2008: D+17.5
Not yet ingested
- Civics
- —
Market trends
- HPI YoY
- ▼ -282.52%
- Current HPI
- 373.377
- Rent YoY
- ▲ 5.81%
- Metro
- Buffalo-Cheektowaga, NY
- State GDP YoY
- ▲ 2.60%
- F500 in state
- 92
Industry mix (Fortune 500 HQ in NY)
| Industry | F500 HQs | Revenue |
|---|---|---|
| Financial Services | 10 | $950B |
|
||
| Consumer Goods | 9 | $162B |
|
||
| Insurance | 4 | $225B |
|
||
| Telecommunications | 2 | $144B |
|
||
| Pharmaceuticals | 2 | $112B |
|
||
| Media / Entertainment | 2 | $69B |
|
||
Price history
+343.9% since first listed2 events — show timeline
- 2026-05-04 Listed $79,900 WNYREIS
- 1995-10-04 Sold (Public Records) $18,000 Public Records
Property tax history
+17.8%/yrLatest (2025): $588 · +168.9% YoY. Source: county tax records.
Cash-flow waterfall
monthlySold comps — $/sqft
last 12 mo · ≤1 miLoading sold comps…