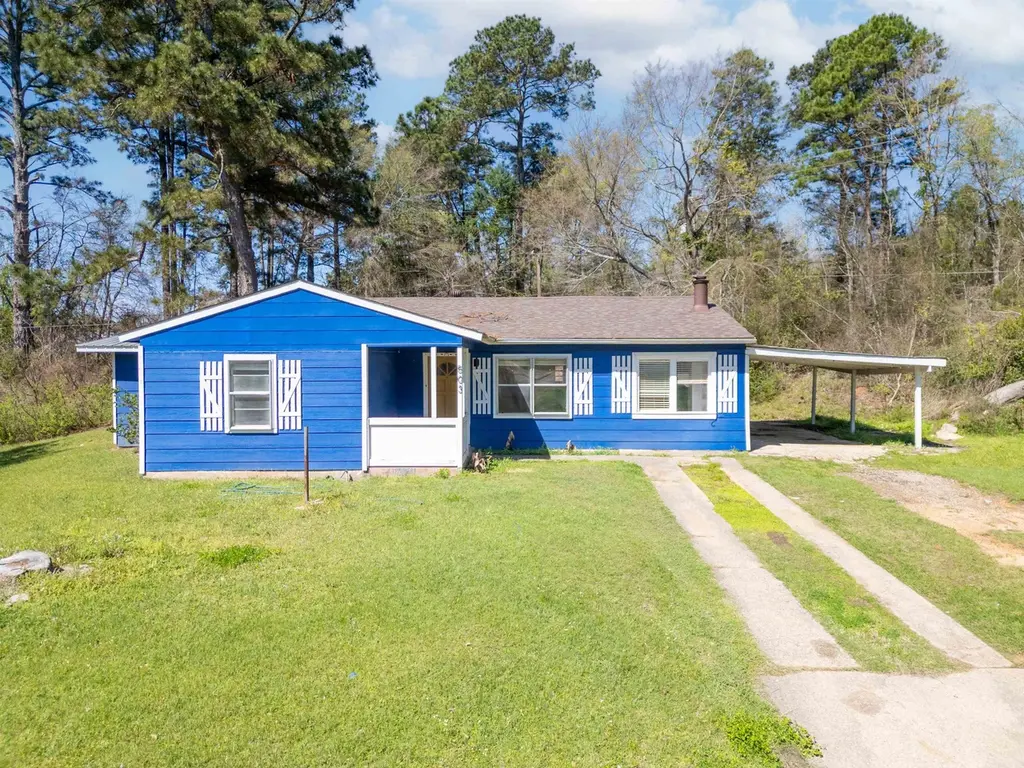
503 Bowie St · Lone Star, TX
Flood risk 9/10 · Severe
- FEMA flood zone
- X
- Chance of flooding over 30 yrs
- 0.99%
- Est. flood insurance / yr
- $507 – $1,088
Fire risk 4/10 · Minor
- Est. fire insurance / yr
- $1,222 – $2,270
Heat risk 7/10 · Major
- Hot days now (above 112°F)
- 7 days/yr
- Hot days in 30 yrs
- 24 days/yr
Wind risk 6/10 · Moderate
- Chance of severe wind over 30 yrs
- 27.0%
Air-quality risk 2/10 · Minimal
- Unhealthy air days now
- 0 days/yr
- Unhealthy air days in 30 yrs
- 1 days/yr
Risk factors via First Street. Map © Google.
Why this score? — see what drove the D- grade
The composite is a weighted blend of 9 inputs, each scored 0–100. Each bar is that input's sub-score; the figure is the points it added to the 100-point composite (weight × sub-score).
- ARV discount +15.0/15.0
- Cash flow +7.8/30.0
- Appreciation +3.2/10.0
- Livability +3.2/5.0
- Rent growth +2.5/5.0
- Condition / age +2.5/5.0
- Schools +2.3/10.0
- DSCR +1.9/10.0
- 1% rule +1.4/10.0
$122,000
🖨 Deal sheet 📄 Offer letter ✓ Due diligence
Listing remarks MLS
This home is on a corner lot next to green space and at the front of the neighborhood. There is ample space with open living room, dining room and there is flex room that can be used as a home office or 4th bedroom. 3 bedrooms 3 full bathrooms 2 bedrooms, with 2 ensuite bathrooms! 1 full bathroom centrally located for guests. Interior Laundry room Carport, Covered front porch and space for grilling in the backyard Great property with incredible potential for YOU!
Key facts
- Green space
- Open living room
- Dining room
Tags
Neighborhood map
What this means for you Summary
Snapshot
- This is a 3-bed/1.0-bath single-family listed at $122k.
Deal economics
- At list price, monthly cash flow is $-204 ($-2k/yr) — negative.
- To cash-flow at today's rent, offer at most $86k (29.5% below list).
- To meet the 1% rule (rent ≥ 1% of price), the offer needs to be $78k (35.7% below list).
- Recommended offer: $78k (35.7% below list) — sets the bar for 1% rule.
Location & tenants
- Location reads 64/100 on livability (#786 in TX) — a middle-class / working-renter tenant base. Strengths: cost of living A+, housing A+, health & safety A+; Watch: employment C-, schools F, amenities F.
- Daingerfield-Lone Star ISD (town): math 24% / reading 32% proficiency, ranked #679 of 826 in TX (top 82%) — low school quality limits family demand, transient renter base, plan for 1-2y turnover; 71% free/reduced lunch — lower-income household profile, screen leases tightly.
- Market conditions: 30 active listings in the ZIP; 1 comparable units currently listed for rent nearby; 3 units permitted in Morris County in 2024 (0 in 5+ unit buildings).
Forward outlook
- Local home prices are declining (-3.0%/yr); year-one equity from $843 of loan paydown is wiped out by about $4k of value loss. Plan a longer hold.
- Morris County population projected at -19% by 2050 — secular population decline; favor cash flow + early exit over multi-decade hold.
Negotiation context
- It's been on market 93 days — a 9% lower offer ($111k) is reasonable based on typical stale-listing flexibility.
- Current owner paid $18k; list at $122k implies a 559% gain — meaningful room to come down on a strong offer.
Risks & watch-outs
- Watch-outs: flood insurance adds $66/mo; built in 1955 — expect roof / HVAC / electrical / plumbing capex.
- Climate carrying-cost: severe flood risk; major wind risk, 27% chance of damaging wind over 30y; extreme-heat days projected 7→24/yr by 2055 (HVAC capex compounding) — expect insurance premiums to compound above CPI over the hold.
Questions for the listing agent
- What do current leases actually rent for vs. the listed asking? Can we see a recent rent roll and the last 12 months of T-12 income?
- It's been on market 93 days. Have you received any prior offers? Is the seller open to a 36% concession, seller financing, or rate buy-down credit?
- Built in 1955 — when were the roof, HVAC, electrical panel, plumbing, and water heater last replaced?
- What's the actual annual flood-insurance premium (NFIP or private), and is the property in a SFHA with mandatory coverage?
- Why hasn't it sold? Are there any deal-killer items the seller is aware of (foundation, flood, title, zoning, code violations)?
- Is there a deadline driving the sale (1031 exchange, divorce, estate, relocation)? That informs how much negotiation room exists.
- Schools are F-rated, which usually means shorter tenancies and higher turnover. Who's the typical renter profile here, and what's been the actual vacancy rate?
- The area grade is low — what's the realistic commute time and amenity access for the typical tenant pool here? Any planned neighborhood developments (good or bad) we should know about?
- What's the average days-on-market for RENTAL listings here right now (not sales)? A rising rental-DOM trend means longer vacancies and softer asking-rent achievability than the comps imply.
- What's the recent tenant-quality profile in this submarket — average credit score on applications, eviction rate, late-payment / NSF rate, and stable-employment percentage? A property-management company in the area should have these aggregated.
- How much new for-sale + rental construction is in the pipeline within 1–3 miles? Heavy new supply typically softens prices + rents 12–24 months out; constrained supply supports both.
Investment metrics
- 1% rule
- 0.64% ✗
- Cap rate
- 4.94%
- Cash-on-cash
- -4.82%
- DSCR
- 0.79
- GRM
- 13.0
CMA / ARV
- ARV (median comp)
- $168,897
- List price
- $122,000
- Delta
- -27.77%
- Verdict
- UNDERPRICED
- Comps
- 7 within 1.0 mi
Show comp detail 2 sales within ~0.75 mi
| Address | Dist | Beds/Ba | Sqft | Sold | Price | $/sf | Match |
|---|---|---|---|---|---|---|---|
| 316 Houston St | 0.29mi | 2/1.0 (-1) | 840 (+11%) | 1mo | $21,000 | $25 | 61 |
| 651 Sunnybrook St | 0.27mi | 4/1.0 (+1) | 860 (+14%) | 7mo | $35,000 | $41 | 53 |
Match score weights: distance 35% · size 25% · config 20% · recency 20%. Top-matched comps best support the ARV.
Projected returns pro-forma
-3.0% appreciation · 3.0% rent growth · sell at horizon
- IRR
- -28.7%
- Equity multiple
- 0.04×
- Total profit
- $-32,743
- Equity at exit
- $18,191
- IRR
- -28.5%
- Equity multiple
- -0.32×
- Total profit
- $-45,220
- Equity at exit
- $10,548
Cash invested: $34,160 (down + closing). Projections, not guarantees.
Landlord ↔ Tenant lean methodology
- Overall (STATE)
- 87 Strongly Landlord-Friendly
- State Texas
- 87 Strongly Landlord-Friendly · R+5
- County
- — inherits STATE
- City
- — inherits STATE
ZIP-level market 75668
- Home prices YoY
- -4.5%
- Active inventory
- 30
- Price-to-rent
- 13.0×
Monthly cashflow live
- Estimated rent
- $784 medium interval (Pro) →
- Mortgage (P&I)
- −$640
- Tax from tax record
- −$66 /mo · $792/yr
- Insurance
- −$51
- Flood insurance flood zone
- −$66 /mo · $798/yr
- HOA
- −$0
- Vacancy / Maint / Mgmt
- −$165
- Net cashflow
- $-204
Break-even live
UW: 25.0% down · 7.5% · 30yr · 1.5% tax · 5.0% vac · 8.0% maint · 8.0% mgmt
Financing live
Cash to close
- Down payment
- $30,500
- Closing costs
- $3,660
- Reserves months
- —
- Total cash needed
- —
Loan-product check · same deal, 3 products live
Conventional
25% down · 7.5% · 30yr
- Down + closing
- —
- Monthly P&I
- —
- Monthly cashflow
- —
- DSCR
- —
- Eligible?
- —
Personal DTI + credit; lowest rate.
DSCR
20% down · 8.5% · 30yr
- Down + closing
- —
- Monthly P&I
- —
- Monthly cashflow
- —
- DSCR
- —
- Eligible?
- —
No personal income docs; deal must DSCR.
Hard money
10% down · 12.0% · 12mo
- Down + closing
- —
- Monthly P&I
- —
- Monthly cashflow
- —
- DSCR
- —
- Eligible?
- —
Short-term bridge; refi at stabilization.
Rent comps 1 comps
| Address | Beds | Baths | Sqft | Rent | $/sqft | DOM | Units | Dist |
|---|---|---|---|---|---|---|---|---|
| 1001 Lakeview Dr Lone Star, TX | 2.0 | 1.0 | 850 | $784 | $0.92 | 43d | 1 | 0.87mi |
Listing history 22 events
-
2026-06-19days on market $122,000 Active 93 DOM
-
2026-06-18days on market $122,000 Active 92 DOM
-
2026-06-17days on market $122,000 Active 91 DOM
-
2026-06-16days on market $122,000 Active 90 DOM
-
2026-06-15days on market $122,000 Active 89 DOM
-
2026-06-14days on market $122,000 Active 87 DOM
-
2026-06-12days on market $122,000 Active 86 DOM
-
2026-06-09days on market $122,000 Active 83 DOM
-
2026-06-08days on market $122,000 Active 82 DOM
-
2026-06-07days on market $122,000 Active 81 DOM
-
2026-06-07days on market $122,000 Active 80 DOM
-
2026-06-02days on market $122,000 Active 76 DOM
-
2026-06-01days on market $122,000 Active 75 DOM
-
2026-05-31days on market $122,000 Active 74 DOM
-
2026-05-30days on market $122,000 Active 73 DOM
-
2026-05-03price $122,000 467-char remark
Show marketing remark (467 chars)
This home is on a corner lot next to green space and at the front of the neighborhood. There is ample space with open living room, dining room and there is flex room that can be used as a home office or 4th bedroom. 3 bedrooms 3 full bathrooms 2 bedrooms, with 2 ensuite bathrooms! 1 full bathroom centrally located for guests. Interior Laundry room Carport, Covered front porch and space for grilling in the backyard Great property with incredible potential for YOU!
-
2026-03-18$130,000 Active 467-char remark
Show marketing remark (467 chars)
This home is on a corner lot next to green space and at the front of the neighborhood. There is ample space with open living room, dining room and there is flex room that can be used as a home office or 4th bedroom. 3 bedrooms 3 full bathrooms 2 bedrooms, with 2 ensuite bathrooms! 1 full bathroom centrally located for guests. Interior Laundry room Carport, Covered front porch and space for grilling in the backyard Great property with incredible potential for YOU!
-
2025-12-31soldstatus
-
2011-12-15soldstatus $18,500
-
2007-06-07soldstatus $18,500
-
1995-07-17soldstatus
-
1984-03-30soldstatus
ⓘ Source: listings_history table (triggers on properties + properties_extension) + one-shot
backfill from property_details.listing_events for pre-trigger history.
Tax reassessment forecast TX · Resets to sale price
- Current annual tax
- $792 · $66/mo
- Projected year-2 tax
- $2,233 · $186/mo
- Expected delta
- +$1,441/yr (+$120/mo · 182.0%)
ⓘ Screening estimate from a state-policy table — verify with the county assessor before closing.
Climate risk First Street
- Flood 9/10 Extreme FEMA zone X · 99% chance over 30 yrs
- Wildfire 4/10 Moderate
- Heat 7/10 Severe 7 d/yr ≥112°F today · 24 d/yr by 30 yrs out
- Wind 6/10 Major 27% chance of damaging wind over 30 yrs
- Air quality 2/10 Low 0 unhealthy d/yr today · 1 by 30 yrs out
Nearby sold comps map
Loading sold comps map…
Walkable amenities ~0.75 mi
Loading nearby amenities…
Taxation est. · year 1
- Rental income
- $9,408
- − Mortgage interest
- −$6,834
- − Property taxes
- −$792
- − Insurance
- −$1,408
- − Repairs & maintenance
- −$753
- − Management
- −$753
- − Depreciation
- −$3,549
- Taxable loss
- −$4,680
- Est. tax savings @ 24.0%
- +$1,123
- After-tax cash flow
- $-1,321/yr
For passive investors: Depreciation is non-cash, so a rental often shows a tax loss while cash-flowing — sheltering income. Rental losses are passive: they offset passive income freely, and up to $25,000/yr can offset ordinary (W-2) income if you actively participate and your MAGI is under $100k (phasing out to $0 by $150k); unused losses carry forward. On sale, claimed depreciation is recaptured at up to 25%, and gains may owe capital-gains tax (a 1031 exchange can defer both). Figures are a year-1 estimate at your 24.0% rate — not tax advice; consult a CPA.
Schools (NCES district)
- District
- Daingerfield-Lone Star ISD
- NCES district ID
- 4816180
- Math proficiency
- 24% ▼ -11.00%
- Reading proficiency
- 32% ▼ -4.00%
- Median HH income
- $39,097
- Composite
- 23.48/100
- National rank
- #7877
- State rank
- #679 of 826 in TX
Livability — Lone Star
- Score
- 64/100
- State rank
- #786
- US rank
- #14389
Category grades
Schools grade is shown separately in the Schools card above.
Census & demographics
- Census place
- Lone Star, TX
- Population (ZIP)
- 2,409
Population outlook (Morris County) Hauer SSP2
- Today (2025)
- 11,628 people
- By 2030
- 11,126 · -4.3%
- By 2040
- 10,181 · -12.4%
- By 2050
- 9,408 · -19.1%
- By 2075
- 8,268 · -28.9%
- By 2100
- 7,463 · -35.8%
Race, ethnicity, and origin ACS 2023
- Neighborhood character
- Diverse neighborhood (Simpson 0.57)
- Race & ethnicity
- White 60% Black 24% Hispanic / Latino 11% Two or more races 6%
- Hispanic origin (detail)
- Mexican 10%
- Common ancestry
- Lithuanian 2% Slovak 2% Iranian 1%
- Foreign-born
- 3% · Canada
- Languages at home
- 92% English-only · Spanish 8%
Political lean MEDSL · Morris
- 2024 margin
- Solid R (+51.2) · D 24.1% · R 75.3%
- 2008→2024 swing
- -30.2pp toward R · 2008: -21.0pp · 2024: -51.2pp
- All cycles
- 2024: R+51.2 2020: R+39.4 2016: R+40.6 2012: R+26.7 2008: R+21.0
Not yet ingested
- Civics
- —
Market trends
- HPI YoY
- ▼ -3.64%
- Current HPI
- 77.1143
- Rent YoY
- —
- Metro
- —
- State GDP YoY
- ▲ 3.95%
- F500 in state
- 110
Industry mix (Fortune 500 HQ in TX)
| Industry | F500 HQs | Revenue |
|---|---|---|
| Energy | 16 | $1,198B |
|
||
| Technology | 5 | $198B |
|
||
| Engineering / Construction | 4 | $72B |
|
||
| Energy Services | 3 | $60B |
|
||
| Utilities | 3 | $41B |
|
||
| Healthcare | 2 | $330B |
|
||
Price history
+559.5% since first listed7 events — show timeline
- 2026-05-03 Price Changed $122,000 LAAR
- 2026-03-18 Listed $130,000 LAAR
- 2025-12-31 Sold (Public Records) — Public Records
- 2011-12-15 Sold (Public Records) $18,500 Public Records
- 2007-06-07 Sold (Public Records) $18,500 Public Records
- 1995-07-17 Sold (Public Records) — Public Records
- 1984-03-30 Sold (Public Records) — Public Records
Property tax history
+4.6%/yrLatest (2025): $792 · +4.8% YoY. Source: county tax records.
Cash-flow waterfall
monthlySold comps — $/sqft
last 12 mo · ≤1 miLoading sold comps…