131 N Main St · Foristell, MO
Flood risk 1/10 · Minimal
- FEMA flood zone
- X (unshaded)
- Chance of flooding over 30 yrs
- 0.0%
- Est. flood insurance / yr
- $473 – $860
Fire risk 3/10 · Minor
- Est. fire insurance / yr
- $1,054 – $1,958
Heat risk 4/10 · Minor
- Hot days now (above 106°F)
- 7 days/yr
- Hot days in 30 yrs
- 20 days/yr
Wind risk 2/10 · Minimal
- Chance of severe wind over 30 yrs
- 1.0%
Air-quality risk 1/10 · Minimal
- Unhealthy air days now
- 0 days/yr
- Unhealthy air days in 30 yrs
- 0 days/yr
Risk factors via First Street. Map © Google.
Why this score? — see what drove the D grade
The composite is a weighted blend of 9 inputs, each scored 0–100. Each bar is that input's sub-score; the figure is the points it added to the 100-point composite (weight × sub-score).
- ARV discount +15.0/15.0
- Cash flow +9.6/30.0
- Schools +4.3/10.0
- Livability +3.0/5.0
- DSCR +2.7/10.0
- Rent growth +2.5/5.0
- Condition / age +2.5/5.0
- 1% rule +2.2/10.0
- Appreciation +0.0/10.0
$339,900
🖨 Deal sheet 📄 Offer letter ✓ Due diligence
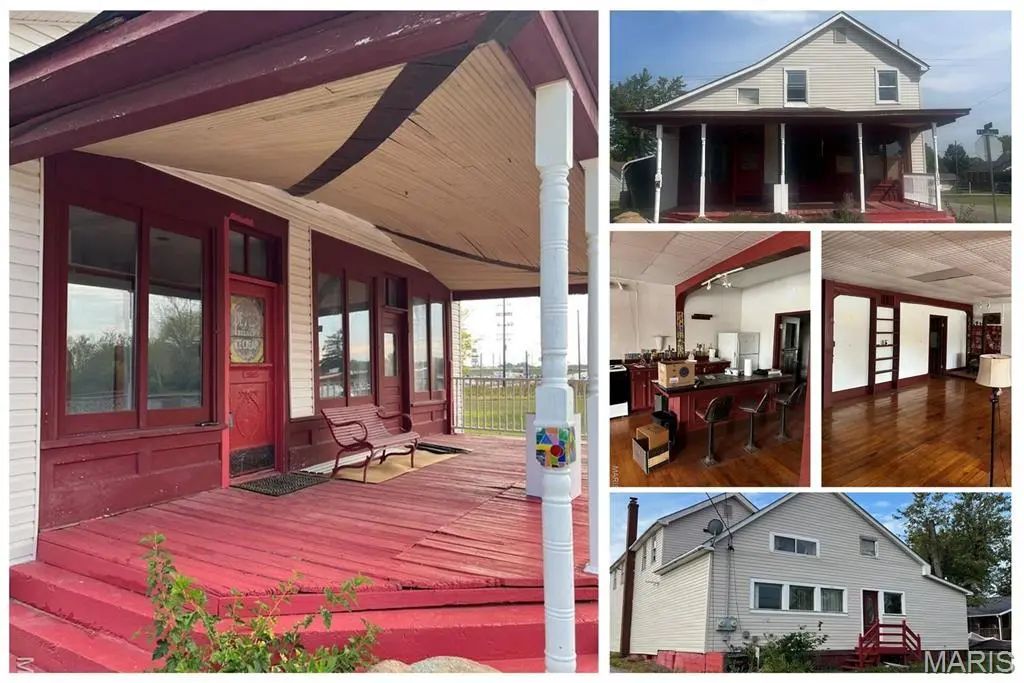
Listing remarks MLS
Great Investment Opportunity! The old general store in Foristell has that turn of the century charm with 45 x 32 show room with wood plank floors! Kitchen, full bathroom plus office space and or bedroom completes the main level! The upstairs residence offers 3 bedrooms, kitchen, dining room and full bathroom! Zoning is Special Old Town District, Commercial Mix-use! High visibility and heavy traffic area! Endless possibilities & great access! Duplicate listing. Please see MLS #25066839 listed under Commercial Sale/Mixed Use.
Key facts
- Upstairs residence
- Wood plank floors
- Office space
Tags
Neighborhood map
What this means for you Summary
Snapshot
- This is a 3-bed/2.0-bath single-family listed at $340k.
Deal economics
- At list price, monthly cash flow is $-227 ($-3k/yr) — negative.
- To cash-flow at today's rent, offer at most $300k (11.8% below list).
- To meet the 1% rule (rent ≥ 1% of price), the offer needs to be $243k (28.4% below list).
- Recommended offer: $243k (28.4% below list) — sets the bar for 1% rule.
- Cap rate 5.5% vs local median 3.8% in Foristell — top-decile yield for the area; either an underpriced asset or a hidden risk that comps aren't pricing in. Stress-test before assuming the spread holds.
Location & tenants
- Location reads 60/100 on livability (#484 in MO) — a middle-class / working-renter tenant base. Strengths: employment A+, housing A+; Watch: amenities F, commute F, cost of living D-.
- Wentzville R-IV (suburban): math 44% / reading 52% proficiency, ranked #32 of 324 in MO (top 10%) — families likely to look elsewhere, expect single-tenant / working-renter base with shorter leases; only 18% free/reduced lunch — higher-income household profile.
- Market conditions: 168 active listings in the ZIP; 2,021 units permitted in St. Charles County in 2024 (568 in 5+ unit buildings).
Forward outlook
- Local home prices are declining (-3.0%/yr); year-one equity from $2k of loan paydown is wiped out by about $10k of value loss. Plan a longer hold.
- St. Charles County population projected at +22% by 2050 — long-run rental-demand tailwind backs the buy-and-hold thesis.
Negotiation context
- It's been on market 100 days — a 9% lower offer ($309k) is reasonable based on typical stale-listing flexibility.
- Current owner paid $110k; list at $340k implies a 209% gain — meaningful room to come down on a strong offer.
Risks & watch-outs
- Watch-outs: built in 1920 — expect roof / HVAC / electrical / plumbing capex.
Questions for the listing agent
- What do current leases actually rent for vs. the listed asking? Can we see a recent rent roll and the last 12 months of T-12 income?
- It's been on market 100 days. Have you received any prior offers? Is the seller open to a 28% concession, seller financing, or rate buy-down credit?
- Built in 1920 — when were the roof, HVAC, electrical panel, plumbing, and water heater last replaced?
- Why hasn't it sold? Are there any deal-killer items the seller is aware of (foundation, flood, title, zoning, code violations)?
- Is there a deadline driving the sale (1031 exchange, divorce, estate, relocation)? That informs how much negotiation room exists.
- Schools are B-rated — typically a magnet for longer-tenancy family renters. What's the average tenant stay here, and is there a school-zone premium baked into asking?
- The area grade is low — what's the realistic commute time and amenity access for the typical tenant pool here? Any planned neighborhood developments (good or bad) we should know about?
- What's the average days-on-market for RENTAL listings here right now (not sales)? A rising rental-DOM trend means longer vacancies and softer asking-rent achievability than the comps imply.
- What's the recent tenant-quality profile in this submarket — average credit score on applications, eviction rate, late-payment / NSF rate, and stable-employment percentage? A property-management company in the area should have these aggregated.
- How much new for-sale + rental construction is in the pipeline within 1–3 miles? Heavy new supply typically softens prices + rents 12–24 months out; constrained supply supports both.
Investment metrics
- 1% rule
- 0.72% ✗
- Cap rate
- 5.49%
- Cash-on-cash
- -2.87%
- DSCR
- 0.87
- GRM
- 11.6
CMA / ARV
- ARV (median comp)
- $494,979
- List price
- $339,900
- Delta
- -31.33%
- Verdict
- UNDERPRICED
- Comps
- 20 within 1.0 mi
Show comp detail 4 sales within ~0.75 mi
| Address | Dist | Beds/Ba | Sqft | Sold | Price | $/sf | Match |
|---|---|---|---|---|---|---|---|
| 502 Hawthorne Ridge Ct | 0.72mi | 4/3.5 (+1) | 3,434 (+1%) | 14mo | $750,000 | $218 | 42 |
| 251 Liberty Valley Dr | 0.65mi | 3/2.5 | 2,926 (-14%) | 10mo | $459,000 | $157 | 37 |
| 261 Liberty Valley Dr | 0.59mi | 4/2.5 (+1) | 2,940 (-13%) | 16mo | $499,900 | $170 | 30 |
| 260 Liberty Valley Dr | 0.60mi | 4/2.5 (+1) | 2,997 (-12%) | 21mo | $439,000 | $146 | 28 |
Match score weights: distance 35% · size 25% · config 20% · recency 20%. Top-matched comps best support the ARV.
Projected returns pro-forma
-3.0% appreciation · 3.0% rent growth · sell at horizon
- IRR
- -21.1%
- Equity multiple
- 0.27×
- Total profit
- $-69,638
- Equity at exit
- $50,680
- IRR
- -14.7%
- Equity multiple
- 0.16×
- Total profit
- $-79,625
- Equity at exit
- $29,388
Cash invested: $95,172 (down + closing). Projections, not guarantees.
Landlord ↔ Tenant lean methodology
- Overall (STATE)
- 81 Strongly Landlord-Friendly
- State Missouri
- 81 Strongly Landlord-Friendly · R+10
- County
- — inherits STATE
- City
- — inherits STATE
ZIP-level market 63348
- Home prices YoY
- -30.5%
- Active inventory
- 168
- Price-to-rent
- 11.6×
Monthly cashflow live
- Estimated rent
- $2,434 medium interval (Pro) →
- Mortgage (P&I)
- −$1,782
- Tax from tax record
- −$226 /mo · $2,708/yr
- Insurance
- −$142
- HOA
- −$0
- Vacancy / Maint / Mgmt
- −$511
- Net cashflow
- $-227
Break-even live
UW: 25.0% down · 7.5% · 30yr · 1.5% tax · 5.0% vac · 8.0% maint · 8.0% mgmt
Financing live
Cash to close
- Down payment
- $84,975
- Closing costs
- $10,197
- Reserves months
- —
- Total cash needed
- —
Loan-product check · same deal, 3 products live
Conventional
25% down · 7.5% · 30yr
- Down + closing
- —
- Monthly P&I
- —
- Monthly cashflow
- —
- DSCR
- —
- Eligible?
- —
Personal DTI + credit; lowest rate.
DSCR
20% down · 8.5% · 30yr
- Down + closing
- —
- Monthly P&I
- —
- Monthly cashflow
- —
- DSCR
- —
- Eligible?
- —
No personal income docs; deal must DSCR.
Hard money
10% down · 12.0% · 12mo
- Down + closing
- —
- Monthly P&I
- —
- Monthly cashflow
- —
- DSCR
- —
- Eligible?
- —
Short-term bridge; refi at stabilization.
Listing history 22 events
-
2026-06-18days on market $339,900 Active 100 DOM
-
2026-06-17days on market $339,900 Active 99 DOM
-
2026-06-16days on market $339,900 Active 98 DOM
-
2026-06-15days on market $339,900 Active 97 DOM
-
2026-06-13days on market $339,900 Active 95 DOM
-
2026-06-13days on market $339,900 Active 94 DOM
-
2026-06-09days on market $339,900 Active 91 DOM
-
2026-06-08days on market $339,900 Active 90 DOM
-
2026-06-08days on market $339,900 Active 89 DOM
-
2026-06-05days on market $339,900 Active 86 DOM
-
2026-06-03days on market $339,900 Active 85 DOM
-
2026-06-02days on market $339,900 Active 84 DOM
-
2026-06-01days on market $339,900 Active 83 DOM
-
2026-05-31days on market $339,900 Active 82 DOM
-
2026-04-28price $339,900 533-char remark
Show marketing remark (533 chars)
Great Investment Opportunity! The old general store in Foristell has that turn of the century charm with 45 x 32 show room with wood plank floors! Kitchen, full bathroom plus office space and or bedroom completes the main level! The upstairs residence offers 3 bedrooms, kitchen, dining room and full bathroom! Zoning is Special Old Town District, Commercial Mix-use! High visibility and heavy traffic area! Endless possibilities & great access! Duplicate listing. Please see MLS #25066839 listed under Commercial Sale/Mixed Use.
-
2026-04-28price $33,990,000 533-char remark
Show marketing remark (533 chars)
Great Investment Opportunity! The old general store in Foristell has that turn of the century charm with 45 x 32 show room with wood plank floors! Kitchen, full bathroom plus office space and or bedroom completes the main level! The upstairs residence offers 3 bedrooms, kitchen, dining room and full bathroom! Zoning is Special Old Town District, Commercial Mix-use! High visibility and heavy traffic area! Endless possibilities & great access! Duplicate listing. Please see MLS #25066839 listed under Commercial Sale/Mixed Use.
-
2026-03-16price $349,900 533-char remark
Show marketing remark (533 chars)
Great Investment Opportunity! The old general store in Foristell has that turn of the century charm with 45 x 32 show room with wood plank floors! Kitchen, full bathroom plus office space and or bedroom completes the main level! The upstairs residence offers 3 bedrooms, kitchen, dining room and full bathroom! Zoning is Special Old Town District, Commercial Mix-use! High visibility and heavy traffic area! Endless possibilities & great access! Duplicate listing. Please see MLS #25066839 listed under Commercial Sale/Mixed Use.
-
2026-03-10$359,900 Active 533-char remark
Show marketing remark (533 chars)
Great Investment Opportunity! The old general store in Foristell has that turn of the century charm with 45 x 32 show room with wood plank floors! Kitchen, full bathroom plus office space and or bedroom completes the main level! The upstairs residence offers 3 bedrooms, kitchen, dining room and full bathroom! Zoning is Special Old Town District, Commercial Mix-use! High visibility and heavy traffic area! Endless possibilities & great access! Duplicate listing. Please see MLS #25066839 listed under Commercial Sale/Mixed Use.
-
2004-10-04soldstatus $110,000
-
1997-07-01soldstatus $34,000
-
1989-08-01soldstatus
-
1985-11-01soldstatus
ⓘ Source: listings_history table (triggers on properties + properties_extension) + one-shot
backfill from property_details.listing_events for pre-trigger history.
Tax reassessment forecast MO · Resets to sale price
- Current annual tax
- $2,708 · $226/mo
- Projected year-2 tax
- $3,297 · $275/mo
- Expected delta
- +$589/yr (+$49/mo · 21.7%)
ⓘ Screening estimate from a state-policy table — verify with the county assessor before closing.
Climate risk First Street
- Flood 1/10 Low FEMA zone X (unshaded) · 0% chance over 30 yrs
- Wildfire 3/10 Moderate
- Heat 4/10 Moderate 7 d/yr ≥106°F today · 20 d/yr by 30 yrs out
- Wind 2/10 Low 100% chance of damaging wind over 30 yrs
- Air quality 1/10 Low 0 unhealthy d/yr today · 0 by 30 yrs out
Nearby sold comps map
Loading sold comps map…
Walkable amenities ~0.75 mi
Loading nearby amenities…
Taxation est. · year 1
- Rental income
- $29,203
- − Mortgage interest
- −$19,040
- − Property taxes
- −$2,708
- − Insurance
- −$1,700
- − Repairs & maintenance
- −$2,336
- − Management
- −$2,336
- − Depreciation
- −$9,888
- Taxable loss
- −$8,805
- Est. tax savings @ 24.0%
- +$2,113
- After-tax cash flow
- $-614/yr
For passive investors: Depreciation is non-cash, so a rental often shows a tax loss while cash-flowing — sheltering income. Rental losses are passive: they offset passive income freely, and up to $25,000/yr can offset ordinary (W-2) income if you actively participate and your MAGI is under $100k (phasing out to $0 by $150k); unused losses carry forward. On sale, claimed depreciation is recaptured at up to 25%, and gains may owe capital-gains tax (a 1031 exchange can defer both). Figures are a year-1 estimate at your 24.0% rate — not tax advice; consult a CPA.
Schools (NCES district)
- District
- Wentzville R-IV
- NCES district ID
- 2931650
- Math proficiency
- 44% ▼ -9.00%
- Reading proficiency
- 52% ▼ -7.00%
- Median HH income
- $74,961
- Composite
- 43.49/100
- National rank
- #2994
- State rank
- #32 of 324 in MO
Livability — Foristell
- Score
- 60/100
- State rank
- #484
- US rank
- #18988
Category grades
Schools grade is shown separately in the Schools card above.
Census & demographics
- Census place
- Foristell, MO
- Population (ZIP)
- 10,207
Population outlook (St. Charles County) Hauer SSP2
- Today (2025)
- 437,857 people
- By 2030
- 461,707 · +5.4%
- By 2040
- 503,222 · +14.9%
- By 2050
- 534,684 · +22.1%
- By 2075
- 597,047 · +36.4%
- By 2100
- 609,682 · +39.2%
Race, ethnicity, and origin ACS 2023
- Neighborhood character
- Predominantly White (95%)
- Race & ethnicity
- White 95% Two or more races 3% Black 2%
- Common ancestry
- Romanian 5% Italian 3% Slovak 3%
- Foreign-born
- 1% · Canada
- Languages at home
- 99% English-only · German/W. Germanic 1%
Political lean MEDSL · St. Charles
- 2024 margin
- R (+17.0) · D 40.8% · R 57.8% · Other 1.4%
- 2008→2024 swing
- -7.2pp toward R · 2008: -9.7pp · 2024: -17.0pp
- All cycles
- 2024: R+17.0 2020: R+17.5 2016: R+26.4 2012: R+21.0 2008: R+9.7
Not yet ingested
- Civics
- —
Market trends
- HPI YoY
- ▼ -96.34%
- Current HPI
- 219.9838
- Rent YoY
- —
- Metro
- —
- State GDP YoY
- ▲ 1.84%
- F500 in state
- 20
Industry mix (Fortune 500 HQ in MO)
| Industry | F500 HQs | Revenue |
|---|---|---|
| Healthcare | 1 | $163B |
|
||
| Insurance | 1 | $21B |
|
||
| Industrial Technology | 1 | $17B |
|
||
| Retail | 1 | $16B |
|
||
| Industrial Distribution | 1 | $10B |
|
||
| Utilities | 1 | $9B |
|
||
Price history
+899.7% since first listed8 events — show timeline
- 2026-04-28 Price Changed $339,900 MARIS as Distributed by MLS Grid
- 2026-04-28 Price Changed $33,990,000 MARIS as Distributed by MLS Grid
- 2026-03-16 Price Changed $349,900 MARIS as Distributed by MLS Grid
- 2026-03-10 Listed $359,900 MARIS as Distributed by MLS Grid
- 2004-10-04 Sold (Public Records) $110,000 Public Records
- 1997-07-01 Sold (Public Records) $34,000 Public Records
- 1989-08-01 Sold (Public Records) — Public Records
- 1985-11-01 Sold (Public Records) — Public Records
Property tax history
+5.9%/yrLatest (2025): $2,708 · -0.7% YoY. Source: county tax records.
Cash-flow waterfall
monthlySold comps — $/sqft
last 12 mo · ≤1 miLoading sold comps…