 🏗️ New Construction
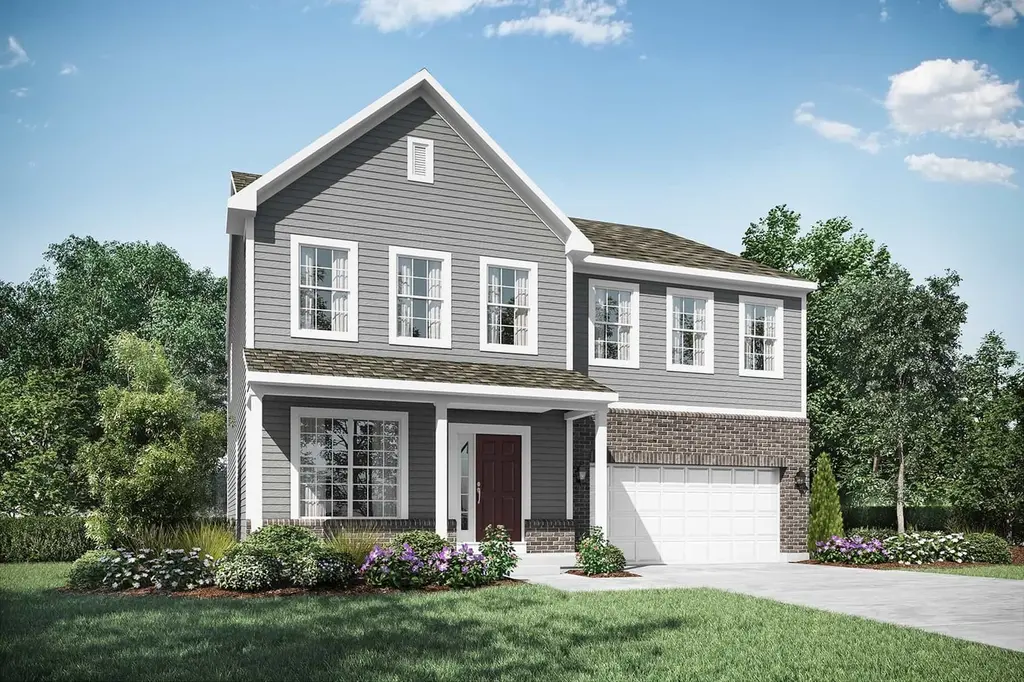
Thoreau Plan · Maineville, OH
Flood risk 1/10 · Minimal
- FEMA flood zone
- X (unshaded)
- Chance of flooding over 30 yrs
- 0.0%
- Est. flood insurance / yr
- $507 – $1,088
Fire risk 1/10 · Minimal
- Est. fire insurance / yr
- $713 – $1,323
Heat risk 4/10 · Minor
- Hot days now (above 101°F)
- 7 days/yr
- Hot days in 30 yrs
- 19 days/yr
Wind risk 2/10 · Minimal
- Chance of severe wind over 30 yrs
- 1.0%
Air-quality risk 4/10 · Minor
- Unhealthy air days now
- 4 days/yr
- Unhealthy air days in 30 yrs
- 6 days/yr
Risk factors via First Street. Map © Google.
Why this score? — see what drove the D+ grade
The composite is a weighted blend of 9 inputs, each scored 0–100. Each bar is that input's sub-score; the figure is the points it added to the 100-point composite (weight × sub-score).
- Appreciation +10.0/10.0
- Cash flow +7.6/30.0
- ARV discount +7.5/15.0
- Schools +6.1/10.0
- Rent growth +4.4/5.0
- Condition / age +4.0/5.0
- Livability +3.5/5.0
- 1% rule +2.3/10.0
- DSCR +1.7/10.0
$440,495
🖨 Deal sheet 📄 Offer letter ✓ Due diligence
Listing remarks
The Thoreau is our largest Smart Series home! This 2-story home features 4 bedrooms, 2.5 baths, a loft, and multiple exterior elevations. Schedule your personal tour today!
Key facts
- 2 garage spots
- Listed 56 days
Property features AI
Finance
- Financial info: List price $436,995
Exterior
- Parking: 2 parking spaces; 2 garage spaces
- Home design: New construction plan home; Address: Thoreau Plan, Maineville, OH 45039
- Exterior features: Living area approximately 3067
Interior
- Bedrooms: 4 bedrooms
- Bathrooms: 2 full bathrooms and 1 half bathroom
- Interior features: Plan: Thoreau
Neighborhood map
What this means for you Summary
Snapshot
- This is a 4-bed/2.5-bath single-family listed at $440k. Condition is rated good.
Deal economics
- At list price, monthly cash flow is $-600 ($-7k/yr) — negative.
- To cash-flow at today's rent, offer at most $421k (4.3% below list).
- To meet the 1% rule (rent ≥ 1% of price), the offer needs to be $369k (16.3% below list).
- Recommended offer: $369k (16.3% below list) — sets the bar for 1% rule.
- Cap rate 4.9% vs local median 3.9% in Maineville — meaningfully above typical; check what's discounted (condition, days-on-market, listing class) to confirm the premium yield is real.
Location & tenants
- Location reads 69/100 on livability (#529 in OH) — a middle-class / working-renter tenant base. Strengths: crime A+, employment A+, cost of living A+; Watch: amenities F, commute F, health & safety F.
- Little Miami Local (rural): math 67% / reading 70% proficiency, ranked #140 of 656 in OH (top 21%) — acceptable for families but not a draw, mixed tenant base, ~2y average lease; only 17% free/reduced lunch — higher-income household profile.
- Market conditions: Rents rising fast (+7.4%/yr); 126 active listings in the ZIP; 4 comparable units currently listed for rent nearby; rentals lingering (median 44d on market — plan ~5-8 weeks vacancy on turnover, expect pricing pressure); 50% of comp listings sitting > 30 days — soft ceiling on asking rent; solid renter incomes; 1,224 units permitted in Warren County in 2024 (474 in 5+ unit buildings).
- This rent runs 41% of the median local income ($109k/yr) — at the standard rent-burdened threshold; future hikes will face affordability resistance.
Forward outlook
- In year one you build about $54k of equity ($4k loan paydown + $51k appreciation (10.0% local appreciation)).
- Warren County population projected at +16% by 2050 — long-run rental-demand tailwind backs the buy-and-hold thesis.
- By year 2, paydown + projected appreciation supports a ~$87k cash-out refi (75% LTV) — recoverable capital for the next deal without selling this one.
Negotiation context
- It's been on market 56 days — a 3% lower offer ($427k) is reasonable based on typical stale-listing flexibility.
Questions for the listing agent
- What do current leases actually rent for vs. the listed asking? Can we see a recent rent roll and the last 12 months of T-12 income?
- It's been on market 56 days. Have you received any prior offers? Is the seller open to a 16% concession, seller financing, or rate buy-down credit?
- Is there a deadline driving the sale (1031 exchange, divorce, estate, relocation)? That informs how much negotiation room exists.
- Schools are A-rated — typically a magnet for longer-tenancy family renters. What's the average tenant stay here, and is there a school-zone premium baked into asking?
- The area grade is low — what's the realistic commute time and amenity access for the typical tenant pool here? Any planned neighborhood developments (good or bad) we should know about?
- What's the average days-on-market for RENTAL listings here right now (not sales)? A rising rental-DOM trend means longer vacancies and softer asking-rent achievability than the comps imply.
- What's the recent tenant-quality profile in this submarket — average credit score on applications, eviction rate, late-payment / NSF rate, and stable-employment percentage? A property-management company in the area should have these aggregated.
- How much new for-sale + rental construction is in the pipeline within 1–3 miles? Heavy new supply typically softens prices + rents 12–24 months out; constrained supply supports both.
Investment metrics
- 1% rule
- 0.73% ✗
- Cap rate
- 4.88%
- Cash-on-cash
- -5.06%
- DSCR
- 0.77
- GRM
- 11.5
CMA / ARV
- ARV (median comp)
- $508,248
- List price
- $440,495
- Delta
- -13.33%
- Verdict
- UNDERPRICED
- Comps
- 20 within 1.0 mi
Show comp detail 12 sales within ~0.75 mi
| Address | Dist | Beds/Ba | Sqft | Sold | Price | $/sf | Match |
|---|---|---|---|---|---|---|---|
| 7841 Horizon Bend Rd | 0.18mi | 4/2.5 | 3,157 (+3%) | 0mo | $510,234 | $162 | 86 |
| 1479 Englewood Ct | 0.22mi | 4/2.5 | 3,205 (+4%) | 2mo | $540,000 | $168 | 81 |
| 1527 Englewood Ct | 0.16mi | 4/3.5 | 3,319 (+8%) | 8mo | $530,000 | $160 | 68 |
| 1448 Soaring Way | 0.31mi | 4/2.5 | 2,746 (-10%) | 1mo | $515,000 | $188 | 68 |
| 1352 Eagle Blvd | 0.27mi | 4/2.5 | 2,820 (-8%) | 9mo | $430,000 | $152 | 67 |
| 1322 Eagle Blvd | 0.30mi | 4/2.5 | 2,820 (-8%) | 11mo | $498,000 | $177 | 63 |
| 1236 Sinclair Dr | 0.51mi | 5/4.5 (+1) | 3,132 (+2%) | 0mo | $525,000 | $168 | 60 |
| 7606 Harwood Ct | 0.51mi | 4/2.5 | 2,623 (-14%) | 2mo | $460,000 | $175 | 51 |
| 1201 Sinclair Dr | 0.45mi | 4/2.5 | 3,489 (+14%) | 10mo | $539,000 | $154 | 48 |
| 1509 Wexler Ct | 0.46mi | 3/3.0 (-1) | 2,666 (-13%) | 10mo | $565,910 | $212 | 42 |
| 1123 Elk Run | 0.55mi | 5/3.0 (+1) | 3,426 (+12%) | 9mo | $430,000 | $126 | 40 |
| 935 Pine Needle Pl | 0.68mi | 4/2.5 | 2,634 (-14%) | 7mo | $409,000 | $155 | 39 |
Match score weights: distance 35% · size 25% · config 20% · recency 20%. Top-matched comps best support the ARV.
Projected returns pro-forma
10.0% appreciation · 7.42% rent growth · sell at horizon
- IRR
- 22.0%
- Equity multiple
- 2.80×
- Total profit
- $255,758
- Equity at exit
- $457,870
- IRR
- 20.8%
- Equity multiple
- 6.80×
- Total profit
- $824,809
- Equity at exit
- $987,414
Cash invested: $142,309 (down + closing). Projections, not guarantees.
Landlord ↔ Tenant lean methodology
- Overall (STATE)
- 73 Landlord-Friendly
- State Ohio
- 73 Landlord-Friendly · R+6
- County
- — inherits STATE
- City
- — inherits STATE
ZIP-level market 45039
- Home prices YoY
- 7.3%
- Rents YoY
- 7.4%
- Active inventory
- 126
- Price-to-rent
- 10.0×
Monthly cashflow live
- Estimated rent
- $3,686 medium interval (Pro) →
- Mortgage (P&I)
- −$2,665
- Tax est. 1.5%
- −$635 /mo · $7,624/yr
- Insurance
- −$212
- HOA
- −$0
- Vacancy / Maint / Mgmt
- −$774
- Net cashflow
- $-600
Break-even live
UW: 25.0% down · 7.5% · 30yr · 1.5% tax · 5.0% vac · 8.0% maint · 8.0% mgmt
Financing live
Cash to close
- Down payment
- $127,062
- Closing costs
- $15,247
- Reserves months
- —
- Total cash needed
- —
Loan-product check · same deal, 3 products live
Conventional
25% down · 7.5% · 30yr
- Down + closing
- —
- Monthly P&I
- —
- Monthly cashflow
- —
- DSCR
- —
- Eligible?
- —
Personal DTI + credit; lowest rate.
DSCR
20% down · 8.5% · 30yr
- Down + closing
- —
- Monthly P&I
- —
- Monthly cashflow
- —
- DSCR
- —
- Eligible?
- —
No personal income docs; deal must DSCR.
Hard money
10% down · 12.0% · 12mo
- Down + closing
- —
- Monthly P&I
- —
- Monthly cashflow
- —
- DSCR
- —
- Eligible?
- —
Short-term bridge; refi at stabilization.
Rent comps 4 comps
| Address | Beds | Baths | Sqft | Rent | $/sqft | DOM | Units | Dist |
|---|---|---|---|---|---|---|---|---|
| 7814 Wilderness Way Maineville, OH | 4.0 | 2.0 | 2140 | $2,671 | $1.25 | 43d | 1 | 0.72mi |
| 1256 Carrington Pl Maineville, OH | 4.0 | 2.5 | 3000 | $2,521 | $0.84 | 23d | 1 | 0.84mi |
| 6976 Briarcliff Ct Maineville, OH | 4.0 | 3.0 | 2475 | $3,595 | $1.45 | 16d | 1 | 1.05mi |
| 6965 Quellin Blvd Maineville, OH | 5.0 | 2.5 | 3640 | $7,500 | $2.06 | 43d | 1 | 1.08mi |
Listing history 13 events
-
2026-06-18days on market $440,495 Active 56 DOM
-
2026-06-17days on market $440,495 Active 55 DOM
-
2026-06-16days on market $440,495 Active 54 DOM
-
2026-06-15days on market $440,495 Active 53 DOM
-
2026-06-13days on market $440,495 Active 51 DOM
-
2026-06-09days on market $440,495 Active 47 DOM
-
2026-06-08pricedays on market $440,495 Active 46 DOM
-
2026-06-07days on market $436,995 Active 45 DOM
-
2026-06-03days on market $436,995 Active 41 DOM
-
2026-06-02days on market $436,995 Active 40 DOM
-
2026-06-01days on market $436,995 Active 39 DOM
-
2026-05-31days on market $436,995 Active 38 DOM
-
2026-04-23$436,995 Active 172-char remark
ⓘ Source: listings_history table (triggers on properties + properties_extension) + one-shot
backfill from property_details.listing_events for pre-trigger history.
Climate risk First Street
- Flood 1/10 Low FEMA zone X (unshaded) · 0% chance over 30 yrs
- Wildfire 1/10 Low
- Heat 4/10 Moderate 7 d/yr ≥101°F today · 19 d/yr by 30 yrs out
- Wind 2/10 Low 100% chance of damaging wind over 30 yrs
- Air quality 4/10 Moderate 4 unhealthy d/yr today · 6 by 30 yrs out
Nearby sold comps map
Loading sold comps map…
Walkable amenities ~0.75 mi
Loading nearby amenities…
Taxation est. · year 1
- Rental income
- $44,236
- − Mortgage interest
- −$28,470
- − Property taxes
- −$7,624
- − Insurance
- −$2,541
- − Repairs & maintenance
- −$3,539
- − Management
- −$3,539
- − Depreciation
- −$14,785
- Taxable loss
- −$16,262
- Est. tax savings @ 24.0%
- +$3,903
- After-tax cash flow
- $-3,299/yr
For passive investors: Depreciation is non-cash, so a rental often shows a tax loss while cash-flowing — sheltering income. Rental losses are passive: they offset passive income freely, and up to $25,000/yr can offset ordinary (W-2) income if you actively participate and your MAGI is under $100k (phasing out to $0 by $150k); unused losses carry forward. On sale, claimed depreciation is recaptured at up to 25%, and gains may owe capital-gains tax (a 1031 exchange can defer both). Figures are a year-1 estimate at your 24.0% rate — not tax advice; consult a CPA.
Condition & rehab AI · 1 photo
This 2-story Smart Series home is in excellent condition with no visible repairs needed. It offers a good return on investment with updates that can significantly increase its resale and rental value.
Value-add opportunities
- Both Painting exterior and interior — Enhances curb appeal and interior aesthetics
- Both Landscaping improvements — Enhances curb appeal and adds value
- Both New flooring in bathrooms and kitchen — Improves functionality and aesthetics
- Both New windows and doors — Enhances energy efficiency and curb appeal
Renovation cost estimate screening
Value-add ROI direction
- Both Painting exterior and interior — Enhances curb appeal and interior aesthetics ↑
- Both Landscaping improvements — Enhances curb appeal and adds value ↑
- Both New flooring in bathrooms and kitchen — Improves functionality and aesthetics ↑
- Both New windows and doors — Enhances energy efficiency and curb appeal ↑
ⓘ Cost ranges are severity-bucket heuristics (US national rule-of-thumb). Get contractor quotes + a written scope before underwriting a rehab budget.
Schools (NCES district)
- District
- Little Miami Local
- NCES district ID
- 3905044
- Math proficiency
- 67% ▼ -11.00%
- Reading proficiency
- 70% ▼ -6.00%
- Median HH income
- $74,949
- Composite
- 60.5/100
- National rank
- #844
- State rank
- #140 of 656 in OH
Livability — Maineville
- Score
- 69/100
- State rank
- #529
- US rank
- #9001
Category grades
Schools grade is shown separately in the Schools card above.
Census & demographics
- Census place
- Maineville, OH
- County
- Warren County · 196,906 people
- Metro
- Cincinnati, OH-KY-IN
- Population (ZIP)
- 28,335
- Household income
- $108,794
- Rent vs Own
- Severe rent burden
- 307.0
Population outlook (Warren County) Hauer SSP2
- Today (2025)
- 248,603 people
- By 2030
- 259,345 · +4.3%
- By 2040
- 277,666 · +11.7%
- By 2050
- 289,599 · +16.5%
- By 2075
- 311,681 · +25.4%
- By 2100
- 302,738 · +21.8%
Race, ethnicity, and origin ACS 2023
- Neighborhood character
- Predominantly White (88%)
- Race & ethnicity
- White 88% Hispanic / Latino 5% Two or more races 5% Asian 3% Black 2%
- Common ancestry
- Romanian 2% Scotch-Irish 2% Lithuanian 2%
- Foreign-born
- 8% · Canada, Jamaica
- Languages at home
- 92% English-only · Spanish 3% Russian/Polish/Slavic 2% Other Indo-European 1%
Political lean MEDSL · Warren
- 2024 margin
- Solid R (+31.5) · D 33.8% · R 65.3%
- 2008→2024 swing
- +4.5pp toward D · 2008: -36.1pp · 2024: -31.5pp
- All cycles
- 2024: R+31.5 2020: R+30.8 2016: R+37.6 2012: R+39.5 2008: R+36.1
Not yet ingested
- Civics
- —
Market trends
- HPI YoY
- ▲ 38.63%
- Current HPI
- 568.09
- Rent YoY
- ▲ 7.42%
- Metro
- Cincinnati, OH-KY-IN
- State GDP YoY
- ▲ 1.98%
- F500 in state
- 48
Industry mix (Fortune 500 HQ in OH)
| Industry | F500 HQs | Revenue |
|---|---|---|
| Insurance | 3 | $145B |
|
||
| Industrial Machinery | 3 | $49B |
|
||
| Financial Services | 3 | $24B |
|
||
| Consumer Goods | 2 | $93B |
|
||
| Aerospace / Defense | 2 | $47B |
|
||
| Utilities | 2 | $33B |
|
||
Cash-flow waterfall
monthlySold comps — $/sqft
last 12 mo · ≤1 miLoading sold comps…