 Triplex
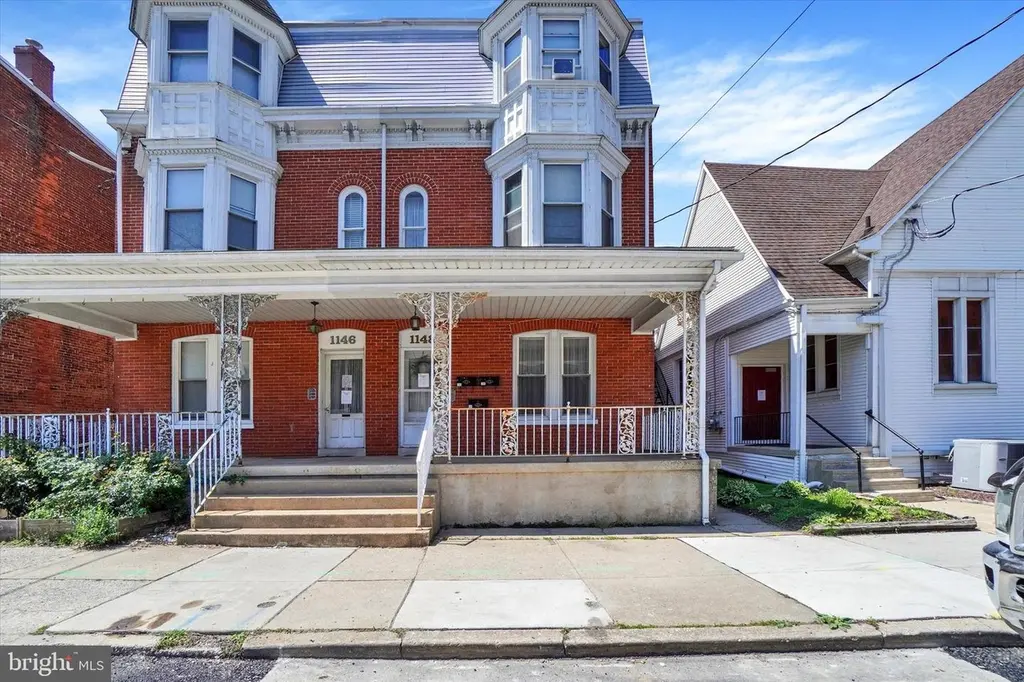
1148 N George St · North York, PA
Flood risk 1/10 · Minimal
- FEMA flood zone
- X (unshaded)
- Chance of flooding over 30 yrs
- 0.0%
- Est. flood insurance / yr
- $473 – $860
Fire risk 1/10 · Minimal
- Est. fire insurance / yr
- $511 – $949
Heat risk 6/10 · Moderate
- Hot days now (above 103°F)
- 7 days/yr
- Hot days in 30 yrs
- 15 days/yr
Wind risk 4/10 · Minor
- Chance of severe wind over 30 yrs
- 10.0%
Air-quality risk 3/10 · Minor
- Unhealthy air days now
- 3 days/yr
- Unhealthy air days in 30 yrs
- 5 days/yr
Risk factors via First Street. Map © Google.
Why this score? — see what drove the C+ grade
The composite is a weighted blend of 9 inputs, each scored 0–100. Each bar is that input's sub-score; the figure is the points it added to the 100-point composite (weight × sub-score).
- Cash flow +30.0/30.0
- DSCR +10.0/10.0
- 1% rule +9.2/10.0
- Rent growth +4.1/5.0
- Schools +4.0/10.0
- Livability +3.6/5.0
- Condition / age +2.5/5.0
- ARV discount +0.0/15.0
- Appreciation +0.0/10.0
$290,000
🖨 Deal sheet 📄 Offer letter ✓ Due diligence
Multi-family units
County records classify this as Multi-Family (2-4 Unit). Listing-text estimate: 3 units. confirmed
Listing remarks
Thank you for taking a look at 1148 N George St. This semi-detached, brick and vinyl three-unit property is one of the cleanest and best-maintained multi-units to hit the market in quite some time. Pride of ownership is evident throughout. All three units are currently rented, providing immediate income. The first-floor tenant has been in place for over 30 years, offering exceptional stability. Each unit features its own laundry, along with separate gas and electric meters, with tenants responsible for those utilities. The owner currently pays water (approximately $65/month), sewer ($420/quarter), and trash ($367/quarter). All other utilities are tenant-paid. The property also includes a de
Key facts
- 4,230 sq ft lot
- 2 garage spots
- Built 1900
Tags
Property features AI
Finance
- Other: Total of 3 units; Above-grade finished area reported as 3,306 (source: assessor)
- Financial info: Gross income reported: $35,520
Exterior
- Parking: Detached rear-entry garage with 2 garage spaces; On-street parking available
- Utilities: Public water; Public sewer; Electric cooling fuel; Natural gas heating fuel
- Home design: Semi-detached building; Fee simple ownership
- Construction: Brick construction; Block foundation; Originally built (year source: assessor)
- Exterior features: No tidal water on the lot; Above-grade and below-grade structures present
Interior
- Bedrooms: Two 1-bedroom units; One 2-bedroom unit
- Heating & cooling: Hot water and central heating; Natural gas heating and natural gas hot water; Window air conditioning units (electric)
- Interior features: Three total residential units (multi-family property)
Neighborhood map
What this means for you Summary
Snapshot
- This is a 3 × 2-bed/1-bath units multifamily listed at $290k.
Deal economics
- At list price, monthly cash flow is $1k ($15k/yr) — positive. Per door: $428/mo.
- The deal already cash-flows at list — no discount required.
- Meets the 1% rule at list price ($4k rent vs $290k).
Location & tenants
- Location reads 71/100 on livability (#713 in PA) — a middle-class / working-renter tenant base. Strengths: crime A+, cost of living A+, housing A+; Watch: amenities D+, commute F.
- Central York SD (suburban): math 33% / reading 57% proficiency, ranked #244 of 539 in PA (top 45%) — families likely to look elsewhere, expect single-tenant / working-renter base with shorter leases.
- Zoned schools: Central York Hs (math 61% / reading 74%, grade B, #59 of 437 statewide, top 14%, 1,807 students, 40% FRL) — zoned schools average 40% FRL vs 24% district-wide (17 pts higher); higher-poverty schools than district average — tighter screening recommended.
- Zoned-school proficiency averages 68% at this address vs 45% district-wide (+23 pts) — the actual schools serving this property are materially stronger than the Central York SD average implies; a family-tenant draw the district grade alone would hide.
- Market conditions: Rents rising fast (+6.4%/yr); 249 active listings in the ZIP; solid renter incomes; 1,328 units permitted in York County in 2024 (338 in 5+ unit buildings).
- At $4,110/mo this rent would consume 63% of the median local household income ($79k/yr) (locally 722% of renters already pay >50% of income on rent) — very limited rent-growth headroom before tenants either downsize or default.
Forward outlook
- Local home prices are declining (-3.0%/yr); year-one equity from $2k of loan paydown is wiped out by about $9k of value loss. Plan a longer hold.
- At projected returns (-3.0% appreciation + 6.4% rent growth), your $81k cash investment doubles in ~6 years — after that, you're playing with house money.
Negotiation context
- Only 12 days on market — expect competitive offers; lowballing is unlikely to land.
- Current owner paid $110k; list at $290k implies a 164% gain — meaningful room to come down on a strong offer.
Risks & watch-outs
- Watch-outs: built in 1900 — expect roof / HVAC / electrical / plumbing capex.
- Climate carrying-cost: extreme-heat days projected 7→15/yr by 2055 (HVAC capex compounding) — expect insurance premiums to compound above CPI over the hold.
Questions for the listing agent
- Can we see the unit-by-unit rent roll, current vacancy, and any below-market leases? What's the average tenancy length?
- What capital expenditures (roof, boiler, parking lot, exteriors) have been made in the last 5 years, and what's planned in the next 2?
- Built in 1900 — when were the roof, HVAC, electrical panel, plumbing, and water heater last replaced?
- Is there a deadline driving the sale (1031 exchange, divorce, estate, relocation)? That informs how much negotiation room exists.
- Schools are F-rated, which usually means shorter tenancies and higher turnover. Who's the typical renter profile here, and what's been the actual vacancy rate?
- What's the average days-on-market for RENTAL listings here right now (not sales)? A rising rental-DOM trend means longer vacancies and softer asking-rent achievability than the comps imply.
- What's the recent tenant-quality profile in this submarket — average credit score on applications, eviction rate, late-payment / NSF rate, and stable-employment percentage? A property-management company in the area should have these aggregated.
- How much new apartment / multifamily construction is in the pipeline within 1–3 miles? Heavy new supply (>2% of stock underway) typically softens rents 12–24 months out; light construction supports rent growth.
Investment metrics
- 1% rule
- 1.42% ✓
- Cap rate
- 11.61%
- Cash-on-cash
- 18.98%
- DSCR
- 1.84
- GRM
- 5.9
CMA / ARV
- ARV (median comp)
- $217,319
- List price
- $290,000
- Delta
- 33.44%
- Verdict
- OVERPRICED
- Comps
- 10 within 1.0 mi
Projected returns pro-forma
-3.0% appreciation · 6.38% rent growth · sell at horizon
- IRR
- 14.6%
- Equity multiple
- 1.61×
- Total profit
- $49,286
- Equity at exit
- $43,240
- IRR
- 25.7%
- Equity multiple
- 3.61×
- Total profit
- $211,956
- Equity at exit
- $25,074
Cash invested: $81,200 (down + closing). Projections, not guarantees.
Landlord ↔ Tenant lean methodology
- Overall (STATE)
- 62 Landlord-Friendly
- State Pennsylvania
- 62 Landlord-Friendly · EVEN
- County
- — inherits STATE
- City
- — inherits STATE
ZIP-level market 17404
- Rents YoY
- 6.4%
- Active inventory
- 249
- Price-to-rent
- 17.6×
Monthly cashflow live
- Estimated rent
- $4,110 high interval (Pro) →
- Mortgage (P&I)
- −$1,521
- Tax from tax record
- −$321 /mo · $3,853/yr
- Insurance
- −$121
- HOA
- −$0
- Vacancy / Maint / Mgmt
- −$863
- Net cashflow
- $1,284
Break-even live
3-unit breakdown (identical units grouped — click to expand)
| Units | Beds | Baths | Est. rent |
|---|---|---|---|
| 3× units | 2 | 1 | $4,110 |
| #1 | 2 | 1 | $1,370 |
| #2 | 2 | 1 | $1,370 |
| #3 | 2 | 1 | $1,370 |
| Total (3 units) | $4,110 | ||
UW: 25.0% down · 7.5% · 30yr · 1.5% tax · 5.0% vac · 8.0% maint · 8.0% mgmt
Financing live
Cash to close
- Down payment
- $72,500
- Closing costs
- $8,700
- Reserves months
- —
- Total cash needed
- —
Loan-product check · same deal, 3 products live
Conventional
25% down · 7.5% · 30yr
- Down + closing
- —
- Monthly P&I
- —
- Monthly cashflow
- —
- DSCR
- —
- Eligible?
- —
Personal DTI + credit; lowest rate.
DSCR
20% down · 8.5% · 30yr
- Down + closing
- —
- Monthly P&I
- —
- Monthly cashflow
- —
- DSCR
- —
- Eligible?
- —
No personal income docs; deal must DSCR.
Hard money
10% down · 12.0% · 12mo
- Down + closing
- —
- Monthly P&I
- —
- Monthly cashflow
- —
- DSCR
- —
- Eligible?
- —
Short-term bridge; refi at stabilization.
Listing history 5 events
-
2026-05-06status Pending 1217-char remark
-
2026-04-24$290,000 Active 1217-char remark
-
2003-03-04soldstatus $109,900
-
2000-03-31soldstatus $102,000
-
1990-03-16soldstatus $57,500
ⓘ Source: listings_history table (triggers on properties + properties_extension) + one-shot
backfill from property_details.listing_events for pre-trigger history.
Tax reassessment forecast PA · Partial reset (capped growth)
- Current annual tax
- $3,853 · $321/mo
- Projected year-2 tax
- $4,217 · $351/mo
- Expected delta
- +$365/yr (+$30/mo · 9.5%)
ⓘ Screening estimate from a state-policy table — verify with the county assessor before closing.
Climate risk First Street
- Flood 1/10 Low FEMA zone X (unshaded) · 0% chance over 30 yrs
- Wildfire 1/10 Low
- Heat 6/10 Major 7 d/yr ≥103°F today · 15 d/yr by 30 yrs out
- Wind 4/10 Moderate 10% chance of damaging wind over 30 yrs
- Air quality 3/10 Moderate 3 unhealthy d/yr today · 5 by 30 yrs out
Nearby sold comps map
Loading sold comps map…
Walkable amenities ~0.75 mi
Loading nearby amenities…
Taxation est. · year 1
- Rental income
- $49,320
- − Mortgage interest
- −$16,245
- − Property taxes
- −$3,853
- − Insurance
- −$1,450
- − Repairs & maintenance
- −$3,946
- − Management
- −$3,946
- − Depreciation
- −$8,436
- Taxable income
- $11,445
- Est. tax owed @ 24.0%
- −$2,747
- After-tax cash flow
- $12,664/yr
For passive investors: Depreciation is non-cash, so a rental often shows a tax loss while cash-flowing — sheltering income. Rental losses are passive: they offset passive income freely, and up to $25,000/yr can offset ordinary (W-2) income if you actively participate and your MAGI is under $100k (phasing out to $0 by $150k); unused losses carry forward. On sale, claimed depreciation is recaptured at up to 25%, and gains may owe capital-gains tax (a 1031 exchange can defer both). Figures are a year-1 estimate at your 24.0% rate — not tax advice; consult a CPA.
Schools (NCES district)
- District
- Central York SD
- NCES district ID
- 4205490
- Math proficiency
- 33% ▼ -2.00%
- Reading proficiency
- 57% ▼ -4.00%
- Median HH income
- $64,385
- Composite
- 39.92/100
- National rank
- #3849
- State rank
- #244 of 539 in PA
Livability — North York
- Score
- 71/100
- State rank
- #713
- US rank
- #7045
Category grades
Schools grade is shown separately in the Schools card above.
Census & demographics
- Census place
- North York, PA
- County
- York County · 278,806 people
- Metro
- York-Hanover, PA
- Population (ZIP)
- 39,374
- Household income
- $78,506
- Rent vs Own
- Severe rent burden
- 722.0
Population outlook (York County) Hauer SSP2
- Today (2025)
- 454,205 people
- By 2030
- 457,407 · +0.7%
- By 2040
- 457,529 · +0.7%
- By 2050
- 448,261 · -1.3%
- By 2075
- 427,388 · -5.9%
- By 2100
- 384,218 · -15.4%
Race, ethnicity, and origin ACS 2023
- Neighborhood character
- Majority White (65%)
- Race & ethnicity
- White 65% Hispanic / Latino 19% Black 12% Two or more races 8%
- Hispanic origin (detail)
- Mexican 2% Puerto Rican 9% Dominican 4%
- Common ancestry
- Romanian 2% Slovak 2% Lithuanian 1%
- Foreign-born
- 6% · Canada, Vietnam
- Languages at home
- 85% English-only · Spanish 12% Russian/Polish/Slavic 1%
Political lean MEDSL · York
- 2024 margin
- Strong R (+25.3) · D 36.9% · R 62.1%
- 2008→2024 swing
- -11.7pp toward R · 2008: -13.6pp · 2024: -25.3pp
- All cycles
- 2024: R+25.3 2020: R+24.6 2016: R+29.3 2012: R+21.2 2008: R+13.6
Not yet ingested
- Civics
- —
Market trends
- HPI YoY
- ▼ -135.44%
- Current HPI
- 237.5683
- Rent YoY
- ▲ 6.38%
- Metro
- York-Hanover, PA
- State GDP YoY
- ▲ 1.68%
- F500 in state
- 34
Industry mix (Fortune 500 HQ in PA)
| Industry | F500 HQs | Revenue |
|---|---|---|
| Healthcare | 2 | $309B |
|
||
| Insurance | 2 | $27B |
|
||
| Telecommunications / Media | 1 | $124B |
|
||
| Industrial Distribution | 1 | $22B |
|
||
| Financial Services | 1 | $20B |
|
||
| Chemicals / Materials | 1 | $18B |
|
||
Price history
+404.3% since first listed5 events — show timeline
- 2026-05-06 Pending — BRIGHT MLS
- 2026-04-24 Listed $290,000 BRIGHT MLS
- 2003-03-04 Sold (Public Records) $109,900 Public Records
- 2000-03-31 Sold (Public Records) $102,000 Public Records
- 1990-03-16 Sold (Public Records) $57,500 Public Records
Property tax history
+2.7%/yrLatest (2026): $3,853 · +3.5% YoY. Source: county tax records.
Cash-flow waterfall
monthlySold comps — $/sqft
last 12 mo · ≤1 miLoading sold comps…