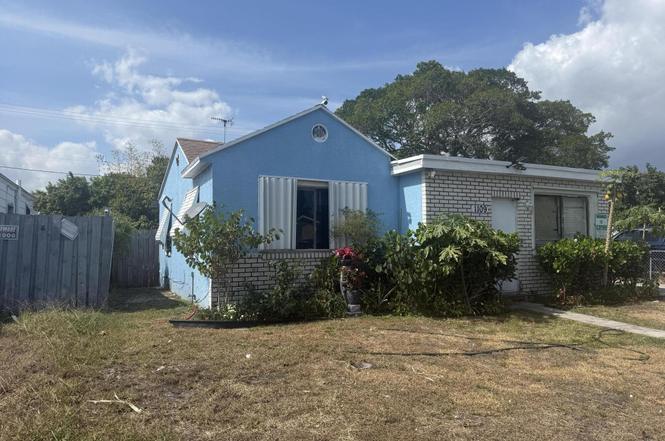
1109 S E St · Lake Worth Beach, FL
Flood risk 1/10 · Minimal
- FEMA flood zone
- X (unshaded)
- Chance of flooding over 30 yrs
- 0.0%
- Est. flood insurance / yr
- $507 – $1,088
Fire risk 1/10 · Minimal
- Est. fire insurance / yr
- $947 – $1,759
Heat risk 10/10 · Severe
- Hot days now (above 105°F)
- 7 days/yr
- Hot days in 30 yrs
- 26 days/yr
Wind risk 10/10 · Severe
- Chance of severe wind over 30 yrs
- 99.0%
Air-quality risk 2/10 · Minimal
- Unhealthy air days now
- 0 days/yr
- Unhealthy air days in 30 yrs
- 2 days/yr
Risk factors via First Street. Map © Google.
Why this score? — see what drove the F grade
The composite is a weighted blend of 9 inputs, each scored 0–100. Each bar is that input's sub-score; the figure is the points it added to the 100-point composite (weight × sub-score).
- ARV discount +7.5/15.0
- Cash flow +7.1/30.0
- Schools +4.3/10.0
- Rent growth +3.4/5.0
- Livability +2.5/5.0
- Condition / age +2.5/5.0
- 1% rule +1.9/10.0
- DSCR +1.3/10.0
- Appreciation +0.0/10.0
$345,000
🖨 Deal sheet (PDF) 📄 Offer letter ✓ Due diligence
Listing remarks MLS
GREAT STATER HOME OR RENTAL PROPERTY. HOME LOCATED CLOSE SHOPPING CENTER AND EASY ACCESS TO COMMUTE.
Key facts
- On site laundry
- No hoa
- Garage
Tags
Property features AI
Finance
- Other: Pets allowed with no restrictions
- HOA & community: No association amenities
Exterior
- Parking: RV access/parking
- Utilities: Public water; Three-phase electric; Cable available
- Home design: Single-family home; One-story; Entry-level living area; South-facing
- Construction: Concrete/CBS construction; Composition/shingle roof
- Exterior features: Fenced yard; Outbuilding; Room for a pool
Interior
- Kitchen: Electric range; Microwave; Refrigerator
- Bedrooms: Four bedrooms on the main level
- Bathrooms: Two full bathrooms (both on the main level)
- Heating & cooling: Window/wall heating; Wall/window air conditioning units
- Interior features: Walk-in closets; Split bedroom layout
- Laundry & utility: Laundry closet inside the home; Laundry hookups in the garage
Neighborhood map
What this means for you Summary
Snapshot
- This is a 2-bed/1.5-bath single-family listed at $345k.
Deal economics
- At list price, monthly cash flow is $-485 ($-6k/yr) — negative.
- To cash-flow at today's rent, offer at most $259k (24.9% below list).
- To meet the 1% rule (rent ≥ 1% of price), the offer needs to be $237k (31.4% below list).
- Recommended offer: $237k (31.4% below list) — sets the bar for 1% rule.
Location & tenants
- Location reads: area grade F — affects rentability + tenant quality, not the cash-flow math above.
- Palm Beach (suburban): math 46% / reading 53% proficiency, ranked #34 of 73 in FL (top 47%) — families likely to look elsewhere, expect single-tenant / working-renter base with shorter leases.
- Zoned schools: Barton Elementary School (math 25% / reading 20%, grade F, #2,073 of 2,144 statewide, top 97%, 1,064 students, 80% FRL); Lake Worth Community Middle (math 17% / reading 23%, grade F, #558 of 571 statewide, top 98%, 1,249 students, 75% FRL); Lake Worth High School (math 16% / reading 27%, grade F, #546 of 667 statewide, top 82%, 2,683 students, 71% FRL) — zoned schools average 75% FRL vs 52% district-wide (23 pts higher); higher-poverty schools than district average — tighter screening recommended.
- Zoned-school proficiency averages 21% at this address vs 50% district-wide (-28 pts) — the specific schools serving this property underperform the Palm Beach average; the district grade overstates school quality for this exact location.
- Market conditions: Rents rising (+3.5%/yr); 250 active listings in the ZIP; 40 comparable units currently listed for rent nearby; rentals at typical pace (median 20d on market — plan ~3-4 weeks tenant-placement turnaround); 3,974 units permitted in Palm Beach County in 2024 (1,012 in 5+ unit buildings).
- At $2,368/mo this rent would consume 46% of the median local household income ($62k/yr) (locally 2429% of renters already pay >50% of income on rent) — very limited rent-growth headroom before tenants either downsize or default.
Forward outlook
- Local home prices are declining (-3.0%/yr); year-one equity from $2k of loan paydown is wiped out by about $10k of value loss. Plan a longer hold.
- Palm Beach County population projected at +30% by 2050 — long-run rental-demand tailwind backs the buy-and-hold thesis.
Negotiation context
- It's been on market 120 days — a 9% lower offer ($314k) is reasonable based on typical stale-listing flexibility.
- 8 sale attempts since 25y ago; this cycle's ask is 6% above the opening price — seller raised mid-cycle; expect resistance to lowballs.
- Current owner paid $75k; list at $345k implies a 360% gain — meaningful room to come down on a strong offer.
Risks & watch-outs
- Watch-outs: built in 1955 — expect roof / HVAC / electrical / plumbing capex.
- Climate carrying-cost: severe wind risk, 99% chance of damaging wind over 30y; extreme-heat days projected 7→26/yr by 2055 (HVAC capex compounding) — expect insurance premiums to compound above CPI over the hold.
Questions for the listing agent
- What do current leases actually rent for vs. the listed asking? Can we see a recent rent roll and the last 12 months of T-12 income?
- It's been on market 120 days. Have you received any prior offers? Is the seller open to a 31% concession, seller financing, or rate buy-down credit?
- Built in 1955 — when were the roof, HVAC, electrical panel, plumbing, and water heater last replaced?
- Why hasn't it sold? Are there any deal-killer items the seller is aware of (foundation, flood, title, zoning, code violations)?
- Is there a deadline driving the sale (1031 exchange, divorce, estate, relocation)? That informs how much negotiation room exists.
- The area grade is low — what's the realistic commute time and amenity access for the typical tenant pool here? Any planned neighborhood developments (good or bad) we should know about?
- What's the average days-on-market for RENTAL listings here right now (not sales)? A rising rental-DOM trend means longer vacancies and softer asking-rent achievability than the comps imply.
- What's the recent tenant-quality profile in this submarket — average credit score on applications, eviction rate, late-payment / NSF rate, and stable-employment percentage? A property-management company in the area should have these aggregated.
- How much new for-sale + rental construction is in the pipeline within 1–3 miles? Heavy new supply typically softens prices + rents 12–24 months out; constrained supply supports both.
Investment metrics
- 1% rule
- 0.69% ✗
- Cap rate
- 4.60%
- Cash-on-cash
- -6.03%
- DSCR
- 0.73
- GRM
- 12.1
CMA / ARV
No comps found within radius.
Projected returns pro-forma
-3.0% appreciation · 3.53% rent growth · sell at horizon
- IRR
- -26.1%
- Equity multiple
- 0.11×
- Total profit
- $-85,532
- Equity at exit
- $51,441
- IRR
- -21.3%
- Equity multiple
- -0.13×
- Total profit
- $-108,948
- Equity at exit
- $29,829
Cash invested: $96,600 (down + closing). Projections, not guarantees.
Landlord ↔ Tenant lean methodology
- Overall (STATE)
- 87 Strongly Landlord-Friendly
- State Florida
- 87 Strongly Landlord-Friendly · R+3
- County
- — inherits STATE
- City
- — inherits STATE
ZIP-level market 33460
- Rents YoY
- 3.5%
- Active inventory
- 250
- Price-to-rent
- 12.1×
Monthly cashflow live
- Estimated rent
- $2,368 high interval (Pro) →
- Mortgage (P&I)
- −$1,809
- Tax from tax record
- −$403 /mo · $4,837/yr
- Insurance
- −$144
- HOA
- −$0
- Vacancy / Maint / Mgmt
- −$497
- Net cashflow
- $-485
Break-even live
Sensitivity live
| Price | -10% $-290 | -5% $-388 | +0% $-485 | +5% $-583 | +10% $-681 |
|---|---|---|---|---|---|
| Rent | -10% $-672 | -5% $-579 | +0% $-485 | +5% $-392 | +10% $-298 |
| Rate | -1.0pp $-312 | -0.5pp $-398 | base $-485 | +0.5pp $-575 | +1.0pp $-666 |
UW: 25.0% down · 7.5% · 30yr · 1.5% tax · 5.0% vac · 8.0% maint · 8.0% mgmt
Financing live
Cash to close
- Down payment
- $86,250
- Closing costs
- $10,350
- Reserves months
- —
- Total cash needed
- —
Loan-product check · same deal, 3 products live
Conventional
25% down · 7.5% · 30yr
- Down + closing
- —
- Monthly P&I
- —
- Monthly cashflow
- —
- DSCR
- —
- Eligible?
- —
Personal DTI + credit; lowest rate.
DSCR
20% down · 8.5% · 30yr
- Down + closing
- —
- Monthly P&I
- —
- Monthly cashflow
- —
- DSCR
- —
- Eligible?
- —
No personal income docs; deal must DSCR.
Hard money
10% down · 12.0% · 12mo
- Down + closing
- —
- Monthly P&I
- —
- Monthly cashflow
- —
- DSCR
- —
- Eligible?
- —
Short-term bridge; refi at stabilization.
Rent comps 40 comps
| Address | Beds | Baths | Sqft | Rent | $/sqft | DOM | Units | Dist |
|---|---|---|---|---|---|---|---|---|
| 911 S D St Lake Worth Beach, FL | 2.0 | 2.0 | 1023 | $2,300 | $2.25 | 19d | 1 | 0.19mi |
| 911 S B St Lake Worth Beach, FL | 3.0 | 1.5 | 1140 | $2,800 | $2.46 | 25d | 1 | 0.26mi |
| 1015 S K St #1 Lake Worth, FL | 1.0 | 1.0 | 1160 | $1,850 | $1.59 | 19d | 1 | 0.35mi |
| 701 S G St Lake Worth, FL | 3.0 | 1.0 | 1000 | $2,995 | $3.00 | 25d | 1 | 0.36mi |
| 701 S G St Unit 5 Lake Worth Beach, FL | 3.0 | 1.0 | 1000 | $2,495 | $2.50 | 25d | 1 | 0.36mi |
| 701 S G St Unit 7 Lake Worth Beach, FL | 3.0 | 1.0 | 1000 | $2,680 | $2.68 | 25d | 1 | 0.36mi |
| 1420 Barton Rd Unit 1420w Lake Worth Beach, FL | 2.0 | 1.0 | 990 | $2,000 | $2.02 | 12d | 1 | 0.38mi |
| 905 S L St Lake Worth Beach, FL | 2.0 | 1.0 | 893 | $3,300 | $3.70 | 4d | 1 | 0.45mi |
| 644 S Ridge St Lake Worth Beach, FL | 2.0 | 1.0 | 1000 | $2,500 | $2.50 | 25d | 1 | 0.50mi |
| 517 S F St Unit 1 Lake Worth Beach, FL | 1.0 | 1.0 | 700 | $1,750 | $2.50 | 12d | 1 | 0.50mi |
| 1021 S N St Lake Worth Beach, FL | 3.0 | 3.0 | 1244 | $3,800 | $3.05 | 21d | 1 | 0.53mi |
| 507 S D St Bldg 2 Lake Worth Beach, FL | 3.0 | 2.0 | 1012 | $2,200 | $2.17 | 25d | 1 | 0.53mi |
| 1331 S Federal Hwy Lake Worth, FL | 2.0 | 2.0 | 1011 | $2,099 | $2.08 | 25d | 1 | 0.61mi |
| 1331 S Federal Hwy Lake Worth, FL | 2.0 | 2.0 | 1011 | $2,099 | $2.08 | 12d | 1 | 0.61mi |
| 727 S N St Lake Worth Beach, FL | 3.0 | 1.0 | 1017 | $3,000 | $2.95 | 25d | 1 | 0.61mi |
| 713 S N St Lake Worth Beach, FL | 2.0 | 2.0 | 1116 | $2,365 | $2.12 | 0d | 1 | 0.62mi |
| 928 S Federal Hwy Lake Worth, FL | 1.0 | 1.0 | 700 | $1,475 | $2.11 | 0d | 1 | 0.64mi |
| 419 S J St Unit C Lake Worth Beach, FL | 2.0 | 1.0 | 1200 | $1,295 | $1.08 | 15d | 1 | 0.66mi |
| 419 S J St Unit C Lake Worth Beach, FL | 2.0 | 1.0 | 1200 | $1,295 | $1.08 | 13d | 1 | 0.66mi |
| 405 6th Ave S #1 Lake Worth Beach, FL | 1.0 | 1.0 | 700 | $1,425 | $2.04 | 13d | 1 | 0.69mi |
| 835 Andrew Redding Rd #1 Lantana, FL | 2.0 | 2.0 | 875 | $2,800 | $3.20 | 25d | 1 | 0.71mi |
| 416 S L St Lake Worth, FL | 2.0 | 1.0 | 950 | $2,700 | $2.84 | 25d | 1 | 0.74mi |
| 414 S L St Lake Worth Beach, FL | 2.0 | 1.0 | 950 | $2,350 | $2.47 | 25d | 1 | 0.75mi |
| 327 S L St Lake Worth Beach, FL | 3.0 | 2.0 | 936 | $3,000 | $3.21 | 25d | 1 | 0.78mi |
| 318 S K St Unit 4 Lake Worth Beach, FL | 1.0 | 1.0 | 750 | $1,450 | $1.93 | 18d | 1 | 0.78mi |
| 206 S C St Lake Worth Beach, FL | 3.0 | 1.0 | 1000 | $2,500 | $2.50 | 25d | 1 | 0.79mi |
| 322 S L St Lake Worth, FL | 2.0 | 1.0 | 800 | $2,500 | $3.12 | 8d | 1 | 0.80mi |
| 314 S L St Lake Worth Beach, FL | 3.0 | 1.0 | 1094 | $3,000 | $2.74 | 13d | 1 | 0.82mi |
| 1502 S Lakeside Dr #302 Lake Worth Beach, FL | 1.0 | 1.0 | 700 | $1,200 | $1.71 | 19d | 1 | 0.82mi |
| 900 Water Tower Way Lantana, FL | 1.0–2.0 | 1.0–2.0 | 1176 | $3,541 | $3.01 | 0d | 20 | 0.83mi |
| 1516 S Lakeside Dr Lake Worth, FL | 1.0 | 1.5 | 767 | $1,650 | $2.15 | 15d | 2 | 0.84mi |
| 1001 Water Tower Way Hypoluxo, FL | 1.0–3.0 | 1.0–2.0 | 981 | $2,336 | $2.38 | 25d | 25 | 0.85mi |
| 1001 Water Tower Way Hypoluxo, FL | 1.0–3.0 | 1.0–2.0 | 981 | $2,368 | $2.41 | 0d | 23 | 0.85mi |
| 107 18th Ave S Lake Worth Beach, FL | 3.0 | 2.0 | 1286 | $3,000 | $2.33 | 25d | 1 | 0.86mi |
| 105 S D St Lake Worth Beach, FL | 3.0 | 2.0 | 1326 | $3,300 | $2.49 | 25d | 1 | 0.87mi |
| 105 S D St Lake Worth Beach, FL | 3.0 | 2.0 | 1326 | $3,150 | $2.38 | 12d | 1 | 0.87mi |
| 2566 South Dr Unit 306 Lake Worth Beach, FL | 1.0 | 1.0 | 744 | $1,850 | $2.49 | 8d | 1 | 0.88mi |
| 2640 South Dr Unit 301 Lake Worth Beach, FL | 2.0 | 1.0 | 894 | $1,500 | $1.68 | 16d | 1 | 0.88mi |
| 2640 South Dr Unit 301 Lake Worth Beach, FL | 2.0 | 1.0 | 894 | $1,500 | $1.68 | 19d | 1 | 0.88mi |
| 305 S Federal Hwy Apt 1 Lake Worth Beach, FL | 1.0 | 1.0 | 720 | $1,775 | $2.47 | 0d | 1 | 0.88mi |
Listing history 36 events
-
2026-06-21days on market $345,000 Active 120 DOM
-
2026-06-18days on market $345,000 Active 117 DOM
-
2026-06-17days on market $345,000 Active 116 DOM
-
2026-06-16days on market $345,000 Active 115 DOM
-
2026-06-15days on market $345,000 Active 114 DOM
-
2026-06-13days on market $345,000 Active 112 DOM
-
2026-06-09days on market $345,000 Active 108 DOM
-
2026-06-07days on market $345,000 Active 106 DOM
-
2026-06-04days on market $345,000 Active 103 DOM
-
2026-06-03days on market $345,000 Active 102 DOM
-
2026-06-01days on market $345,000 Active 100 DOM
-
2026-05-31days on market $345,000 Active 99 DOM
-
2026-03-06price $345,000
-
2026-02-21$325,000 Active
-
2018-01-04historical
-
2017-11-22status Active
-
2017-11-15historical Contingent
-
2017-07-14$189,000 Active
-
2016-10-17soldstatus $75,000 Closed 100-char remark
Show marketing remark (100 chars)
GREAT STATER HOME OR RENTAL PROPERTY. HOME LOCATED CLOSE SHOPPING CENTER AND EASY ACCESS TO COMMUTE.
-
2016-09-19status Pending 100-char remark
Show marketing remark (100 chars)
GREAT STATER HOME OR RENTAL PROPERTY. HOME LOCATED CLOSE SHOPPING CENTER AND EASY ACCESS TO COMMUTE.
-
2016-09-07price $79,900 100-char remark
Show marketing remark (100 chars)
GREAT STATER HOME OR RENTAL PROPERTY. HOME LOCATED CLOSE SHOPPING CENTER AND EASY ACCESS TO COMMUTE.
-
2016-09-07status Active 100-char remark
Show marketing remark (100 chars)
GREAT STATER HOME OR RENTAL PROPERTY. HOME LOCATED CLOSE SHOPPING CENTER AND EASY ACCESS TO COMMUTE.
-
2016-08-19status Pending 100-char remark
Show marketing remark (100 chars)
GREAT STATER HOME OR RENTAL PROPERTY. HOME LOCATED CLOSE SHOPPING CENTER AND EASY ACCESS TO COMMUTE.
-
2016-06-23$99,900 Active 100-char remark
Show marketing remark (100 chars)
GREAT STATER HOME OR RENTAL PROPERTY. HOME LOCATED CLOSE SHOPPING CENTER AND EASY ACCESS TO COMMUTE.
-
2016-06-08historical
-
2015-12-08$109,900 Active
-
2014-02-21soldstatus $50,000
-
2014-02-18soldstatus $50,000 Closed
-
2013-07-29status Pending
-
2012-11-20$54,900 Active
-
2001-10-22soldstatus $84,000
-
2001-08-04soldstatus $55,500
-
2001-07-16soldstatus $55,500
-
2001-07-01historical
-
2001-06-20$65,000
-
1997-10-06soldstatus $30,000
ⓘ Source: listings_history table (triggers on properties + properties_extension) + one-shot
backfill from property_details.listing_events for pre-trigger history.
Tax reassessment forecast FL · Resets to sale price
- Current annual tax
- $4,837 · $403/mo
- Projected year-2 tax
- $4,837 · $403/mo
- Expected delta
- $0/yr ($0/mo · 0.0%)
ⓘ Screening estimate from a state-policy table — verify with the county assessor before closing.
Climate risk First Street
- Flood 1/10 Low FEMA zone X (unshaded) · 0% chance over 30 yrs
- Wildfire 1/10 Low
- Heat 10/10 Extreme 7 d/yr ≥105°F today · 26 d/yr by 30 yrs out
- Wind 10/10 Extreme 99% chance of damaging wind over 30 yrs
- Air quality 2/10 Low 0 unhealthy d/yr today · 2 by 30 yrs out
Nearby sold comps map
Loading sold comps map…
Walkable amenities ~0.75 mi
Loading nearby amenities…
Taxation est. · year 1
- Rental income
- $28,415
- − Mortgage interest
- −$19,325
- − Property taxes
- −$4,837
- − Insurance
- −$1,725
- − Repairs & maintenance
- −$2,273
- − Management
- −$2,273
- − Depreciation
- −$10,036
- Taxable loss
- −$12,055
- Est. tax savings @ 24.0%
- +$2,893
- After-tax cash flow
- $-2,932/yr
For passive investors: Depreciation is non-cash, so a rental often shows a tax loss while cash-flowing — sheltering income. Rental losses are passive: they offset passive income freely, and up to $25,000/yr can offset ordinary (W-2) income if you actively participate and your MAGI is under $100k (phasing out to $0 by $150k); unused losses carry forward. On sale, claimed depreciation is recaptured at up to 25%, and gains may owe capital-gains tax (a 1031 exchange can defer both). Figures are a year-1 estimate at your 24.0% rate — not tax advice; consult a CPA.
Schools (NCES district)
- District
- Palm Beach
- NCES district ID
- 1201500
- Math proficiency
- 46% ▼ -16.00%
- Reading proficiency
- 53% ▼ -4.00%
- Median HH income
- $53,943
- Composite
- 42.72/100
- National rank
- #3160
- State rank
- #34 of 73 in FL
Livability — Lake Worth Beach
No livability data for this city. (Only ~50 U.S. cities are tracked.)
Census & demographics
- Census place
- Lake Worth Beach, FL
- County
- Palm Beach County · 1,438,312 people
- City population
- 129,577
- Metro
- Miami-Fort Lauderdale-Pompano Beach, FL
- Population (ZIP)
- 37,795
- Household income
- $62,090
- Rent vs Own
- Severe rent burden
- 2429.0
Population outlook (Palm Beach County) Hauer SSP2
- Today (2025)
- 1,637,487 people
- By 2030
- 1,743,255 · +6.5%
- By 2040
- 1,948,712 · +19.0%
- By 2050
- 2,132,979 · +30.3%
- By 2075
- 2,530,027 · +54.5%
- By 2100
- 2,706,979 · +65.3%
Race, ethnicity, and origin ACS 2023
- Neighborhood character
- Diverse neighborhood (Simpson 0.64)
- Race & ethnicity
- Hispanic / Latino 49% White 30% Two or more races 21% Black 17%
- Hispanic origin (detail)
- Mexican 5% Puerto Rican 5% Cuban 5% Dominican 2%
- Common ancestry
- Hispanic 8% Lithuanian 2% Slovak 1%
- Foreign-born
- 40% · Canada, Jamaica
- Languages at home
- 44% English-only · Spanish 42% French/Haitian/Cajun 9% Other Indo-European 2%
Political lean MEDSL · Palm Beach
- 2024 margin
- Toss-up / Even · D 50.0% · R 49.2%
- 2008→2024 swing
- -22.1pp toward R · 2008: 22.9pp · 2024: 0.8pp
- All cycles
- 2024: D+0.8 2020: D+12.8 2016: D+15.3 2012: D+17.0 2008: D+22.9
Not yet ingested
- Civics
- —
Market trends
- HPI YoY
- ▼ -345.65%
- Current HPI
- 484.2793
- Rent YoY
- ▲ 3.53%
- Metro
- Miami-Fort Lauderdale-Pompano Beach, FL
- State GDP YoY
- ▲ 3.28%
- F500 in state
- 36
Industry mix (Fortune 500 HQ in FL)
| Industry | F500 HQs | Revenue |
|---|---|---|
| Industrial Technology | 2 | $29B |
|
||
| Insurance | 2 | $17B |
|
||
| Retail | 1 | $60B |
|
||
| Technology Distribution | 1 | $58B |
|
||
| Homebuilding | 1 | $35B |
|
||
| Technology Manufacturing | 1 | $35B |
|
||
Price history
+1050.0% since first listed24 events — show timeline
- 2026-03-06 Price Changed $345,000 Beaches MLS
- 2026-02-21 Listed $325,000 Beaches MLS
- 2018-01-04 Listing Removed — Beaches MLS
- 2017-11-22 Relisted — Beaches MLS
- 2017-11-15 Contingent — Beaches MLS
- 2017-07-14 Listed $189,000 Beaches MLS
- 2016-10-17 Sold (MLS) $75,000 Beaches MLS
- 2016-09-19 Pending — Beaches MLS
- 2016-09-07 Price Changed $79,900 Beaches MLS
- 2016-09-07 Relisted — Beaches MLS
- 2016-08-19 Pending — Beaches MLS
- 2016-06-23 Listed $99,900 Beaches MLS
- 2016-06-08 Listing Removed — Beaches MLS
- 2015-12-08 Listed $109,900 Beaches MLS
- 2014-02-21 Sold (Public Records) $50,000 Public Records
- 2014-02-18 Sold (MLS) $50,000 Beaches MLS
- 2013-07-29 Pending — Beaches MLS
- 2012-11-20 Listed $54,900 Beaches MLS
- 2001-10-22 Sold (Public Records) $84,000 Public Records
- 2001-08-04 Sold (Public Records) $55,500 Public Records
- 2001-07-16 Sold (MLS) $55,500 Beaches MLS
- 2001-07-01 Listing Removed — Beaches MLS
- 2001-06-20 Listed $65,000 Beaches MLS
- 1997-10-06 Sold (Public Records) $30,000 Public Records
Property tax history
+16.3%/yrLatest (2025): $4,837 · +3.9% YoY. Source: county tax records.
Cash-flow waterfall
monthlySold comps — $/sqft
last 12 mo · ≤1 miLoading sold comps…