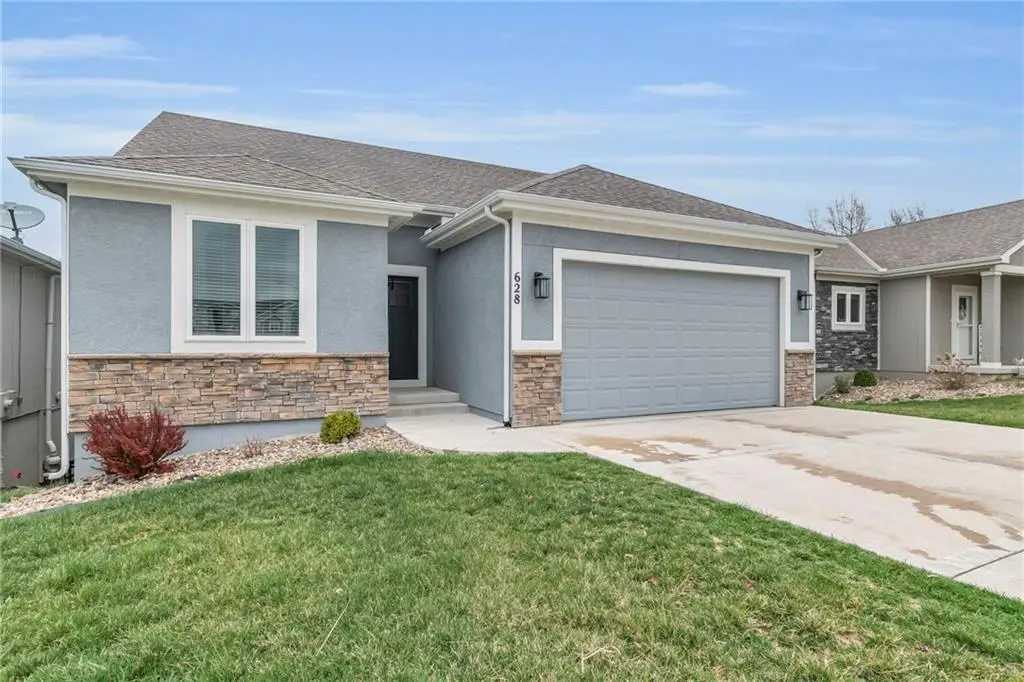
628 NW 110th St · Kansas City, MO
Flood risk 7/10 · Major
- FEMA flood zone
- X (unshaded)
- Chance of flooding over 30 yrs
- 0.77%
- Est. flood insurance / yr
- $507 – $1,088
Fire risk 3/10 · Minor
- Est. fire insurance / yr
- $1,054 – $1,958
Heat risk 4/10 · Minor
- Hot days now (above 107°F)
- 7 days/yr
- Hot days in 30 yrs
- 17 days/yr
Wind risk 2/10 · Minimal
- Chance of severe wind over 30 yrs
- —
Air-quality risk 2/10 · Minimal
- Unhealthy air days now
- 2 days/yr
- Unhealthy air days in 30 yrs
- 2 days/yr
Risk factors via First Street. Map © Google.
Why this score? — see what drove the C- grade
The composite is a weighted blend of 9 inputs, each scored 0–100. Each bar is that input's sub-score; the figure is the points it added to the 100-point composite (weight × sub-score).
- ARV discount +15.0/15.0
- Cash flow +12.6/30.0
- 1% rule +4.2/10.0
- Rent growth +4.2/5.0
- Condition / age +4.0/5.0
- Livability +3.9/5.0
- Schools +3.8/10.0
- DSCR +3.7/10.0
- Appreciation +0.0/10.0
$295,000
🖨 Deal sheet 📄 Offer letter ✓ Due diligence
Listing remarks MLS
* * This is a Short Sale * * Please Discuss with your agent prior to showing and have them review all available reports. Like New Reverse 1.5 story that backs to open space, open floor plan, beautiful kitchen with huge Island and built-in breakfast dining, huge great room with fireplace, spacious master suite with enormous walk-in closet. Finished lower level features a large rec room, outside you will find double decks overlooking treed open space.
Key facts
- 4,616 sq ft lot
- 2 garage spots
- Built 2022
Neighborhood map
What this means for you Summary
Snapshot
- This is a 3-bed/3.0-bath single-family listed at $295k. Condition is rated good.
Deal economics
- At list price, monthly cash flow is $-107 ($-1k/yr) — negative.
- To cash-flow at today's rent, offer at most $280k (5.2% below list).
- To meet the 1% rule (rent ≥ 1% of price), the offer needs to be $272k (7.8% below list).
- Recommended offer: $272k (7.8% below list) — sets the bar for 1% rule.
- Cap rate 6.1% vs local median 3.9% in Kansas City — top-decile yield for the area; either an underpriced asset or a hidden risk that comps aren't pricing in. Stress-test before assuming the spread holds.
Location & tenants
- Location reads 78/100 on livability (#28 in MO, #2,671 nationally) — a middle-class / working-renter tenant base. Strengths: amenities A+, commute A+, cost of living A+; Watch: schools C-, crime F.
- North Kansas City 74 (urban): math 38% / reading 49% proficiency, ranked #98 of 324 in MO (top 30%) — families likely to look elsewhere, expect single-tenant / working-renter base with shorter leases.
- Market conditions: Rents rising fast (+6.9%/yr); 248 active listings in the ZIP; 6 comparable units currently listed for rent nearby; rentals leasing fast (median 8d on market — plan ~1-2 weeks tenant-placement turnaround); solid renter incomes; 341 units permitted in Clay County in 2024 (40 in 5+ unit buildings).
- This rent runs 33% of the median local income ($97k/yr) — at the standard rent-burdened threshold; future hikes will face affordability resistance.
Forward outlook
- Local home prices are declining (-3.0%/yr); year-one equity from $2k of loan paydown is wiped out by about $9k of value loss. Plan a longer hold.
- Clay County population projected at +24% by 2050 — long-run rental-demand tailwind backs the buy-and-hold thesis.
Negotiation context
- It's been on market 74 days — a 6% lower offer ($277k) is reasonable based on typical stale-listing flexibility.
- 5 sale attempts since 4y ago; this cycle's ask has dropped $85k (22%) from the opening price — seller is motivated, your offer sets the floor, not the list.
Risks & watch-outs
- Watch-outs: flood insurance adds $66/mo.
- Climate carrying-cost: major flood risk — expect insurance premiums to compound above CPI over the hold.
Questions for the listing agent
- What do current leases actually rent for vs. the listed asking? Can we see a recent rent roll and the last 12 months of T-12 income?
- It's been on market 74 days. Have you received any prior offers? Is the seller open to a 8% concession, seller financing, or rate buy-down credit?
- What's the actual annual flood-insurance premium (NFIP or private), and is the property in a SFHA with mandatory coverage?
- What does the HOA fee cover, when was the last increase, and are there any pending special assessments or reserve-fund shortfalls?
- Why hasn't it sold? Are there any deal-killer items the seller is aware of (foundation, flood, title, zoning, code violations)?
- Is there a deadline driving the sale (1031 exchange, divorce, estate, relocation)? That informs how much negotiation room exists.
- Crime grade is F in this area — have there been break-ins, vandalism, or insurance claims at this property in the last 3 years? What carrier currently insures it and at what premium?
- What's the average days-on-market for RENTAL listings here right now (not sales)? A rising rental-DOM trend means longer vacancies and softer asking-rent achievability than the comps imply.
- What's the recent tenant-quality profile in this submarket — average credit score on applications, eviction rate, late-payment / NSF rate, and stable-employment percentage? A property-management company in the area should have these aggregated.
- How much new for-sale + rental construction is in the pipeline within 1–3 miles? Heavy new supply typically softens prices + rents 12–24 months out; constrained supply supports both.
Investment metrics
- 1% rule
- 0.92% ✗
- Cap rate
- 6.13%
- Cash-on-cash
- -0.58%
- DSCR
- 0.97
- GRM
- 9.0
CMA / ARV
- ARV (median comp)
- $434,139
- List price
- $295,000
- Delta
- -32.05%
- Verdict
- UNDERPRICED
- Comps
- 20 within 1.0 mi
Show comp detail 12 sales within ~0.75 mi
| Address | Dist | Beds/Ba | Sqft | Sold | Price | $/sf | Match |
|---|---|---|---|---|---|---|---|
| 519 NW 110th St | 0.06mi | 3/3.0 | 2,294 (-6%) | 2mo | $435,000 | $190 | 86 |
| 805 NW 109th Ter | 0.19mi | 3/2.5 | 2,487 (+2%) | 1mo | $385,000 | $155 | 84 |
| 11235 N Belleview Ave | 0.49mi | 4/3.0 (+1) | 2,405 (-1%) | 1mo | $415,000 | $173 | 70 |
| 11036 N Wyandotte St | 0.31mi | 4/2.5 (+1) | 2,223 (-8%) | 3mo | $385,000 | $173 | 62 |
| 11220 N Pennsylvania Ave | 0.45mi | 4/3.0 (+1) | 2,273 (-6%) | 2mo | $375,000 | $165 | 62 |
| 10611 N Holly St | 0.62mi | 4/3.0 (+1) | 2,525 (+4%) | 2mo | $590,000 | $234 | 58 |
| 11243 N Madison Ave | 0.52mi | 3/2.0 | 2,254 (-7%) | 3mo | $375,000 | $166 | 58 |
| 10509 N Mulberry St | 0.69mi | 4/3.5 (+1) | 2,471 (+2%) | 1mo | $559,900 | $227 | 57 |
| 11336 N Summit St | 0.66mi | 3/2.5 | 2,614 (+8%) | 1mo | $350,000 | $134 | 54 |
| 1016 NW 112th Ter | 0.48mi | 4/2.5 (+1) | 2,065 (-15%) | 1mo | $399,900 | $194 | 45 |
| 10427 N Mulberry St | 0.74mi | 4/3.5 (+1) | 2,686 (+11%) | 1mo | $670,000 | $249 | 40 |
| 11222 N Oak Trfy | 0.73mi | 4/3.5 (+1) | 2,067 (-15%) | 3mo | $379,900 | $184 | 32 |
Match score weights: distance 35% · size 25% · config 20% · recency 20%. Top-matched comps best support the ARV.
Projected returns pro-forma
-3.0% appreciation · 6.92% rent growth · sell at horizon
- IRR
- -14.0%
- Equity multiple
- 0.48×
- Total profit
- $-43,273
- Equity at exit
- $43,985
- IRR
- 0.6%
- Equity multiple
- 1.05×
- Total profit
- $3,881
- Equity at exit
- $25,506
Cash invested: $82,600 (down + closing). Projections, not guarantees.
Landlord ↔ Tenant lean methodology
- Overall (STATE)
- 81 Strongly Landlord-Friendly
- State Missouri
- 81 Strongly Landlord-Friendly · R+10
- County
- — inherits STATE
- City
- — inherits STATE
ZIP-level market 64155
- Rents YoY
- 6.9%
- Active inventory
- 248
- Price-to-rent
- 9.0×
Monthly cashflow live
- Estimated rent
- $2,720 high interval (Pro) →
- Mortgage (P&I)
- −$1,547
- Tax est. 1.5%
- −$369 /mo · $4,425/yr
- Insurance
- −$123
- Flood insurance flood zone
- −$66 /mo · $798/yr
- HOA
- −$150
- Vacancy / Maint / Mgmt
- −$571
- Net cashflow
- $-107
Break-even live
UW: 25.0% down · 7.5% · 30yr · 1.5% tax · 5.0% vac · 8.0% maint · 8.0% mgmt
Financing live
Cash to close
- Down payment
- $73,750
- Closing costs
- $8,850
- Reserves months
- —
- Total cash needed
- —
Loan-product check · same deal, 3 products live
Conventional
25% down · 7.5% · 30yr
- Down + closing
- —
- Monthly P&I
- —
- Monthly cashflow
- —
- DSCR
- —
- Eligible?
- —
Personal DTI + credit; lowest rate.
DSCR
20% down · 8.5% · 30yr
- Down + closing
- —
- Monthly P&I
- —
- Monthly cashflow
- —
- DSCR
- —
- Eligible?
- —
No personal income docs; deal must DSCR.
Hard money
10% down · 12.0% · 12mo
- Down + closing
- —
- Monthly P&I
- —
- Monthly cashflow
- —
- DSCR
- —
- Eligible?
- —
Short-term bridge; refi at stabilization.
Rent comps 6 comps
| Address | Beds | Baths | Sqft | Rent | $/sqft | DOM | Units | Dist |
|---|---|---|---|---|---|---|---|---|
| 522 NW 110th St Kansas City, MO | 3.0 | 3.0 | 2300 | $3,000 | $1.30 | 1d | 1 | 0.07mi |
| 1004 NW 113th St Kansas City, MO | 4.0 | 2.5 | 2544 | $3,000 | $1.18 | 1d | 1 | 0.55mi |
| 1304 NW 107th Ter Kansas City, MO | 4.0 | 3.5 | 2647 | $4,000 | $1.51 | 1d | 1 | 0.61mi |
| 804 NE Karapat Dr Kansas City, MO | 3.0 | 2.0 | 1584 | $2,131 | $1.35 | 21d | 1 | 0.94mi |
| 11032 N Harrison St Kansas City, MO | 4.0 | 2.5 | 1670 | $2,395 | $1.43 | 7d | 1 | 1.08mi |
| 912 NE 113th St Kansas City, MO | 3.0 | 2.0 | 1884 | $2,455 | $1.30 | 23d | 1 | 1.13mi |
HOA detail
- Monthly dues
- $150 · $1,800/yr
Listing history 18 events
-
2026-05-04status Pending 456-char remark
Show marketing remark (456 chars)
* * This is a Short Sale * * Please Discuss with your agent prior to showing and have them review all available reports. Like New Reverse 1.5 story that backs to open space, open floor plan, beautiful kitchen with huge Island and built-in breakfast dining, huge great room with fireplace, spacious master suite with enormous walk-in closet. Finished lower level features a large rec room, outside you will find double decks overlooking treed open space.
-
2026-04-11price $295,000 456-char remark
Show marketing remark (456 chars)
* * This is a Short Sale * * Please Discuss with your agent prior to showing and have them review all available reports. Like New Reverse 1.5 story that backs to open space, open floor plan, beautiful kitchen with huge Island and built-in breakfast dining, huge great room with fireplace, spacious master suite with enormous walk-in closet. Finished lower level features a large rec room, outside you will find double decks overlooking treed open space.
-
2026-02-19$380,000 Active 456-char remark
Show marketing remark (456 chars)
* * This is a Short Sale * * Please Discuss with your agent prior to showing and have them review all available reports. Like New Reverse 1.5 story that backs to open space, open floor plan, beautiful kitchen with huge Island and built-in breakfast dining, huge great room with fireplace, spacious master suite with enormous walk-in closet. Finished lower level features a large rec room, outside you will find double decks overlooking treed open space.
-
2026-02-17historical $380,000 456-char remark
Show marketing remark (456 chars)
* * This is a Short Sale * * Please Discuss with your agent prior to showing and have them review all available reports. Like New Reverse 1.5 story that backs to open space, open floor plan, beautiful kitchen with huge Island and built-in breakfast dining, huge great room with fireplace, spacious master suite with enormous walk-in closet. Finished lower level features a large rec room, outside you will find double decks overlooking treed open space.
-
2025-07-26historical
-
2025-07-06price $439,000
-
2025-03-31$455,000 Active
-
2024-08-27historical
-
2024-05-03price $455,000
-
2024-03-13price $458,000
-
2024-02-27$464,900 Active
-
2023-11-22historical
-
2023-11-03price $475,000
-
2023-05-23price $480,000
-
2023-05-09price $510,000
-
2023-05-04$520,000 Active
-
2022-10-27historical
-
2022-09-13$489,900 Active
ⓘ Source: listings_history table (triggers on properties + properties_extension) + one-shot
backfill from property_details.listing_events for pre-trigger history.
Climate risk First Street
- Flood 7/10 Severe FEMA zone X (unshaded) · 77% chance over 30 yrs
- Wildfire 3/10 Moderate
- Heat 4/10 Moderate 7 d/yr ≥107°F today · 17 d/yr by 30 yrs out
- Wind 2/10 Low
- Air quality 2/10 Low 2 unhealthy d/yr today · 2 by 30 yrs out
Nearby sold comps map
Loading sold comps map…
Walkable amenities ~0.75 mi
Loading nearby amenities…
Taxation est. · year 1
- Rental income
- $32,635
- − Mortgage interest
- −$16,525
- − Property taxes
- −$4,425
- − Insurance
- −$2,272
- − Repairs & maintenance
- −$2,611
- − Management
- −$2,611
- − HOA
- −$1,800
- − Depreciation
- −$8,582
- Taxable loss
- −$6,190
- Est. tax savings @ 24.0%
- +$1,486
- After-tax cash flow
- $206/yr
For passive investors: Depreciation is non-cash, so a rental often shows a tax loss while cash-flowing — sheltering income. Rental losses are passive: they offset passive income freely, and up to $25,000/yr can offset ordinary (W-2) income if you actively participate and your MAGI is under $100k (phasing out to $0 by $150k); unused losses carry forward. On sale, claimed depreciation is recaptured at up to 25%, and gains may owe capital-gains tax (a 1031 exchange can defer both). Figures are a year-1 estimate at your 24.0% rate — not tax advice; consult a CPA.
Condition & rehab AI · 12 photos
This home is in good condition with a good condition score of 80. It is move-in ready with minimal repairs and maintenance needed. The home has a good curb appeal and interior aesthetics, making it a good investment for both resale and rental.
Value-add opportunities
- Both Painting — Fresh paint can enhance curb appeal and interior aesthetics
- Both Landscaping — Enhances curb appeal and can increase property value
- Both Lighting — Modern lighting fixtures can improve the home's curb appeal and functionality
- Both Flooring — Updating flooring can improve the home's overall appearance and functionality
Renovation cost estimate screening
Value-add ROI direction
- Both Painting — Fresh paint can enhance curb appeal and interior aesthetics ↑
- Both Landscaping — Enhances curb appeal and can increase property value ↑
- Both Lighting — Modern lighting fixtures can improve the home's curb appeal and functionality ↑
- Both Flooring — Updating flooring can improve the home's overall appearance and functionality ↑
ⓘ Cost ranges are severity-bucket heuristics (US national rule-of-thumb). Get contractor quotes + a written scope before underwriting a rehab budget.
Schools (NCES district)
- District
- North Kansas City 74
- NCES district ID
- 2922800
- Math proficiency
- 38% ▼ -11.00%
- Reading proficiency
- 49% ▼ -3.00%
- Median HH income
- $55,444
- Composite
- 37.88/100
- National rank
- #4321
- State rank
- #98 of 324 in MO
Livability — Kansas City
- Score
- 78/100
- State rank
- #28
- US rank
- #2671
Category grades
Schools grade is shown separately in the Schools card above.
Census & demographics
- Census place
- Kansas City, MO
- County
- Clay County · 220,651 people
- City population
- 439,467
- Metro
- Kansas City, MO-KS
- Population (ZIP)
- 28,824
- Household income
- $97,471
- Rent vs Own
- Severe rent burden
- 635.0
Population outlook (Clay County) Hauer SSP2
- Today (2025)
- 266,022 people
- By 2030
- 280,057 · +5.3%
- By 2040
- 306,153 · +15.1%
- By 2050
- 328,630 · +23.5%
- By 2075
- 375,182 · +41.0%
- By 2100
- 392,861 · +47.7%
Race, ethnicity, and origin ACS 2023
- Neighborhood character
- Predominantly White (75%)
- Race & ethnicity
- White 75% Hispanic / Latino 10% Black 8% Two or more races 8% Asian 2%
- Hispanic origin (detail)
- Mexican 6%
- Common ancestry
- Italian 4% Lithuanian 3% Iranian 2%
- Foreign-born
- 6% · Canada, Vietnam
- Languages at home
- 93% English-only · Spanish 3% Vietnamese 1% Other Indo-European 1%
Political lean MEDSL · Clay
- 2024 margin
- Lean R (+5.6) · D 46.4% · R 52.0% · Other 1.6%
- 2008→2024 swing
- -4.9pp toward R · 2008: -0.7pp · 2024: -5.6pp
- All cycles
- 2024: R+5.6 2020: R+4.1 2016: R+11.1 2012: R+8.4 2008: R+0.7
Not yet ingested
- Civics
- —
Market trends
- HPI YoY
- ▼ -234.09%
- Current HPI
- 219.9706
- Rent YoY
- ▲ 6.92%
- Metro
- Kansas City, MO-KS
- State GDP YoY
- ▲ 1.84%
- F500 in state
- 20
Industry mix (Fortune 500 HQ in MO)
| Industry | F500 HQs | Revenue |
|---|---|---|
| Healthcare | 1 | $163B |
|
||
| Insurance | 1 | $21B |
|
||
| Industrial Technology | 1 | $17B |
|
||
| Retail | 1 | $16B |
|
||
| Industrial Distribution | 1 | $10B |
|
||
| Utilities | 1 | $9B |
|
||
Price history
-39.8% since first listed18 events — show timeline
- 2026-05-04 Pending — Heartland MLS as Distributed by MLS Grid
- 2026-04-11 Price Changed $295,000 Heartland MLS as Distributed by MLS Grid
- 2026-02-19 Listed $380,000 Heartland MLS as Distributed by MLS Grid
- 2026-02-17 Coming Soon $380,000 Heartland MLS as Distributed by MLS Grid
- 2025-07-26 Listing Removed — Heartland MLS as Distributed by MLS Grid
- 2025-07-06 Price Changed $439,000 Heartland MLS as Distributed by MLS Grid
- 2025-03-31 Listed $455,000 Heartland MLS as Distributed by MLS Grid
- 2024-08-27 Listing Removed — Heartland MLS as Distributed by MLS Grid
- 2024-05-03 Price Changed $455,000 Heartland MLS as Distributed by MLS Grid
- 2024-03-13 Price Changed $458,000 Heartland MLS as Distributed by MLS Grid
- 2024-02-27 Listed $464,900 Heartland MLS as Distributed by MLS Grid
- 2023-11-22 Listing Removed — Heartland MLS as Distributed by MLS Grid
- 2023-11-03 Price Changed $475,000 Heartland MLS as Distributed by MLS Grid
- 2023-05-23 Price Changed $480,000 Heartland MLS as Distributed by MLS Grid
- 2023-05-09 Price Changed $510,000 Heartland MLS as Distributed by MLS Grid
- 2023-05-04 Listed $520,000 Heartland MLS as Distributed by MLS Grid
- 2022-10-27 Listing Removed — Heartland MLS as Distributed by MLS Grid
- 2022-09-13 Listed $489,900 Heartland MLS as Distributed by MLS Grid
Cash-flow waterfall
monthlySold comps — $/sqft
last 12 mo · ≤1 miLoading sold comps…