521 Azalea Rd · Wylie, TX
Flood risk 1/10 · Minimal
- FEMA flood zone
- X (unshaded)
- Chance of flooding over 30 yrs
- 0.0%
- Est. flood insurance / yr
- $507 – $1,088
Fire risk 3/10 · Minor
- Est. fire insurance / yr
- $1,222 – $2,270
Heat risk 7/10 · Major
- Hot days now (above 110°F)
- 7 days/yr
- Hot days in 30 yrs
- 23 days/yr
Wind risk 6/10 · Moderate
- Chance of severe wind over 30 yrs
- 27.0%
Air-quality risk 3/10 · Minor
- Unhealthy air days now
- 3 days/yr
- Unhealthy air days in 30 yrs
- 3 days/yr
Risk factors via First Street. Map © Google.
Why this score? — see what drove the D- grade
The composite is a weighted blend of 9 inputs, each scored 0–100. Each bar is that input's sub-score; the figure is the points it added to the 100-point composite (weight × sub-score).
- Cash flow +11.2/30.0
- ARV discount +10.3/15.0
- Schools +4.2/10.0
- 1% rule +3.5/10.0
- Livability +3.5/5.0
- DSCR +3.3/10.0
- Rent growth +2.2/5.0
- Condition / age +1.0/5.0
- Appreciation +0.0/10.0
$238,990
🖨 Deal sheet 📄 Offer letter ✓ Due diligence
Listing remarks
New homes in Princeton, TX! Welcome to Arbor Trails! This gorgeous new Express homes community is located in Collin County, Branch , Princeton area off CR 437. DR Horton, your new home builder, we offer 3 different plans in Arbor Trails ranging from a 2 2.5 1 1,130 sq ft to a 4 2.5 1 that's 1,549 sq ft.
Key facts
- 3,572 sq ft lot
- Garage
- Built 2026
Property features AI
Finance
- Other: Listing status: Active; Inventory type: Spec; Last modified: 2026-05-28
- Financial info: List price $238,990
Exterior
- Parking: 1 garage space (1 total parking space)
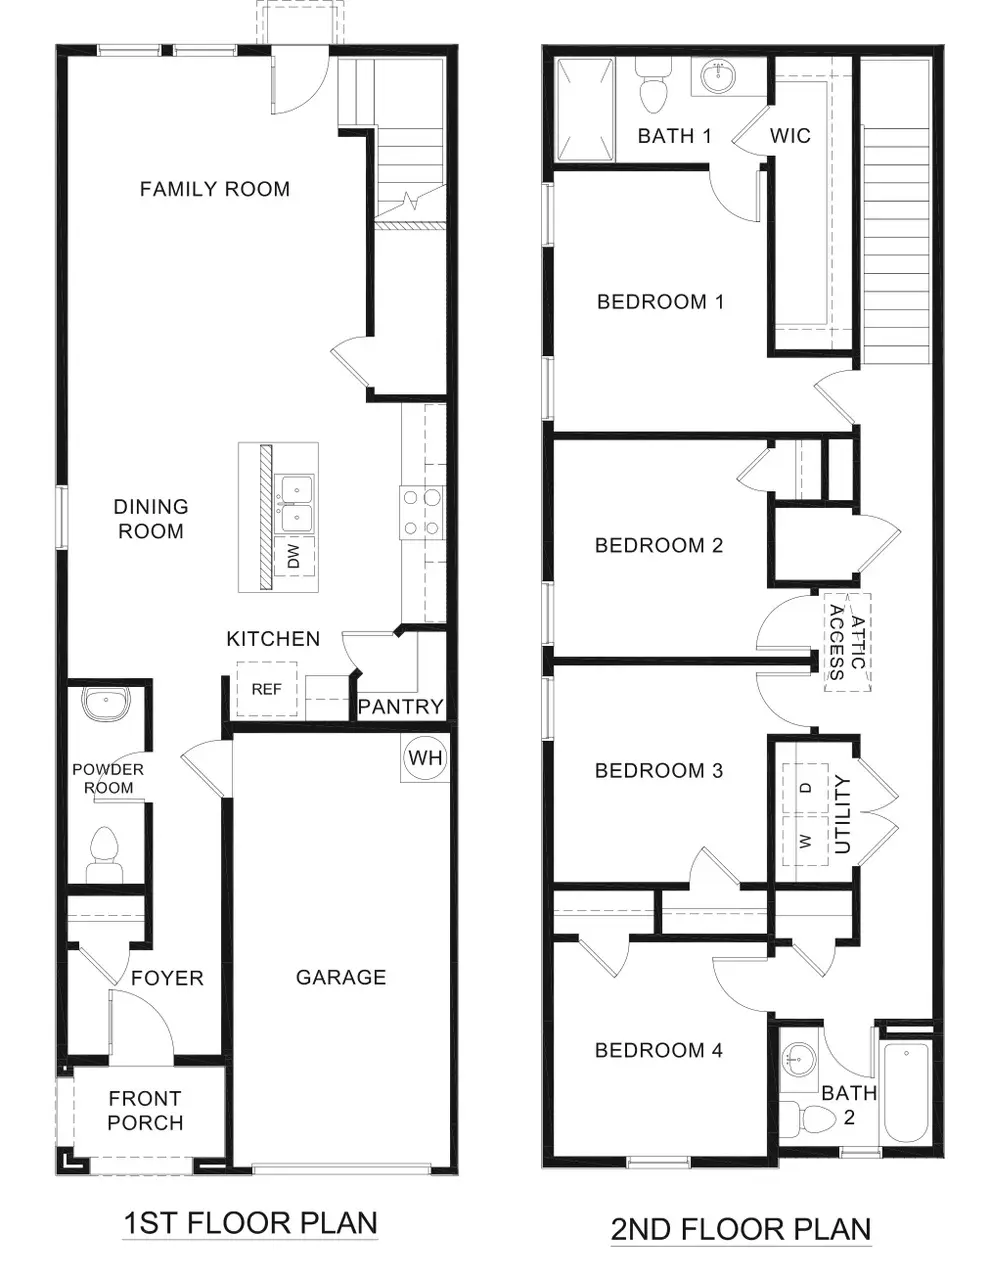
- Home design: Single-family residence, Denise plan
- Exterior features: Address: 521 Azalea Rd, Princeton, TX 75407
Interior
- Bedrooms: 4 bedrooms
- Bathrooms: 2 full bathrooms and 1 half bathroom (2.5 total)
- Interior features: Spec home (Denise plan); Living area of 1,602
Neighborhood map
What this means for you Summary
Snapshot
- This is a 4-bed/2.5-bath single-family listed at $239k. Condition is rated poor.
Deal economics
- At list price, monthly cash flow is $-92 ($-1k/yr) — negative.
- To cash-flow at today's rent, offer at most $226k (5.6% below list).
- To meet the 1% rule (rent ≥ 1% of price), the offer needs to be $203k (15.2% below list).
- Recommended offer: $203k (15.2% below list) — sets the bar for 1% rule.
- Cap rate 5.8% vs local median 4.0% in Wylie — top-decile yield for the area; either an underpriced asset or a hidden risk that comps aren't pricing in. Stress-test before assuming the spread holds.
Location & tenants
- Location reads 69/100 on livability (#419 in TX) — a middle-class / working-renter tenant base. Strengths: crime A+, employment A+, housing A+; Watch: amenities F, commute F, health & safety F.
- Princeton ISD (suburban): math 51% / reading 47% proficiency, ranked #188 of 826 in TX (top 23%) — families likely to look elsewhere, expect single-tenant / working-renter base with shorter leases.
- Market conditions: Rents soft (-1.0%/yr); 1404 active listings in the ZIP; 40 comparable units currently listed for rent nearby; rentals at typical pace (median 25d on market — plan ~3-4 weeks tenant-placement turnaround); solid renter incomes; 19,194 units permitted in Collin County in 2024 (3,988 in 5+ unit buildings).
Forward outlook
- Local home prices are declining (-3.0%/yr); year-one equity from $2k of loan paydown is wiped out by about $7k of value loss. Plan a longer hold.
- Collin County population projected at +60% by 2050 — long-run rental-demand tailwind backs the buy-and-hold thesis.
Negotiation context
- It's been on market 20 days — a 2% lower offer ($235k) is reasonable based on typical stale-listing flexibility.
Risks & watch-outs
- Climate carrying-cost: major wind risk, 27% chance of damaging wind over 30y; extreme-heat days projected 7→23/yr by 2055 (HVAC capex compounding) — expect insurance premiums to compound above CPI over the hold.
Questions for the listing agent
- What do current leases actually rent for vs. the listed asking? Can we see a recent rent roll and the last 12 months of T-12 income?
- Have any recent inspections been done? Can we get a copy of the seller's disclosures and any deferred-maintenance estimates?
- What does the HOA fee cover, when was the last increase, and are there any pending special assessments or reserve-fund shortfalls?
- Is there a deadline driving the sale (1031 exchange, divorce, estate, relocation)? That informs how much negotiation room exists.
- Schools are B-rated — typically a magnet for longer-tenancy family renters. What's the average tenant stay here, and is there a school-zone premium baked into asking?
- The area grade is low — what's the realistic commute time and amenity access for the typical tenant pool here? Any planned neighborhood developments (good or bad) we should know about?
- What's the average days-on-market for RENTAL listings here right now (not sales)? A rising rental-DOM trend means longer vacancies and softer asking-rent achievability than the comps imply.
- What's the recent tenant-quality profile in this submarket — average credit score on applications, eviction rate, late-payment / NSF rate, and stable-employment percentage? A property-management company in the area should have these aggregated.
- How much new for-sale + rental construction is in the pipeline within 1–3 miles? Heavy new supply typically softens prices + rents 12–24 months out; constrained supply supports both.
Investment metrics
- 1% rule
- 0.85% ✗
- Cap rate
- 5.83%
- Cash-on-cash
- -1.64%
- DSCR
- 0.93
- GRM
- 9.8
CMA / ARV
- ARV (on-the-fly)
- $254,718
- Comps found
- 12
Show comp detail 12 sales within ~0.75 mi
| Address | Dist | Beds/Ba | Sqft | Sold | Price | $/sf | Match |
|---|---|---|---|---|---|---|---|
| 6314 Sandpiper Ln | 0.16mi | 4/2.5 | 1,535 (-4%) | 0mo | $207,999 | $136 | 85 |
| 721 Wagtail Dr | 0.21mi | 4/2.5 | 1,535 (-4%) | 1mo | $209,999 | $137 | 82 |
| 6100 Pinion Trl | 0.30mi | 4/2.5 | 1,549 (-3%) | 1mo | $237,490 | $153 | 80 |
| 810 Wagtail Dr | 0.28mi | 4/2.5 | 1,535 (-4%) | 1mo | $238,369 | $155 | 79 |
| 6412 Longspur Ln | 0.13mi | 3/2.0 (-1) | 1,402 (-12%) | 0mo | $222,999 | $159 | 66 |
| 416 Sandhill Crane Ln | 0.15mi | 3/2.0 (-1) | 1,402 (-12%) | 0mo | $221,999 | $158 | 65 |
| 6413 Longspur Ln | 0.15mi | 3/2.0 (-1) | 1,411 (-12%) | 1mo | $215,000 | $152 | 65 |
| 6735 Welsh Dr | 0.51mi | 3/2.0 (-1) | 1,640 (+2%) | 2mo | $264,999 | $162 | 64 |
| 6414 Willet Rd | 0.18mi | 3/2.0 (-1) | 1,402 (-12%) | 1mo | $252,999 | $180 | 63 |
| 6110 Pinion Trl | 0.30mi | 3/2.5 (-1) | 1,419 (-11%) | 1mo | $229,990 | $162 | 61 |
| 6508 Glade St | 0.22mi | 3/2.0 (-1) | 1,402 (-12%) | 1mo | $222,999 | $159 | 61 |
| 403 Shearwater Ave | 0.25mi | 3/2.0 (-1) | 1,402 (-12%) | 1mo | $253,674 | $181 | 60 |
Match score weights: distance 35% · size 25% · config 20% · recency 20%. Top-matched comps best support the ARV.
Projected returns pro-forma
-3.0% appreciation · 0.0% rent growth · sell at horizon
- IRR
- -22.5%
- Equity multiple
- 0.25×
- Total profit
- $-50,452
- Equity at exit
- $35,634
- IRR
- -27.2%
- Equity multiple
- -0.11×
- Total profit
- $-74,188
- Equity at exit
- $20,663
Cash invested: $66,917 (down + closing). Projections, not guarantees.
Landlord ↔ Tenant lean methodology
- Overall (STATE)
- 87 Strongly Landlord-Friendly
- State Texas
- 87 Strongly Landlord-Friendly · R+5
- County
- — inherits STATE
- City
- — inherits STATE
ZIP-level market 75407
- Home prices YoY
- -30.3%
- Rents YoY
- -1.0%
- Active inventory
- 1404
- Price-to-rent
- 9.8×
Monthly cashflow live
- Estimated rent
- $2,028 high interval (Pro) →
- Mortgage (P&I)
- −$1,253
- Tax est. 1.5%
- −$299 /mo · $3,585/yr
- Insurance
- −$100
- HOA
- −$42
- Vacancy / Maint / Mgmt
- −$426
- Net cashflow
- $-92
Break-even live
UW: 25.0% down · 7.5% · 30yr · 1.5% tax · 5.0% vac · 8.0% maint · 8.0% mgmt
Financing live
Cash to close
- Down payment
- $59,748
- Closing costs
- $7,170
- Reserves months
- —
- Total cash needed
- —
Loan-product check · same deal, 3 products live
Conventional
25% down · 7.5% · 30yr
- Down + closing
- —
- Monthly P&I
- —
- Monthly cashflow
- —
- DSCR
- —
- Eligible?
- —
Personal DTI + credit; lowest rate.
DSCR
20% down · 8.5% · 30yr
- Down + closing
- —
- Monthly P&I
- —
- Monthly cashflow
- —
- DSCR
- —
- Eligible?
- —
No personal income docs; deal must DSCR.
Hard money
10% down · 12.0% · 12mo
- Down + closing
- —
- Monthly P&I
- —
- Monthly cashflow
- —
- DSCR
- —
- Eligible?
- —
Short-term bridge; refi at stabilization.
Rent comps 40 comps
| Address | Beds | Baths | Sqft | Rent | $/sqft | DOM | Units | Dist |
|---|---|---|---|---|---|---|---|---|
| 600 Sandhill Crane Ln Princeton, TX | 3.0 | 2.0 | 1402 | $2,100 | $1.50 | 13d | 1 | 0.09mi |
| 6222 Sandpiper Ln Unit NA Princeton, TX | 3.0 | 2.5 | 1400 | $1,750 | $1.25 | 7d | 1 | 0.13mi |
| 6310 Sandpiper Ln Princeton, TX | 4.0 | 2.5 | 1549 | $2,030 | $1.31 | 11d | 1 | 0.14mi |
| 6311 Whimbrel Way Princeton, TX | 4.0 | 2.5 | 1535 | $1,795 | $1.17 | 10d | 1 | 0.16mi |
| 721 Wagtail Dr Princeton, TX | 4.0 | 2.5 | 1535 | $1,600 | $1.04 | 24d | 1 | 0.19mi |
| 623 Linden Rd Princeton, TX | 3.0 | 2.5 | 1419 | $1,650 | $1.16 | 44d | 1 | 0.20mi |
| 724 Wagtail Dr Princeton, TX | 3.0 | 2.5 | 1360 | $1,675 | $1.23 | 3d | 1 | 0.20mi |
| 724 Wagtail Dr Princeton, TX | 3.0 | 2.5 | 1360 | $1,675 | $1.23 | 2d | 1 | 0.20mi |
| 732 Sandhill Crane Ln Princeton, TX | 4.0 | 2.5 | 1570 | $1,875 | $1.19 | 11d | 1 | 0.20mi |
| 6505 Glade St Princeton, TX | 4.0 | 2.0 | 1600 | $1,800 | $1.12 | 44d | 1 | 0.23mi |
| 801 Wagtail Dr , TX | 4.0 | 2.5 | 1535 | $1,975 | $1.29 | 7d | 1 | 0.25mi |
| 803 Wagtail Dr , TX | 3.0 | 2.5 | 1360 | $1,605 | $1.18 | 22d | 1 | 0.25mi |
| 812 Sandhill Crane Ln Princeton, TX | 3.0 | 2.5 | 1309 | $1,850 | $1.41 | 44d | 1 | 0.26mi |
| 6018 Primrose Rd , TX | 3.0–4.0 | 2.5 | 1484 | $1,875 | $1.26 | 3d | 5 | 0.27mi |
| 6102 Pinion Trl , TX | 3.0 | 2.5 | 1419 | $1,600 | $1.13 | 44d | 1 | 0.27mi |
| 6015 Pinion Trl , TX | 4.0 | 2.5 | 1615 | $1,950 | $1.21 | 44d | 1 | 0.28mi |
| 427 Bower DR Princeton, TX | 4.0 | 2.0 | 1600 | $1,850 | $1.16 | 24d | 1 | 0.29mi |
| 6225 Kingfisher Way Princeton, TX | 3.0 | 2.5 | 1290 | $1,625 | $1.26 | 4d | 1 | 0.30mi |
| 416 Finch CIR Princeton, TX | 3.0 | 2.0 | 1266 | $1,350 | $1.07 | 44d | 1 | 0.31mi |
| 6313 Kingfisher Way Princeton, TX | 3.0 | 3.0 | 1360 | $1,650 | $1.21 | 44d | 1 | 0.31mi |
| 904 Sandhill Crane Ln Princeton, TX | 4.0 | 2.5 | 1600 | $1,750 | $1.09 | 44d | 1 | 0.33mi |
| 905 Blue Heron Dr Princeton, TX | 4.0 | 2.5 | 1535 | $1,775 | $1.16 | 24d | 1 | 0.33mi |
| 905 Blue Heron Dr Princeton, TX | 4.0 | 2.5 | 1535 | $1,775 | $1.16 | 22d | 1 | 0.33mi |
| 914 Sandhill Crane Ln Princeton, TX | 3.0 | 2.5 | 1189 | $1,775 | $1.49 | 7d | 1 | 0.34mi |
| 911 Sandhill Crane Ln Princeton, TX | 3.0 | 2.5 | 1360 | $1,575 | $1.16 | 44d | 1 | 0.34mi |
| 241 Boxberry Way Princeton, TX | 3.0 | 2.0 | 1411 | $1,725 | $1.22 | 44d | 1 | 0.35mi |
| 402 Harvest St Princeton, TX | 3.0 | 2.0 | 1433 | $1,665 | $1.16 | 13d | 1 | 0.36mi |
| 935 Sandhill Crane Ln Princeton, TX | 3.0 | 2.5 | 1189 | $1,999 | $1.68 | 19d | 1 | 0.36mi |
| 613 Holleman Dr , TX | 3.0 | 2.0 | 1260 | $2,000 | $1.59 | 24d | 1 | 0.37mi |
| 545 Holleman Dr Princeton, TX | 3.0 | 2.0 | 1474 | $1,750 | $1.19 | 44d | 1 | 0.37mi |
| 919 Blue Heron Dr Princeton, TX | 4.0 | 2.5 | 1535 | $1,775 | $1.16 | 44d | 1 | 0.37mi |
| 919 Blue Heron Dr Princeton, TX | 4.0 | 2.5 | 1535 | $1,700 | $1.11 | 17d | 1 | 0.37mi |
| 926 Wood Stork Way Princeton, TX | 3.0 | 2.5 | 1285 | $1,700 | $1.32 | 24d | 1 | 0.39mi |
| 538 Montclair Ave Princeton, TX | 3.0 | 2.0 | 1260 | $1,775 | $1.41 | 10d | 1 | 0.40mi |
| 6234 Sanderling St Princeton, TX | 4.0 | 2.5 | 1535 | $1,725 | $1.12 | 44d | 1 | 0.43mi |
| 214 Wheatgrass Ln Princeton, TX | 3.0 | 2.0 | 1407 | $1,699 | $1.21 | 44d | 1 | 0.43mi |
| 639 Montclair Ave , TX | 4.0 | 2.0 | 1707 | $2,100 | $1.23 | 44d | 1 | 0.43mi |
| 639 Montclair Ave , TX | 4.0 | 2.0 | 1707 | $1,850 | $1.08 | 7d | 1 | 0.43mi |
| 134 Harvest St Princeton, TX | 3.0 | 2.0 | 1440 | $1,825 | $1.27 | 19d | 1 | 0.45mi |
| 656 Waymaker Way Princeton, TX | 4.0 | 3.0 | 2015 | $2,175 | $1.08 | 11d | 1 | 0.47mi |
HOA detail
- Monthly dues
- $42 · $504/yr
Listing history 14 events
-
2026-06-18days on market $238,990 Active 20 DOM
-
2026-06-17days on market $238,990 Active 19 DOM
-
2026-06-16days on market $238,990 Active 18 DOM
-
2026-06-15days on market $238,990 Active 17 DOM
-
2026-06-13days on market $238,990 Active 15 DOM
-
2026-06-13days on market $238,990 Active 14 DOM
-
2026-06-09days on market $238,990 Active 11 DOM
-
2026-06-08days on market $238,990 Active 10 DOM
-
2026-06-07days on market $238,990 Active 9 DOM
-
2026-06-04days on market $238,990 Active 6 DOM
-
2026-06-03days on market $238,990 Active 5 DOM
-
2026-06-02days on market $238,990 Active 4 DOM
-
2026-06-01days on market $238,990 Active 3 DOM
-
2026-05-31days on market $238,990 Active 2 DOM
ⓘ Source: listings_history table (triggers on properties + properties_extension) + one-shot
backfill from property_details.listing_events for pre-trigger history.
Climate risk First Street
- Flood 1/10 Low FEMA zone X (unshaded) · 0% chance over 30 yrs
- Wildfire 3/10 Moderate
- Heat 7/10 Severe 7 d/yr ≥110°F today · 23 d/yr by 30 yrs out
- Wind 6/10 Major 27% chance of damaging wind over 30 yrs
- Air quality 3/10 Moderate 3 unhealthy d/yr today · 3 by 30 yrs out
Nearby sold comps map
Loading sold comps map…
Walkable amenities ~0.75 mi
Loading nearby amenities…
Taxation est. · year 1
- Rental income
- $24,333
- − Mortgage interest
- −$13,387
- − Property taxes
- −$3,585
- − Insurance
- −$1,195
- − Repairs & maintenance
- −$1,947
- − Management
- −$1,947
- − HOA
- −$504
- − Depreciation
- −$6,952
- Taxable loss
- −$5,184
- Est. tax savings @ 24.0%
- +$1,244
- After-tax cash flow
- $144/yr
For passive investors: Depreciation is non-cash, so a rental often shows a tax loss while cash-flowing — sheltering income. Rental losses are passive: they offset passive income freely, and up to $25,000/yr can offset ordinary (W-2) income if you actively participate and your MAGI is under $100k (phasing out to $0 by $150k); unused losses carry forward. On sale, claimed depreciation is recaptured at up to 25%, and gains may owe capital-gains tax (a 1031 exchange can defer both). Figures are a year-1 estimate at your 24.0% rate — not tax advice; consult a CPA.
Condition & rehab AI · 0 photos
This home requires extensive repairs and renovations to bring it up to current standards, significantly increasing its resale and rental value.
Repairs flagged
- Major Kitchen cabinets — The cabinets are visibly damaged and need replacement.
- Major Bathroom fixtures — The fixtures are outdated and need to be replaced.
- Major Roof — The roof shows significant damage and needs replacement.
- Major Exterior siding — The siding is peeling and needs repainting or replacement.
- Major Flooring — The flooring is worn and needs replacement.
- Major Interior walls — The walls show significant damage and need painting or repair.
- Major HVAC system — The HVAC system appears old and may need replacement.
Value-add opportunities
- Resale Kitchen renovation — A new kitchen will attract more buyers and increase the home's value.
- Resale Bathroom renovation — Upgraded bathrooms will appeal to potential buyers and increase the home's value.
- Resale Roof replacement — A new roof will improve the home's curb appeal and increase its value.
- Resale Exterior siding repair — A fresh coat of paint and new siding will enhance the home's appearance and value.
- Resale Flooring replacement — New flooring will make the home more attractive and increase its value.
- Resale Interior wall repair and painting — Fresh paint and repairs will improve the home's condition and increase its value.
- Resale HVAC system replacement — A new HVAC system will improve the home's comfort and energy efficiency, increasing its value.
Renovation cost estimate screening
| Repair item | Severity | Est. cost |
|---|---|---|
| Kitchen cabinets · The cabinets are visibly damaged and need replacement. | Major | $15,000–50,000 |
| Bathroom fixtures · The fixtures are outdated and need to be replaced. | Major | $15,000–50,000 |
| Roof · The roof shows significant damage and needs replacement. | Major | $15,000–50,000 |
| Exterior siding · The siding is peeling and needs repainting or replacement. | Major | $15,000–50,000 |
| Flooring · The flooring is worn and needs replacement. | Major | $15,000–50,000 |
| Interior walls · The walls show significant damage and need painting or repair. | Major | $15,000–50,000 |
| HVAC system · The HVAC system appears old and may need replacement. | Major | $15,000–50,000 |
| Total estimated repair cost · 7 items | $105,000–350,000 |
Value-add ROI direction
- Resale Kitchen renovation — A new kitchen will attract more buyers and increase the home's value. ↑
- Resale Bathroom renovation — Upgraded bathrooms will appeal to potential buyers and increase the home's value. ↑
- Resale Roof replacement — A new roof will improve the home's curb appeal and increase its value. ↑
- Resale Exterior siding repair — A fresh coat of paint and new siding will enhance the home's appearance and value. ↑
- Resale Flooring replacement — New flooring will make the home more attractive and increase its value. ↑
- Resale Interior wall repair and painting — Fresh paint and repairs will improve the home's condition and increase its value. ↑
- Resale HVAC system replacement — A new HVAC system will improve the home's comfort and energy efficiency, increasing its value. ↑
ⓘ Cost ranges are severity-bucket heuristics (US national rule-of-thumb). Get contractor quotes + a written scope before underwriting a rehab budget.
Schools (NCES district)
- District
- Princeton ISD
- NCES district ID
- 4835850
- Math proficiency
- 51% ▼ -8.00%
- Reading proficiency
- 47% ▬ 0.00%
- Median HH income
- $54,827
- Composite
- 42.44/100
- National rank
- #3226
- State rank
- #188 of 826 in TX
Livability — Wylie
- Score
- 69/100
- State rank
- #419
- US rank
- #8623
Category grades
Schools grade is shown separately in the Schools card above.
Census & demographics
- County
- Collin County · 1,159,394 people
- City population
- 34,171
- Metro
- Dallas-Fort Worth-Arlington, TX
- Population (ZIP)
- 34,171
- Household income
- $100,037
- Rent vs Own
- Severe rent burden
- 368.0
Population outlook (Collin County) Hauer SSP2
- Today (2025)
- 1,210,074 people
- By 2030
- 1,358,201 · +12.2%
- By 2040
- 1,654,061 · +36.7%
- By 2050
- 1,937,359 · +60.1%
- By 2075
- 2,567,039 · +112.1%
- By 2100
- 2,952,048 · +144.0%
Race, ethnicity, and origin ACS 2023
- Neighborhood character
- Diverse neighborhood (Simpson 0.66)
- Race & ethnicity
- White 47% Hispanic / Latino 30% Black 17% Two or more races 10% Asian 4% Native American 1%
- Hispanic origin (detail)
- Mexican 26%
- Common ancestry
- Lithuanian 2% Romanian 1% Russian 1%
- Foreign-born
- 15% · Canada, China, Mexico
- Languages at home
- 70% English-only · Spanish 22% Other Indo-European 2% Other Asian/Pacific 1%
Political lean MEDSL · Collin
- 2024 margin
- R (+11.1) · D 43.1% · R 54.3% · Other 2.6%
- 2008→2024 swing
- +14.4pp toward D · 2008: -25.6pp · 2024: -11.1pp
- All cycles
- 2024: R+11.1 2020: R+4.3 2016: R+17.0 2012: R+31.6 2008: R+25.6
Not yet ingested
- Civics
- —
Market trends
- HPI YoY
- ▼ -103.99%
- Current HPI
- 238.9373
- Rent YoY
- ▼ -1.02%
- Metro
- Dallas-Fort Worth-Arlington, TX
- State GDP YoY
- ▲ 3.95%
- F500 in state
- 110
Industry mix (Fortune 500 HQ in TX)
| Industry | F500 HQs | Revenue |
|---|---|---|
| Energy | 16 | $1,198B |
|
||
| Technology | 5 | $198B |
|
||
| Engineering / Construction | 4 | $72B |
|
||
| Energy Services | 3 | $60B |
|
||
| Utilities | 3 | $41B |
|
||
| Healthcare | 2 | $330B |
|
||
Cash-flow waterfall
monthlySold comps — $/sqft
last 12 mo · ≤1 miLoading sold comps…