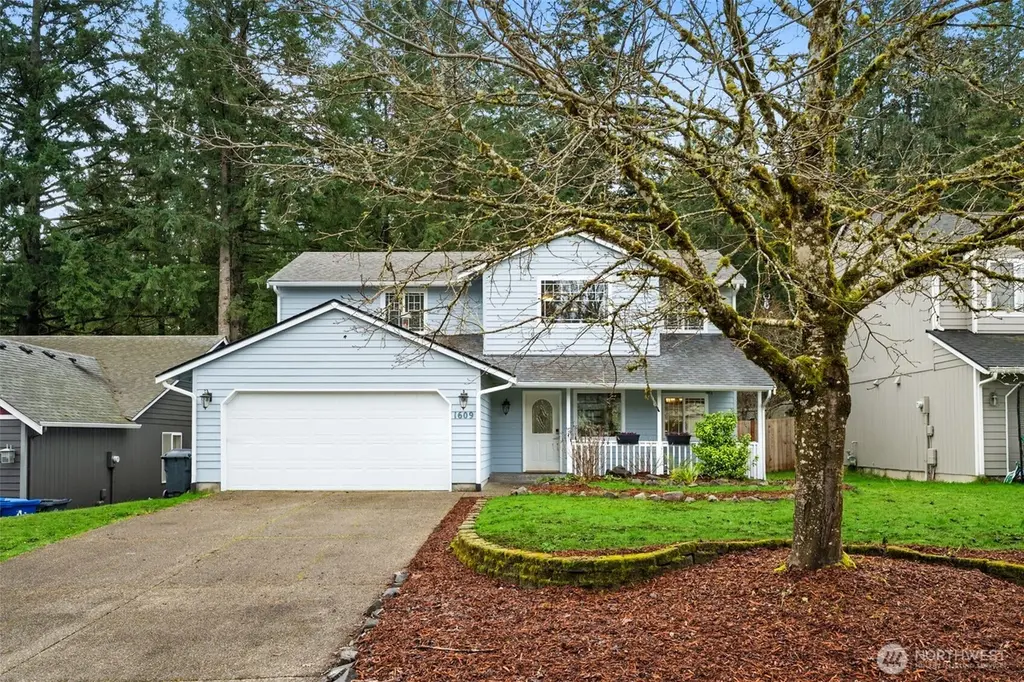
1609 15th Ave SW · Olympia, WA
Flood risk 1/10 · Minimal
- FEMA flood zone
- X (unshaded)
- Chance of flooding over 30 yrs
- 0.0%
- Est. flood insurance / yr
- $507 – $1,088
Fire risk 1/10 · Minimal
- Est. fire insurance / yr
- $604 – $1,122
Heat risk 3/10 · Minor
- Hot days now (above 89°F)
- 7 days/yr
- Hot days in 30 yrs
- 14 days/yr
Wind risk 1/10 · Minimal
- Chance of severe wind over 30 yrs
- —
Air-quality risk 6/10 · Moderate
- Unhealthy air days now
- 7 days/yr
- Unhealthy air days in 30 yrs
- 8 days/yr
Risk factors via First Street. Map © Google.
Why this score? — see what drove the D- grade
The composite is a weighted blend of 9 inputs, each scored 0–100. Each bar is that input's sub-score; the figure is the points it added to the 100-point composite (weight × sub-score).
- Appreciation +10.0/10.0
- ARV discount +9.6/15.0
- Schools +6.2/10.0
- Livability +4.2/5.0
- Cash flow +3.8/30.0
- Rent growth +3.3/5.0
- Condition / age +2.5/5.0
- 1% rule +0.0/10.0
- DSCR +0.0/10.0
$545,000
🖨 Deal sheet (PDF) 📄 Offer letter ✓ Due diligence
Listing remarks
Westside 4BR/2.5 Bath 2-Story Home w/ Covered Front Porch - Move-In Ready - $20,000+ Upgrades - New Furnace, Interior Doors, Garbage Disposal & Outdoor Water Spigots. New Paint & Carpet Replaced Throughout. Smart Thermostat & Koi Pond/Fountain w/ Fish. Cleaned/Pressure Washed Deck, Patio & Driveway. Bright Kitchen w/ White Cabinets, Granite Countertops, SS Appliances, Large Island w/ Eating Space & Pantry. Breakfast Area w/ Slider to Large Deck, Garden Space & Fully Fenced Backyard. Great Room with Cozy Gas Fireplace and Access to Main Level Laundry Room & 2-Car Garage w/ Workbench. Formal Dining Room. Primary Bedroom on Upper-Level w/ Private Bathr
Key facts
- Covered front porch
- Koi pond
- New furnace
Tags
Neighborhood map
What this means for you Summary
Snapshot
- This is a 4-bed/2.5-bath single-family listed at $545k.
Deal economics
- At list price, monthly cash flow is $-2k ($-19k/yr) — negative.
- To cash-flow at today's rent, offer at most $266k (51.3% below list).
- To meet the 1% rule (rent ≥ 1% of price), the offer needs to be $249k (54.3% below list).
- Recommended offer: $249k (54.3% below list) — sets the bar for 1% rule.
Location & tenants
- Location reads 83/100 on livability (#58 in WA, #1,036 nationally) — a professional / high-income tenant draw. Strengths: amenities A+, commute A+, health & safety A+; Watch: crime F, cost of living D-.
- Olympia School District (urban): math 66% / reading 75% proficiency, ranked #17 of 291 in WA (top 6%) — strong family-tenant draw, lease renewals of 3-5y typical.
- Market conditions: Rents rising (+3.2%/yr); 304 active listings in the ZIP; 6 comparable units currently listed for rent nearby; rentals lingering (median 44d on market — plan ~5-8 weeks vacancy on turnover, expect pricing pressure); 83% of comp listings sitting > 30 days — soft ceiling on asking rent; solid renter incomes; 1,222 units permitted in Thurston County in 2024 (508 in 5+ unit buildings).
- This rent runs 32% of the median local income ($92k/yr) — at the standard rent-burdened threshold; future hikes will face affordability resistance.
Forward outlook
- In year one you build about $58k of equity ($4k loan paydown + $54k appreciation (10.0% local appreciation)).
- Thurston County population projected at +27% by 2050 — long-run rental-demand tailwind backs the buy-and-hold thesis.
- By year 2, paydown + projected appreciation supports a ~$94k cash-out refi (75% LTV) — recoverable capital for the next deal without selling this one.
Negotiation context
- It's been on market 119 days — a 9% lower offer ($496k) is reasonable based on typical stale-listing flexibility.
- 5 sale attempts since 27y ago; this cycle's ask has dropped $35k (6%) from the opening price — seller is motivated, your offer sets the floor, not the list.
- Current owner paid $345k; list at $545k implies a 58% gain — meaningful room to come down on a strong offer.
Questions for the listing agent
- What do current leases actually rent for vs. the listed asking? Can we see a recent rent roll and the last 12 months of T-12 income?
- It's been on market 119 days. Have you received any prior offers? Is the seller open to a 54% concession, seller financing, or rate buy-down credit?
- What does the HOA fee cover, when was the last increase, and are there any pending special assessments or reserve-fund shortfalls?
- Why hasn't it sold? Are there any deal-killer items the seller is aware of (foundation, flood, title, zoning, code violations)?
- Is there a deadline driving the sale (1031 exchange, divorce, estate, relocation)? That informs how much negotiation room exists.
- Schools are A-rated — typically a magnet for longer-tenancy family renters. What's the average tenant stay here, and is there a school-zone premium baked into asking?
- Crime grade is F in this area — have there been break-ins, vandalism, or insurance claims at this property in the last 3 years? What carrier currently insures it and at what premium?
- The area grade is low — what's the realistic commute time and amenity access for the typical tenant pool here? Any planned neighborhood developments (good or bad) we should know about?
- What's the average days-on-market for RENTAL listings here right now (not sales)? A rising rental-DOM trend means longer vacancies and softer asking-rent achievability than the comps imply.
- What's the recent tenant-quality profile in this submarket — average credit score on applications, eviction rate, late-payment / NSF rate, and stable-employment percentage? A property-management company in the area should have these aggregated.
- How much new for-sale + rental construction is in the pipeline within 1–3 miles? Heavy new supply typically softens prices + rents 12–24 months out; constrained supply supports both.
Investment metrics
- 1% rule
- 0.46% ✗
- Cap rate
- 2.81%
- Cash-on-cash
- -12.44%
- DSCR
- 0.45
- GRM
- 18.2
CMA / ARV
- ARV (median comp)
- $571,353
- List price
- $545,000
- Delta
- -4.61%
- Verdict
- FAIR
- Comps
- 20 within 1.0 mi
Show comp detail 12 sales within ~0.75 mi
| Address | Dist | Beds/Ba | Sqft | Sold | Price | $/sf | Match |
|---|---|---|---|---|---|---|---|
| 1721 15th Ave SW | 0.08mi | 3/2.0 (-1) | 1,850 (-0%) | 17mo | $570,000 | $308 | 74 |
| 1436 12th Ave SW | 0.22mi | 3/2.0 (-1) | 1,761 (-5%) | 0mo | $620,000 | $352 | 74 |
| 1718 Fern St SW | 0.29mi | 3/2.5 (-1) | 1,880 (+2%) | 6mo | $524,900 | $279 | 74 |
| 922 Plymouth St SW | 0.37mi | 4/2.5 | 1,926 (+4%) | 9mo | $520,000 | $270 | 69 |
| 1709 Fern St SW | 0.31mi | 3/2.5 (-1) | 1,938 (+5%) | 6mo | $499,000 | $257 | 68 |
| 1606 11th Ave SW | 0.28mi | 3/2.5 (-1) | 1,678 (-9%) | 2mo | $489,000 | $291 | 64 |
| 1526 Division St SW | 0.18mi | 3/2.5 (-1) | 1,728 (-7%) | 17mo | $488,500 | $283 | 61 |
| 1501 Division St SW | 0.20mi | 3/2.5 (-1) | 1,728 (-7%) | 18mo | $525,000 | $304 | 59 |
| 2017 18th Ave SW | 0.28mi | 4/2.5 | 2,120 (+14%) | 14mo | $600,000 | $283 | 51 |
| 717 Cushing St SW | 0.51mi | 3/2.0 (-1) | 1,650 (-11%) | 9mo | $605,000 | $367 | 43 |
| 1322 11th Ct SW | 0.29mi | 3/2.0 (-1) | 1,600 (-14%) | 19mo | $575,000 | $359 | 41 |
| 1003 6th Ave SW | 0.65mi | 3/3.0 (-1) | 1,728 (-7%) | 15mo | $633,000 | $366 | 39 |
Match score weights: distance 35% · size 25% · config 20% · recency 20%. Top-matched comps best support the ARV.
Projected returns pro-forma
10.0% appreciation · 3.16% rent growth · sell at horizon
- IRR
- 15.6%
- Equity multiple
- 2.29×
- Total profit
- $196,360
- Equity at exit
- $490,979
- IRR
- 15.2%
- Equity multiple
- 5.31×
- Total profit
- $658,120
- Equity at exit
- $1,058,815
Cash invested: $152,600 (down + closing). Projections, not guarantees.
Landlord ↔ Tenant lean methodology
- Overall (STATE)
- 28 Tenant-Leaning
- State Washington
- 28 Tenant-Leaning · D+8
- County
- — inherits STATE
- City
- — inherits STATE
ZIP-level market 98502
- Home prices YoY
- 1.8%
- Rents YoY
- 3.2%
- Active inventory
- 304
- Price-to-rent
- 18.2×
Monthly cashflow live
- Estimated rent
- $2,490 high interval (Pro) →
- Mortgage (P&I)
- −$2,858
- Tax from tax record
- −$444 /mo · $5,327/yr
- Insurance
- −$227
- HOA
- −$20
- Vacancy / Maint / Mgmt
- −$523
- Net cashflow
- $-1,582
Break-even live
Sensitivity live
| Price | -10% $-1,274 | -5% $-1,428 | +0% $-1,582 | +5% $-1,736 | +10% $-1,891 |
|---|---|---|---|---|---|
| Rent | -10% $-1,779 | -5% $-1,680 | +0% $-1,582 | +5% $-1,484 | +10% $-1,385 |
| Rate | -1.0pp $-1,308 | -0.5pp $-1,444 | base $-1,582 | +0.5pp $-1,723 | +1.0pp $-1,867 |
UW: 25.0% down · 7.5% · 30yr · 1.5% tax · 5.0% vac · 8.0% maint · 8.0% mgmt
Financing live
Cash to close
- Down payment
- $136,250
- Closing costs
- $16,350
- Reserves months
- —
- Total cash needed
- —
Loan-product check · same deal, 3 products live
Conventional
25% down · 7.5% · 30yr
- Down + closing
- —
- Monthly P&I
- —
- Monthly cashflow
- —
- DSCR
- —
- Eligible?
- —
Personal DTI + credit; lowest rate.
DSCR
20% down · 8.5% · 30yr
- Down + closing
- —
- Monthly P&I
- —
- Monthly cashflow
- —
- DSCR
- —
- Eligible?
- —
No personal income docs; deal must DSCR.
Hard money
10% down · 12.0% · 12mo
- Down + closing
- —
- Monthly P&I
- —
- Monthly cashflow
- —
- DSCR
- —
- Eligible?
- —
Short-term bridge; refi at stabilization.
Rent comps 6 comps
| Address | Beds | Baths | Sqft | Rent | $/sqft | DOM | Units | Dist |
|---|---|---|---|---|---|---|---|---|
| 1653 Starlight Ln SW Olympia, WA | 3.0 | 2.5 | 1559 | $2,800 | $1.80 | 14d | 2 | 1.11mi |
| 512 N 4th Ave SW Tumwater, WA | 3.0 | 2.0 | 1232 | $2,095 | $1.70 | 44d | 1 | 1.20mi |
| 407 N 5th Ave SW Tumwater, WA | 3.0 | 1.5 | 1650 | $2,250 | $1.36 | 44d | 1 | 1.22mi |
| 407 N 5th Ave SW Unit A Tumwater, WA | 3.0 | 1.5 | 1650 | $2,250 | $1.36 | 44d | 1 | 1.22mi |
| 2137 Conger Ave NW Unit C Olympia, WA | 3.0 | 2.0 | 1248 | $1,895 | $1.52 | 44d | 1 | 1.23mi |
| 2137 Conger Ave NW Unit A Olympia, WA | 3.0 | 2.0 | 1248 | $1,995 | $1.60 | 44d | 1 | 1.23mi |
HOA detail
- Monthly dues
- $20 · $240/yr
- Likely covers
- watertrashgas
Listing history 34 events
-
2026-06-18days on market $545,000 Active 119 DOM
-
2026-06-17days on market $545,000 Active 118 DOM
-
2026-06-16days on market $545,000 Active 117 DOM
-
2026-06-15days on market $545,000 Active 116 DOM
-
2026-06-14days on market $545,000 Active 114 DOM
-
2026-06-13pricedays on market $545,000 Active 113 DOM
-
2026-06-10days on market $560,000 Active 111 DOM
-
2026-06-09days on market $560,000 Active 110 DOM
-
2026-06-08days on market $560,000 Active 109 DOM
-
2026-06-07days on market $560,000 Active 108 DOM
-
2026-06-05days on market $560,000 Active 105 DOM
-
2026-06-02days on market $560,000 Active 103 DOM
-
2026-06-01days on market $560,000 Active 102 DOM
-
2026-05-31days on market $560,000 Active 101 DOM
-
2026-05-30days on market $560,000 Active 100 DOM
-
2026-04-01price $560,000
-
2026-02-19$580,000 Active
-
2018-06-08soldstatus $345,000 Sold
-
2018-06-08soldstatus $345,000
-
2018-05-09status Pending
-
2018-05-04$345,000 Active
-
2015-11-10soldstatus $218,000 Sold
-
2015-09-26status Pending
-
2015-09-02$220,000 Active
-
2009-10-01soldstatus $259,950 Sold
-
2009-09-30soldstatus $259,950
-
2009-08-17status Pending Inspection
-
2009-07-27price $259,950
-
2009-06-22price $269,950
-
2009-06-05price $274,950
-
2009-05-13$279,950
-
1999-12-10soldstatus $160,000
-
1999-12-10soldstatus $160,000
-
1999-03-15$165,000
ⓘ Source: listings_history table (triggers on properties + properties_extension) + one-shot
backfill from property_details.listing_events for pre-trigger history.
Tax reassessment forecast WA · Resets to sale price
- Current annual tax
- $5,327 · $444/mo
- Projected year-2 tax
- $5,341 · $445/mo
- Expected delta
- +$14/yr (+$1/mo · 0.3%)
ⓘ Screening estimate from a state-policy table — verify with the county assessor before closing.
Climate risk First Street
- Flood 1/10 Low FEMA zone X (unshaded) · 0% chance over 30 yrs
- Wildfire 1/10 Low
- Heat 3/10 Moderate 7 d/yr ≥89°F today · 14 d/yr by 30 yrs out
- Wind 1/10 Low
- Air quality 6/10 Major 7 unhealthy d/yr today · 8 by 30 yrs out
Nearby sold comps map
Loading sold comps map…
Walkable amenities ~0.75 mi
Loading nearby amenities…
Taxation est. · year 1
- Rental income
- $29,877
- − Mortgage interest
- −$30,528
- − Property taxes
- −$5,327
- − Insurance
- −$2,725
- − Repairs & maintenance
- −$2,390
- − Management
- −$2,390
- − HOA
- −$240
- − Depreciation
- −$15,855
- Taxable loss
- −$29,578
- Est. tax savings @ 24.0%
- +$7,099
- After-tax cash flow
- $-11,887/yr
For passive investors: Depreciation is non-cash, so a rental often shows a tax loss while cash-flowing — sheltering income. Rental losses are passive: they offset passive income freely, and up to $25,000/yr can offset ordinary (W-2) income if you actively participate and your MAGI is under $100k (phasing out to $0 by $150k); unused losses carry forward. On sale, claimed depreciation is recaptured at up to 25%, and gains may owe capital-gains tax (a 1031 exchange can defer both). Figures are a year-1 estimate at your 24.0% rate — not tax advice; consult a CPA.
Schools (NCES district)
- District
- Olympia School District
- NCES district ID
- 5306180
- Math proficiency
- 66% ▼ -2.00%
- Reading proficiency
- 75% ▼ -2.00%
- Median HH income
- $63,852
- Composite
- 62.27/100
- National rank
- #1438
- State rank
- #17 of 291 in WA
Livability — Olympia
- Score
- 83/100
- State rank
- #58
- US rank
- #1036
Category grades
Schools grade is shown separately in the Schools card above.
Census & demographics
- Census place
- Olympia, WA
- County
- Thurston County · 269,345 people
- City population
- 98,428
- Metro
- Olympia-Lacey-Tumwater, WA
- Population (ZIP)
- 35,398
- Household income
- $92,207
- Rent vs Own
- Severe rent burden
- 1811.0
Population outlook (Thurston County) Hauer SSP2
- Today (2025)
- 308,239 people
- By 2030
- 326,483 · +5.9%
- By 2040
- 359,890 · +16.8%
- By 2050
- 391,800 · +27.1%
- By 2075
- 468,024 · +51.8%
- By 2100
- 519,890 · +68.7%
Race, ethnicity, and origin ACS 2023
- Neighborhood character
- Predominantly White (71%)
- Race & ethnicity
- White 71% Two or more races 13% Hispanic / Latino 11% Asian 6% Black 3% Native American 1%
- Hispanic origin (detail)
- Mexican 3% Puerto Rican 4%
- Common ancestry
- Italian 5% Portuguese 4% Iranian 3%
- Foreign-born
- 8% · Vietnam, Canada, China
- Languages at home
- 90% English-only · Spanish 3% Vietnamese 2% Other Asian/Pacific 1%
Political lean MEDSL · Thurston
- 2024 margin
- Strong D (+20.4) · D 58.5% · R 38.1% · Other 3.5%
- 2008→2024 swing
- -1.3pp toward R · 2008: 21.7pp · 2024: 20.4pp
- All cycles
- 2024: D+20.4 2020: D+18.6 2016: D+15.4 2012: D+19.0 2008: D+21.7
Not yet ingested
- Civics
- —
Market trends
- HPI YoY
- ▲ 18.49%
- Current HPI
- 1056.49
- Rent YoY
- ▲ 3.16%
- Metro
- Olympia-Lacey-Tumwater, WA
- State GDP YoY
- ▲ 4.65%
- F500 in state
- 22
Industry mix (Fortune 500 HQ in WA)
| Industry | F500 HQs | Revenue |
|---|---|---|
| Retail | 2 | $269B |
|
||
| Technology / Retail | 1 | $638B |
|
||
| Technology | 1 | $245B |
|
||
| Telecommunications | 1 | $38B |
|
||
| Food / Beverage | 1 | $36B |
|
||
| Automotive / Trucks | 1 | $34B |
|
||
Price history
+239.4% since first listed19 events — show timeline
- 2026-04-01 Price Changed $560,000 NWMLS as Distributed by MLS Grid
- 2026-02-19 Listed $580,000 NWMLS as Distributed by MLS Grid
- 2018-06-08 Sold (Public Records) $345,000 Public Records
- 2018-06-08 Sold (MLS) $345,000 NWMLS as Distributed by MLS Grid
- 2018-05-09 Pending — NWMLS as Distributed by MLS Grid
- 2018-05-04 Listed $345,000 NWMLS as Distributed by MLS Grid
- 2015-11-10 Sold (MLS) $218,000 NWMLS as Distributed by MLS Grid
- 2015-09-26 Pending — NWMLS as Distributed by MLS Grid
- 2015-09-02 Listed $220,000 NWMLS as Distributed by MLS Grid
- 2009-10-01 Sold (MLS) $259,950 NWMLS as Distributed by MLS Grid
- 2009-09-30 Sold (Public Records) $259,950 Public Records
- 2009-08-17 Pending — NWMLS as Distributed by MLS Grid
- 2009-07-27 Price Changed $259,950 NWMLS as Distributed by MLS Grid
- 2009-06-22 Price Changed $269,950 NWMLS as Distributed by MLS Grid
- 2009-06-05 Price Changed $274,950 NWMLS as Distributed by MLS Grid
- 2009-05-13 Listed $279,950 NWMLS as Distributed by MLS Grid
- 1999-12-10 Sold (Public Records) $160,000 Public Records
- 1999-12-10 Sold (MLS) $160,000 NWMLS as Distributed by MLS Grid
- 1999-03-15 Listed $165,000 NWMLS as Distributed by MLS Grid
Property tax history
+4.3%/yrLatest (2026): $5,327 · +4.3% YoY. Source: county tax records.
Cash-flow waterfall
monthlySold comps — $/sqft
last 12 mo · ≤1 miLoading sold comps…