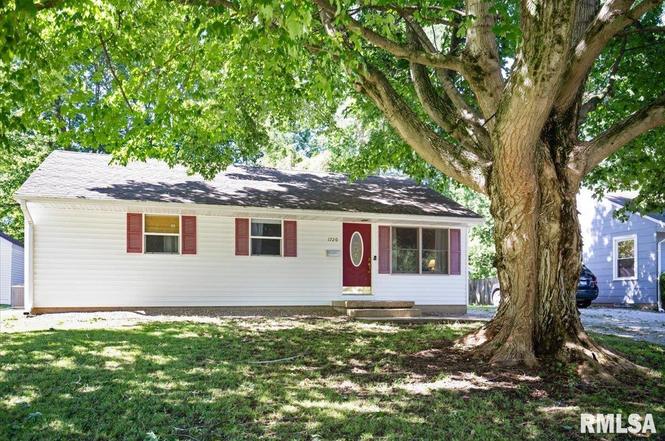
1720 W Glenn Ave · Jerome, IL
Flood risk 1/10 · Minimal
- FEMA flood zone
- X (unshaded)
- Chance of flooding over 30 yrs
- 0.0%
- Est. flood insurance / yr
- $473 – $860
Fire risk 1/10 · Minimal
- Est. fire insurance / yr
- $804 – $1,492
Heat risk 4/10 · Minor
- Hot days now (above 105°F)
- 7 days/yr
- Hot days in 30 yrs
- 20 days/yr
Wind risk 2/10 · Minimal
- Chance of severe wind over 30 yrs
- 1.0%
Air-quality risk 2/10 · Minimal
- Unhealthy air days now
- 1 days/yr
- Unhealthy air days in 30 yrs
- 2 days/yr
Risk factors via First Street. Map © Google.
Why this score? — see what drove the D- grade
The composite is a weighted blend of 9 inputs, each scored 0–100. Each bar is that input's sub-score; the figure is the points it added to the 100-point composite (weight × sub-score).
- Cash flow +13.7/30.0
- Livability +4.7/5.0
- ARV discount +4.3/15.0
- 1% rule +4.2/10.0
- DSCR +4.1/10.0
- Rent growth +4.1/5.0
- Condition / age +2.5/5.0
- Schools +1.7/10.0
- Appreciation +0.0/10.0
$139,900
🖨 Deal sheet (PDF) 📄 Offer letter ✓ Due diligence
Listing remarks MLS
Maintenance free exterior, fenced back yard. Hardwood and ceramic floors. French door in Dining Room. Recent Improvements: New roof, Wall insulation, Attic insulation, Thermo pane windows, Entrance door, Vinyl siding, Seamless gutters, Aluminum soffit & fascia, Bath and Kitchen remodel, Laundry room cabinets, counter top, and Laundry room sink, Light fixtures, Fresh interior paint. Matching Stainless Steel Refrigerator, Range, Microwave, Dishwasher.
Key facts
- Radon mediation
- Fenced yard
- Close to shopping
Tags
Property features AI
Exterior
- Parking: Gravel parking (no garage)
- Utilities: Public water; Public sewer
- Home design: Single-family residence; Shingle roof; Built in 1951
- Construction: Shingle roof; No new construction
- Exterior features: Fenced lot; Level lot; Outbuilding on the property
Interior
- Kitchen: Dishwasher; Disposal; Microwave; Refrigerator; Tile flooring in kitchen
- Bedrooms: 3 bedrooms: three on the main level
- Flooring: Hardwood flooring in living room and bedrooms; Tile in kitchen; Vinyl in laundry
- Bathrooms: 1 full bathroom
- Heating & cooling: Forced air heating; Central air conditioning
- Interior features: Ceiling fan(s); Radon mitigation system; No basement
- Laundry & utility: Main-level laundry (vinyl flooring)
Neighborhood map
What this means for you Summary
Snapshot
- This is a 3-bed/1.0-bath single-family listed at $140k.
Deal economics
- At list price, monthly cash flow is $11 ($130/yr) — positive.
- The deal already cash-flows at list — no discount required.
- To meet the 1% rule (rent ≥ 1% of price), the offer needs to be $129k (7.7% below list).
- Recommended offer: $129k (7.7% below list) — sets the bar for 1% rule.
Location & tenants
- Location reads 93/100 on livability (#1 in IL, #17 nationally) — a professional / high-income tenant draw. Strengths: crime A+, amenities A+, commute A+; Watch: employment C-.
- Springfield SD 186 (urban): math 17% / reading 22% proficiency, ranked #438 of 620 in IL (top 71%) — low school quality limits family demand, transient renter base, plan for 1-2y turnover; 64% free/reduced lunch — lower-income household profile, screen leases tightly.
- Zoned schools: Lindsay School (math 17% / reading 22%, grade F, #1,054 of 2,056 statewide, top 54%, 423 students, 0% FRL); Benjamin Franklin Middle School (math 23% / reading 31%, grade F, #302 of 665 statewide, top 47%, 713 students, 0% FRL); Springfield Southeast High Sch (math 17% / reading 22%, grade F, #397 of 693 statewide, top 61%, 1,261 students, 0% FRL) — zoned schools average 0% FRL vs 64% district-wide (64 pts lower); this property's tenant base skews higher-income than the district average.
- Market conditions: Rents rising fast (+6.3%/yr); 183 active listings in the ZIP; 7 comparable units currently listed for rent nearby; rentals at typical pace (median 23d on market — plan ~3-4 weeks tenant-placement turnaround); 43% of comp listings sitting > 30 days — soft ceiling on asking rent; 225 units permitted in Sangamon County in 2024 (48 in 5+ unit buildings).
Forward outlook
- Local home prices are declining (-3.0%/yr); year-one equity from $967 of loan paydown is wiped out by about $4k of value loss. Plan a longer hold.
- Sangamon County population projected to shrink 9% by 2050 — rents likely to lag national; underwrite the cash flow, not the appreciation.
Negotiation context
- Only 3 days on market — expect competitive offers; lowballing is unlikely to land.
- 2 sale attempts since 15y ago with the ask held roughly flat each time — persistent listings suggest the price (not the market) is what's stuck; bring a comps-based counter.
- Current owner paid $88k; list at $140k implies a 59% gain — meaningful room to come down on a strong offer.
Risks & watch-outs
- Watch-outs: built in 1951 — expect roof / HVAC / electrical / plumbing capex.
Questions for the listing agent
- Built in 1951 — when were the roof, HVAC, electrical panel, plumbing, and water heater last replaced?
- Is there a deadline driving the sale (1031 exchange, divorce, estate, relocation)? That informs how much negotiation room exists.
- Schools are B-rated — typically a magnet for longer-tenancy family renters. What's the average tenant stay here, and is there a school-zone premium baked into asking?
- The area grade is low — what's the realistic commute time and amenity access for the typical tenant pool here? Any planned neighborhood developments (good or bad) we should know about?
- What's the average days-on-market for RENTAL listings here right now (not sales)? A rising rental-DOM trend means longer vacancies and softer asking-rent achievability than the comps imply.
- What's the recent tenant-quality profile in this submarket — average credit score on applications, eviction rate, late-payment / NSF rate, and stable-employment percentage? A property-management company in the area should have these aggregated.
- How much new for-sale + rental construction is in the pipeline within 1–3 miles? Heavy new supply typically softens prices + rents 12–24 months out; constrained supply supports both.
Investment metrics
- 1% rule
- 0.92% ✗
- Cap rate
- 6.39%
- Cash-on-cash
- 0.33%
- DSCR
- 1.01
- GRM
- 9.0
CMA / ARV
- ARV (on-the-fly)
- $130,650
- Comps found
- 11
Show comp detail 11 sales within ~0.75 mi
| Address | Dist | Beds/Ba | Sqft | Sold | Price | $/sf | Match |
|---|---|---|---|---|---|---|---|
| 2625 S Welch Ave | 0.09mi | 3/1.0 | 950 (-3%) | 9mo | $145,000 | $153 | 84 |
| 1546 Reed Ave | 0.33mi | 3/1.0 | 1,000 (+3%) | 14mo | $166,500 | $167 | 69 |
| 1729 W Glenn Ave | 0.04mi | 3/1.0 | 1,041 (+7%) | 23mo | $140,000 | $134 | 68 |
| 1713 W Iles Ave | 0.15mi | 3/1.0 | 1,071 (+10%) | 13mo | $93,000 | $87 | 66 |
| 2701 S Welch Ave | 0.08mi | 2/2.0 (-1) | 1,101 (+13%) | 16mo | $114,900 | $104 | 52 |
| 10 Reed Ct | 0.48mi | 2/1.0 (-1) | 846 (-13%) | 2mo | $110,000 | $130 | 49 |
| 1 Nottingham Rd | 0.52mi | 3/1.0 | 1,080 (+11%) | 13mo | $172,500 | $160 | 47 |
| 2819 S Lincoln | 0.65mi | 3/1.0 | 869 (-11%) | 6mo | $120,000 | $138 | 46 |
| 1530 Homewood Ave | 0.27mi | 2/1.0 (-1) | 840 (-14%) | 16mo | $89,900 | $107 | 46 |
| 1330 W Glenn Ave | 0.45mi | 2/1.0 (-1) | 1,115 (+14%) | 15mo | $127,000 | $114 | 38 |
| 1516 W Glenn St | 0.33mi | 2/2.0 (-1) | 840 (-14%) | 21mo | $152,000 | $181 | 36 |
Match score weights: distance 35% · size 25% · config 20% · recency 20%. Top-matched comps best support the ARV.
Projected returns pro-forma
-3.0% appreciation · 6.32% rent growth · sell at horizon
- IRR
- -11.9%
- Equity multiple
- 0.55×
- Total profit
- $-17,481
- Equity at exit
- $20,860
- IRR
- 1.7%
- Equity multiple
- 1.14×
- Total profit
- $5,421
- Equity at exit
- $12,096
Cash invested: $39,172 (down + closing). Projections, not guarantees.
Landlord ↔ Tenant lean methodology
- Overall (STATE)
- 43 Moderately Tenant-Leaning
- State Illinois
- 43 Moderately Tenant-Leaning · D+7
- County
- — inherits STATE
- City
- — inherits STATE
ZIP-level market 62704
- Home prices YoY
- -31.1%
- Rents YoY
- 6.3%
- Active inventory
- 183
- Price-to-rent
- 9.0×
Monthly cashflow live
- Estimated rent
- $1,291 high interval (Pro) →
- Mortgage (P&I)
- −$734
- Tax from tax record
- −$217 /mo · $2,602/yr
- Insurance
- −$58
- HOA
- −$0
- Vacancy / Maint / Mgmt
- −$271
- Net cashflow
- $11
Break-even live
Sensitivity live
| Price | -10% $90 | -5% $50 | +0% $11 | +5% $-29 | +10% $-68 |
|---|---|---|---|---|---|
| Rent | -10% $-91 | -5% $-40 | +0% $11 | +5% $62 | +10% $113 |
| Rate | -1.0pp $81 | -0.5pp $46 | base $11 | +0.5pp $-25 | +1.0pp $-62 |
UW: 25.0% down · 7.5% · 30yr · 1.5% tax · 5.0% vac · 8.0% maint · 8.0% mgmt
Financing live
Cash to close
- Down payment
- $34,975
- Closing costs
- $4,197
- Reserves months
- —
- Total cash needed
- —
Loan-product check · same deal, 3 products live
Conventional
25% down · 7.5% · 30yr
- Down + closing
- —
- Monthly P&I
- —
- Monthly cashflow
- —
- DSCR
- —
- Eligible?
- —
Personal DTI + credit; lowest rate.
DSCR
20% down · 8.5% · 30yr
- Down + closing
- —
- Monthly P&I
- —
- Monthly cashflow
- —
- DSCR
- —
- Eligible?
- —
No personal income docs; deal must DSCR.
Hard money
10% down · 12.0% · 12mo
- Down + closing
- —
- Monthly P&I
- —
- Monthly cashflow
- —
- DSCR
- —
- Eligible?
- —
Short-term bridge; refi at stabilization.
Rent comps 7 comps
| Address | Beds | Baths | Sqft | Rent | $/sqft | DOM | Units | Dist |
|---|---|---|---|---|---|---|---|---|
| 1666 Seven Pines Rd Springfield, IL | 1.0–4.0 | 1.0–1.5 | 1025 | $1,383 | $1.35 | 23d | 1 | 0.70mi |
| 2715 S MacArthur Blvd Unit 01 Springfield, IL | 2.0 | 1.5 | 935 | $975 | $1.04 | 45d | 1 | 0.76mi |
| 2300 Lombard Ave Unit 2300 Lombard Springfield, IL | 2.0 | 1.0 | 1100 | $1,350 | $1.23 | 23d | 1 | 0.83mi |
| 9 Candlelight Dr Springfield, IL | 1.0–3.0 | 1.0–2.0 | 980 | $1,535 | $1.57 | 23d | 20 | 0.84mi |
| 12 Douglas Ct Springfield, IL | 3.0 | 1.0 | 1000 | $1,300 | $1.30 | 23d | 1 | 0.88mi |
| 3116 Concord Dr Springfield, IL | 2.0 | 1.0 | 944 | $950 | $1.01 | 45d | 1 | 1.07mi |
| 2119 Saratoga Dr Unit 3 Springfield, IL | 2.0 | 1.0 | 800 | $925 | $1.16 | 45d | 1 | 1.09mi |
Listing history 5 events
-
2026-06-18status $139,900 Pending 3 DOM
-
2026-06-18days on market $139,900 Active 3 DOM
-
2026-06-17days on market $139,900 Active 2 DOM
-
2026-06-15remarks 228-char remark
-
2026-06-15$139,900 Active 1 DOM
ⓘ Source: listings_history table (triggers on properties + properties_extension) + one-shot
backfill from property_details.listing_events for pre-trigger history.
Tax reassessment forecast IL · Partial reset (capped growth)
- Current annual tax
- $2,602 · $217/mo
- Projected year-2 tax
- $2,889 · $241/mo
- Expected delta
- +$287/yr (+$24/mo · 11.0%)
ⓘ Screening estimate from a state-policy table — verify with the county assessor before closing.
Climate risk First Street
- Flood 1/10 Low FEMA zone X (unshaded) · 0% chance over 30 yrs
- Wildfire 1/10 Low
- Heat 4/10 Moderate 7 d/yr ≥105°F today · 20 d/yr by 30 yrs out
- Wind 2/10 Low 100% chance of damaging wind over 30 yrs
- Air quality 2/10 Low 1 unhealthy d/yr today · 2 by 30 yrs out
Nearby sold comps map
Loading sold comps map…
Walkable amenities ~0.75 mi
Loading nearby amenities…
Taxation est. · year 1
- Rental income
- $15,487
- − Mortgage interest
- −$7,837
- − Property taxes
- −$2,602
- − Insurance
- −$700
- − Repairs & maintenance
- −$1,239
- − Management
- −$1,239
- − Depreciation
- −$4,070
- Taxable loss
- −$2,198
- Est. tax savings @ 24.0%
- +$528
- After-tax cash flow
- $657/yr
For passive investors: Depreciation is non-cash, so a rental often shows a tax loss while cash-flowing — sheltering income. Rental losses are passive: they offset passive income freely, and up to $25,000/yr can offset ordinary (W-2) income if you actively participate and your MAGI is under $100k (phasing out to $0 by $150k); unused losses carry forward. On sale, claimed depreciation is recaptured at up to 25%, and gains may owe capital-gains tax (a 1031 exchange can defer both). Figures are a year-1 estimate at your 24.0% rate — not tax advice; consult a CPA.
Schools (NCES district)
- District
- Springfield SD 186
- NCES district ID
- 1737080
- Math proficiency
- 17% ▼ -7.00%
- Reading proficiency
- 22% ▼ -5.00%
- Median HH income
- $43,744
- Composite
- 16.89/100
- National rank
- #9142
- State rank
- #438 of 620 in IL
Livability — Jerome
- Score
- 93/100
- State rank
- #1
- US rank
- #17
Category grades
Schools grade is shown separately in the Schools card above.
Census & demographics
- Census place
- Jerome, IL
- County
- Sangamon County · 115,414 people
- Metro
- Springfield, IL
- Population (ZIP)
- 40,046
- Household income
- $69,976
- Rent vs Own
- Severe rent burden
- 1529.0
Population outlook (Sangamon County) Hauer SSP2
- Today (2025)
- 198,317 people
- By 2030
- 196,127 · -1.1%
- By 2040
- 188,664 · -4.9%
- By 2050
- 179,624 · -9.4%
- By 2075
- 155,027 · -21.8%
- By 2100
- 122,588 · -38.2%
Race, ethnicity, and origin ACS 2023
- Neighborhood character
- Predominantly White (74%)
- Race & ethnicity
- White 74% Black 15% Two or more races 5% Hispanic / Latino 4% Asian 4%
- Common ancestry
- Lithuanian 2% Romanian 2% Slovak 2%
- Foreign-born
- 6% · Canada, China, Vietnam
- Languages at home
- 92% English-only · Spanish 2% Other Indo-European 1% Tagalog/Filipino 1%
Political lean MEDSL · Sangamon
- 2024 margin
- Toss-up / Even · D 46.6% · R 51.6% · Other 1.8%
- 2008→2024 swing
- -9.3pp toward R · 2008: 4.4pp · 2024: -5.0pp
- All cycles
- 2024: R+5.0 2020: R+4.4 2016: R+9.4 2012: R+8.7 2008: D+4.4
Not yet ingested
- Civics
- —
Market trends
- HPI YoY
- ▼ -70.79%
- Current HPI
- 156.7086
- Rent YoY
- ▲ 6.32%
- Metro
- Springfield, IL
- State GDP YoY
- ▲ 1.59%
- F500 in state
- 60
Industry mix (Fortune 500 HQ in IL)
| Industry | F500 HQs | Revenue |
|---|---|---|
| Insurance | 4 | $201B |
|
||
| Consumer Goods | 4 | $87B |
|
||
| Industrial Machinery | 3 | $64B |
|
||
| Healthcare | 2 | $55B |
|
||
| Retail / Pharmacy | 1 | $148B |
|
||
| Agriculture / Food | 1 | $86B |
|
||
Price history
+55.6% since first listed4 events — show timeline
- 2026-06-15 Listed $139,900 RMLSA as Distributed by MLS Grid
- 2011-11-15 Sold (Public Records) $88,000 Public Records
- 2011-11-10 Sold (MLS) $88,000 RMLSA as Distributed by MLS Grid
- 2011-05-16 Listed $89,900 RMLSA as Distributed by MLS Grid
Property tax history
+3.8%/yrLatest (2025): $2,602 · +4.4% YoY. Source: county tax records.
Cash-flow waterfall
monthlySold comps — $/sqft
last 12 mo · ≤1 miLoading sold comps…