12149 W Highway 99 · Red Bluff, CA
Flood risk No data
- FEMA flood zone
- —
- Chance of flooding over 30 yrs
- —
- Est. flood insurance / yr
- —
Fire risk No data
- Est. fire insurance / yr
- —
Heat risk No data
- Hot days now (above threshold)
- —
- Hot days in 30 yrs
- —
Wind risk No data
- Chance of severe wind over 30 yrs
- —
Air-quality risk No data
- Unhealthy air days now
- —
- Unhealthy air days in 30 yrs
- —
Risk factors via First Street. Map © Google.
Why this score? — see what drove the C- grade
The composite is a weighted blend of 9 inputs, each scored 0–100. Each bar is that input's sub-score; the figure is the points it added to the 100-point composite (weight × sub-score).
- Cash flow +16.6/30.0
- ARV discount +15.0/15.0
- DSCR +5.2/10.0
- 1% rule +3.7/10.0
- Livability +2.9/5.0
- Rent growth +2.7/5.0
- Condition / age +2.5/5.0
- Schools +2.1/10.0
- Appreciation +0.0/10.0
$195,888
🖨 Deal sheet (PDF) 📄 Offer letter ✓ Due diligence
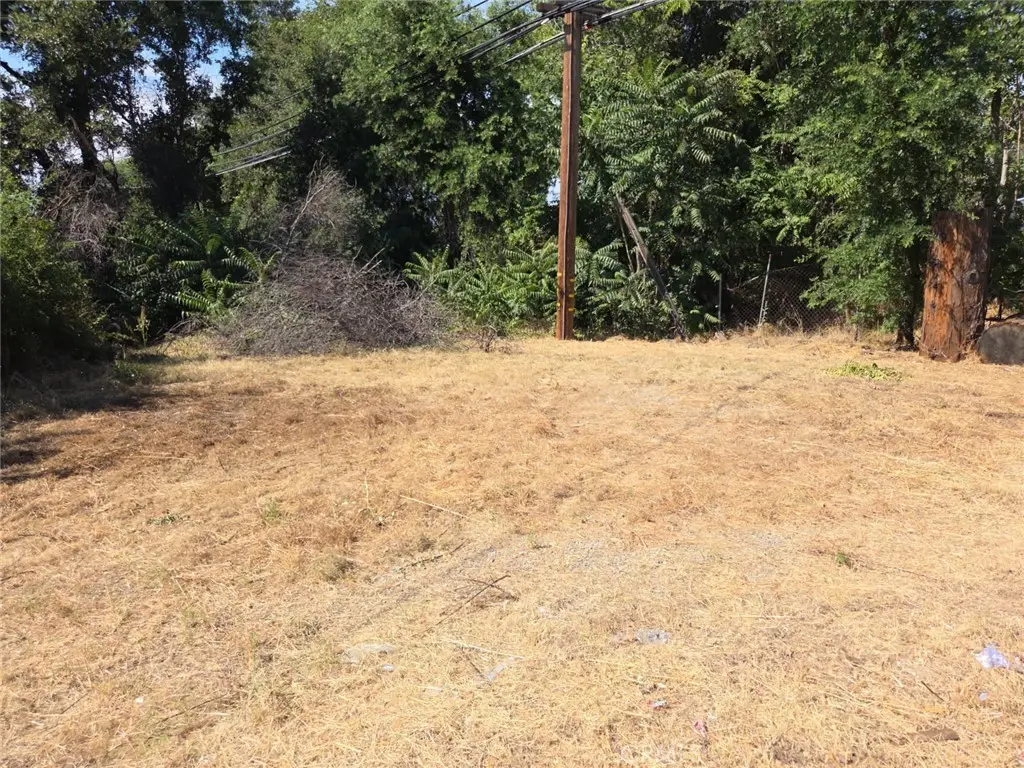
Listing remarks
This is your contractors dream. Creekside property, nestled in the trees and surroundings. Private, adjacent to South Main Self Storage facility. This property needs lots of TLC and is being sold as-is. See Andy for access - - -Manager at South Main Storage. A property inspection scheduled for this weekend
Key facts
- 0.37 acre lot
- Built 1950
- Listed 10 days
Property features AI
Finance
- HOA & community: Community offers fishing
Exterior
- Utilities: Septic tank; Private water; Electricity connected; Water connected
- Home design: Single-story house; Front entry; No accessory dwelling unit
- Construction: Other roof type; Year built per assessor; No common walls
- Exterior features: Patio; Fence (see remarks); Creek on the lot; Lot characterized as 0–1 unit per acre
Interior
- Kitchen: No built-in appliances listed (see remarks for eating area)
- Bedrooms: 1 bedroom on the main level
- Bathrooms: 1 full bathroom on the main level
- Heating & cooling: Has cooling (details in remarks)
- Interior features: One-level home with front entry; Has cooling (see remarks); Fixer condition with additions/alterations; Has view
- Laundry & utility: Laundry available (see remarks)
Neighborhood map
What this means for you Summary
Snapshot
- This is a 3-bed/1.0-bath single-family listed at $196k.
Deal economics
- At list price, monthly cash flow is $119 ($1k/yr) — positive.
- The deal already cash-flows at list — no discount required.
- To meet the 1% rule (rent ≥ 1% of price), the offer needs to be $170k (13.0% below list).
- Recommended offer: $170k (13.0% below list) — sets the bar for 1% rule.
- Cap rate 7.0% vs local median 3.6% in Red Bluff — top-decile yield for the area; either an underpriced asset or a hidden risk that comps aren't pricing in. Stress-test before assuming the spread holds.
Location & tenants
- Location reads 58/100 on livability (#698 in CA) — a working-class tenant base; expect higher turnover. Strengths: health & safety A+, housing A-; Watch: cost of living D, crime F, amenities F.
- Red Bluff Union Elementary (town): math 20% / reading 31% proficiency, ranked #418 of 517 in CA (top 81%) — low school quality limits family demand, transient renter base, plan for 1-2y turnover; 66% free/reduced lunch — lower-income household profile, screen leases tightly.
- Zoned schools: William M. Metteer Elementary (math 17% / reading 27%, grade F, #1,179 of 1,571 statewide, top 78%, 463 students, 88% FRL); Vista Preparatory Academy (math 17% / reading 34%, grade F, #260 of 498 statewide, top 54%, 549 students, 82% FRL); Red Bluff High (math 26% / reading 36%, grade F, #702 of 1,170 statewide, top 61%, 1,618 students, 65% FRL).
- Market conditions: Rents flat; 263 active listings in the ZIP; 1 comparable units currently listed for rent nearby; 186 units permitted in Tehama County in 2024 (0 in 5+ unit buildings).
- This rent runs 31% of the median local income ($66k/yr) — at the standard rent-burdened threshold; future hikes will face affordability resistance.
Forward outlook
- Local home prices are declining (-3.0%/yr); year-one equity from $1k of loan paydown is wiped out by about $6k of value loss. Plan a longer hold.
- Tehama County population projected at -14% by 2050 — secular population decline; favor cash flow + early exit over multi-decade hold.
Negotiation context
- Only 11 days on market — expect competitive offers; lowballing is unlikely to land.
Risks & watch-outs
- Watch-outs: built in 1950 — expect roof / HVAC / electrical / plumbing capex.
Questions for the listing agent
- Built in 1950 — when were the roof, HVAC, electrical panel, plumbing, and water heater last replaced?
- Is there a deadline driving the sale (1031 exchange, divorce, estate, relocation)? That informs how much negotiation room exists.
- Crime grade is F in this area — have there been break-ins, vandalism, or insurance claims at this property in the last 3 years? What carrier currently insures it and at what premium?
- What's the average days-on-market for RENTAL listings here right now (not sales)? A rising rental-DOM trend means longer vacancies and softer asking-rent achievability than the comps imply.
- What's the recent tenant-quality profile in this submarket — average credit score on applications, eviction rate, late-payment / NSF rate, and stable-employment percentage? A property-management company in the area should have these aggregated.
- How much new for-sale + rental construction is in the pipeline within 1–3 miles? Heavy new supply typically softens prices + rents 12–24 months out; constrained supply supports both.
Investment metrics
- 1% rule
- 0.87% ✗
- Cap rate
- 7.02%
- Cash-on-cash
- 2.60%
- DSCR
- 1.12
- GRM
- 9.6
CMA / ARV
- ARV (on-the-fly)
- $348,600
- Comps found
- 1
Show comp detail 1 sale within ~0.75 mi
| Address | Dist | Beds/Ba | Sqft | Sold | Price | $/sf | Match |
|---|---|---|---|---|---|---|---|
| 22031 Fern Ave | 0.73mi | 3/2.0 | 1,266 (-10%) | 2mo | $314,900 | $249 | 44 |
Match score weights: distance 35% · size 25% · config 20% · recency 20%. Top-matched comps best support the ARV.
Projected returns pro-forma
-3.0% appreciation · 0.98% rent growth · sell at horizon
- IRR
- -14.3%
- Equity multiple
- 0.50×
- Total profit
- $-27,622
- Equity at exit
- $29,208
- IRR
- -8.9%
- Equity multiple
- 0.49×
- Total profit
- $-27,900
- Equity at exit
- $16,937
Cash invested: $54,849 (down + closing). Projections, not guarantees.
Landlord ↔ Tenant lean methodology
- Overall (STATE)
- 18 Strongly Tenant-Friendly
- State California
- 18 Strongly Tenant-Friendly · D+13
- County
- — inherits STATE
- City
- — inherits STATE
ZIP-level market 96080
- Rents YoY
- 1.0%
- Active inventory
- 263
- Price-to-rent
- 9.6×
Monthly cashflow live
- Estimated rent
- $1,705 medium interval (Pro) →
- Mortgage (P&I)
- −$1,027
- Tax from tax record
- −$119 /mo · $1,427/yr
- Insurance
- −$82
- HOA
- −$0
- Lot rent
- −$0
- Vacancy / Maint / Mgmt
- −$358
- Net cashflow
- $119
Break-even live
Sensitivity live
| Price | -10% $230 | -5% $174 | +0% $119 | +5% $63 | +10% $8 |
|---|---|---|---|---|---|
| Rent | -10% $-16 | -5% $51 | +0% $119 | +5% $186 | +10% $253 |
| Rate | -1.0pp $217 | -0.5pp $169 | base $119 | +0.5pp $68 | +1.0pp $16 |
UW: 25.0% down · 7.5% · 30yr · 1.5% tax · 5.0% vac · 8.0% maint · 8.0% mgmt
Financing live
Cash to close
- Down payment
- $48,972
- Closing costs
- $5,877
- Reserves months
- —
- Total cash needed
- —
Loan-product check · same deal, 3 products live
Conventional
25% down · 7.5% · 30yr
- Down + closing
- —
- Monthly P&I
- —
- Monthly cashflow
- —
- DSCR
- —
- Eligible?
- —
Personal DTI + credit; lowest rate.
DSCR
20% down · 8.5% · 30yr
- Down + closing
- —
- Monthly P&I
- —
- Monthly cashflow
- —
- DSCR
- —
- Eligible?
- —
No personal income docs; deal must DSCR.
Hard money
10% down · 12.0% · 12mo
- Down + closing
- —
- Monthly P&I
- —
- Monthly cashflow
- —
- DSCR
- —
- Eligible?
- —
Short-term bridge; refi at stabilization.
Rent comps 1 comps
| Address | Beds | Baths | Sqft | Rent | $/sqft | DOM | Units | Dist |
|---|---|---|---|---|---|---|---|---|
| 1261 S Jackson St Unit A Red Bluff, CA | 2.0 | 1.5 | 1000 | $1,500 | $1.50 | 15d | 1 | 1.43mi |
Listing history 11 events
-
2026-06-22days on market $195,888 Active 11 DOM
-
2026-06-21days on market $195,888 Active 10 DOM
-
2026-06-19days on market $195,888 Active 8 DOM
-
2026-06-18remarks 308-char remark
-
2026-06-18days on market $195,888 Active 7 DOM
-
2026-06-17days on market $195,888 Active 6 DOM
-
2026-06-16days on market $195,888 Active 5 DOM
-
2026-06-15days on market $195,888 Active 4 DOM
-
2026-06-14days on market $195,888 Active 2 DOM
-
2026-06-12remarks 258-char remark
-
2026-06-12$195,888 Active 1 DOM
ⓘ Source: listings_history table (triggers on properties + properties_extension) + one-shot
backfill from property_details.listing_events for pre-trigger history.
Tax reassessment forecast CA · Resets to sale price
- Current annual tax
- $1,427 · $119/mo
- Projected year-2 tax
- $1,489 · $124/mo
- Expected delta
- +$61/yr (+$5/mo · 4.3%)
ⓘ Screening estimate from a state-policy table — verify with the county assessor before closing.
Nearby sold comps map
Loading sold comps map…
Walkable amenities ~0.75 mi
Loading nearby amenities…
Taxation est. · year 1
- Rental income
- $20,455
- − Mortgage interest
- −$10,973
- − Property taxes
- −$1,427
- − Insurance
- −$979
- − Repairs & maintenance
- −$1,636
- − Management
- −$1,636
- − Depreciation
- −$5,699
- Taxable loss
- −$1,896
- Est. tax savings @ 24.0%
- +$455
- After-tax cash flow
- $1,881/yr
For passive investors: Depreciation is non-cash, so a rental often shows a tax loss while cash-flowing — sheltering income. Rental losses are passive: they offset passive income freely, and up to $25,000/yr can offset ordinary (W-2) income if you actively participate and your MAGI is under $100k (phasing out to $0 by $150k); unused losses carry forward. On sale, claimed depreciation is recaptured at up to 25%, and gains may owe capital-gains tax (a 1031 exchange can defer both). Figures are a year-1 estimate at your 24.0% rate — not tax advice; consult a CPA.
Schools (NCES district)
- District
- Red Bluff Union Elementary
- NCES district ID
- 0631980
- Math proficiency
- 20% ▼ -15.00%
- Reading proficiency
- 31% ▼ -9.00%
- Median HH income
- $37,109
- Composite
- 21.2/100
- National rank
- #8416
- State rank
- #418 of 517 in CA
Livability — Red Bluff
- Score
- 58/100
- State rank
- #698
- US rank
- #21144
Category grades
Schools grade is shown separately in the Schools card above.
Census & demographics
- County
- Tehama County · 31,554 people
- City population
- 31,554
- Metro
- Red Bluff, CA
- Population (ZIP)
- 31,554
- Household income
- $66,076
- Rent vs Own
- Severe rent burden
- 981.0
Population outlook (Tehama County) Hauer SSP2
- Today (2025)
- 61,058 people
- By 2030
- 59,493 · -2.6%
- By 2040
- 56,076 · -8.2%
- By 2050
- 52,372 · -14.2%
- By 2075
- 43,895 · -28.1%
- By 2100
- 34,186 · -44.0%
Race, ethnicity, and origin ACS 2023
- Neighborhood character
- Predominantly White (71%)
- Race & ethnicity
- White 71% Hispanic / Latino 19% Two or more races 13% Native American 3% Black 2% Asian 1%
- Hispanic origin (detail)
- Mexican 17%
- Common ancestry
- Italian 2% Slovak 2% Lithuanian 2%
- Foreign-born
- 6% · Canada, Vietnam
- Languages at home
- 89% English-only · Spanish 9%
Political lean MEDSL · Tehama
- 2024 margin
- Solid R (+41.8) · D 27.9% · R 69.7% · Other 2.3%
- 2008→2024 swing
- -17.7pp toward R · 2008: -24.1pp · 2024: -41.8pp
- All cycles
- 2024: R+41.8 2020: R+35.6 2016: R+36.8 2012: R+27.4 2008: R+24.1
Not yet ingested
- Civics
- —
Market trends
- HPI YoY
- ▼ -139.80%
- Current HPI
- 246.877
- Rent YoY
- ▲ 0.98%
- Metro
- Red Bluff, CA
- State GDP YoY
- ▲ 3.21%
- F500 in state
- 116
Industry mix (Fortune 500 HQ in CA)
| Industry | F500 HQs | Revenue |
|---|---|---|
| Technology | 27 | $1,492B |
|
||
| Financial Services | 3 | $174B |
|
||
| Retail | 3 | $44B |
|
||
| Insurance | 3 | $26B |
|
||
| Media / Entertainment | 2 | $115B |
|
||
| Pharmaceuticals / Biotech | 2 | $62B |
|
||
Price history
-25.8% since first listed4 events — show timeline
- 2026-06-11 Price Changed $195,888 CRMLS
- 2026-06-11 Listed $195,999 CRMLS
- 2019-01-04 Sold (Public Records) $3,200,000 Public Records
- 2007-11-19 Sold (Public Records) $264,000 Public Records
Property tax history
-1.2%/yrLatest (2025): $1,427 · +2.3% YoY. Source: county tax records.
Cash-flow waterfall
monthlySold comps — $/sqft
last 12 mo · ≤1 miLoading sold comps…