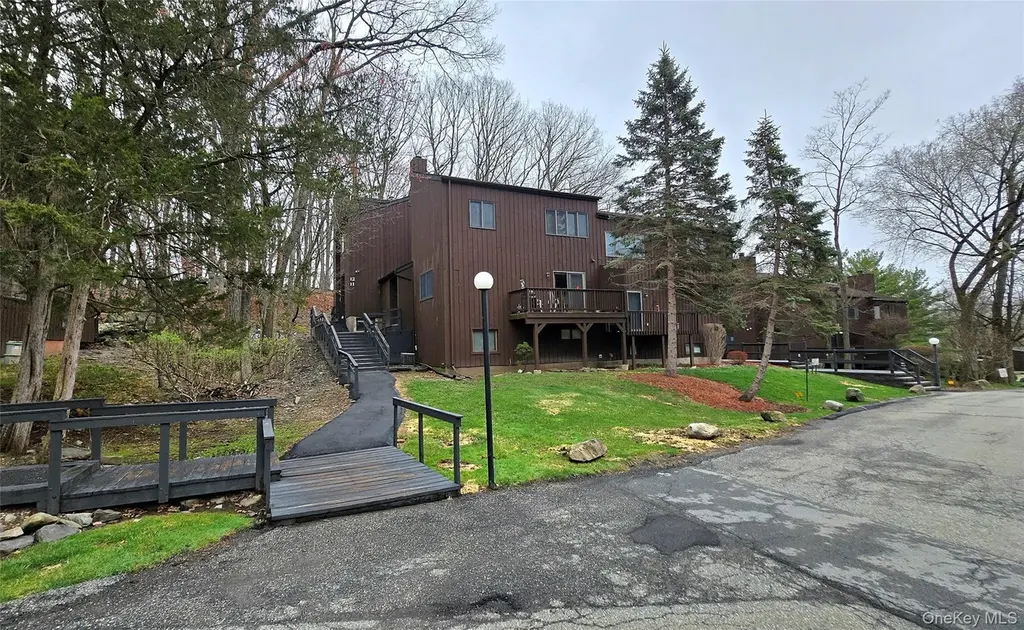
12 Redwood Dr · Woodbury, NY
Flood risk 1/10 · Minimal
- FEMA flood zone
- X (unshaded)
- Chance of flooding over 30 yrs
- 0.0%
- Est. flood insurance / yr
- $507 – $1,088
Fire risk 3/10 · Minor
- Est. fire insurance / yr
- $691 – $1,283
Heat risk 5/10 · Moderate
- Hot days now (above 96°F)
- 7 days/yr
- Hot days in 30 yrs
- 17 days/yr
Wind risk 4/10 · Minor
- Chance of severe wind over 30 yrs
- 17.0%
Air-quality risk 2/10 · Minimal
- Unhealthy air days now
- 1 days/yr
- Unhealthy air days in 30 yrs
- 2 days/yr
Risk factors via First Street. Map © Google.
Why this score? — see what drove the C- grade
The composite is a weighted blend of 9 inputs, each scored 0–100. Each bar is that input's sub-score; the figure is the points it added to the 100-point composite (weight × sub-score).
- ARV discount +15.0/15.0
- Cash flow +12.4/30.0
- 1% rule +6.5/10.0
- Schools +5.0/10.0
- DSCR +3.7/10.0
- Livability +3.3/5.0
- Rent growth +2.5/5.0
- Condition / age +2.5/5.0
- Appreciation +0.0/10.0
$294,925
🖨 Deal sheet 📄 Offer letter ✓ Due diligence
Listing remarks MLS
Roomy 3 Bedroom townhome in Timber Ridge, offering an open layout on the first floor. Living Room has sliding glass doors to a private deck facing the woods. Second floor offers 3 good size bedrooms and a full hallway bath. The lower level has mechanicals, laundry room with potential for additional living space, over 600 square feet. This is a short sale, third party approval needed. Realtor in charge of negotiations with bank.
Key facts
- Private deck
- Laundry room
- Open layout
Tags
Neighborhood map
What this means for you Summary
Snapshot
- This is a 3-bed/1.5-bath townhouse listed at $295k.
Deal economics
- At list price, monthly cash flow is $-51 ($-612/yr) — negative.
- To cash-flow at today's rent, offer at most $286k (3.1% below list).
- Meets the 1% rule at list price ($3k rent vs $295k).
- Recommended offer: $277k (6.0% below list) — sets the bar for market timing.
- Cap rate 6.1% vs local median 1.9% in Woodbury — top-decile yield for the area; either an underpriced asset or a hidden risk that comps aren't pricing in. Stress-test before assuming the spread holds.
Location & tenants
- Location reads 66/100 on livability (#663 in NY) — a middle-class / working-renter tenant base. Strengths: employment A+, housing A+, schools A-; Watch: amenities F, commute F, cost of living F.
- Monroe-Woodbury Central School District (suburban): math 50% / reading 56% proficiency, ranked #250 of 590 in NY (top 42%) — acceptable for families but not a draw, mixed tenant base, ~2y average lease; only 15% free/reduced lunch — higher-income household profile.
- Market conditions: 82 active listings in the ZIP; 3 comparable units currently listed for rent nearby; rentals at typical pace (median 21d on market — plan ~3-4 weeks tenant-placement turnaround); high-income renter base; 1,746 units permitted in Orange County in 2024 (1,265 in 5+ unit buildings).
- This rent runs 34% of the median local income ($120k/yr) — at the standard rent-burdened threshold; future hikes will face affordability resistance.
Forward outlook
- Local home prices are declining (-3.0%/yr); year-one equity from $2k of loan paydown is wiped out by about $9k of value loss. Plan a longer hold.
Negotiation context
- It's been on market 73 days — a 6% lower offer ($277k) is reasonable based on typical stale-listing flexibility.
- 4 sale attempts since 26y ago; this cycle's ask is 18% above the opening price — seller raised mid-cycle; expect resistance to lowballs.
Risks & watch-outs
- Watch-outs: property tax is 3.0% of price.
- Climate carrying-cost: extreme-heat days projected 7→17/yr by 2055 (HVAC capex compounding) — expect insurance premiums to compound above CPI over the hold.
Questions for the listing agent
- What do current leases actually rent for vs. the listed asking? Can we see a recent rent roll and the last 12 months of T-12 income?
- It's been on market 73 days. Have you received any prior offers? Is the seller open to a 6% concession, seller financing, or rate buy-down credit?
- Property tax is high relative to price — has the assessment been appealed recently, and will the sale trigger a re-assessment?
- What does the HOA fee cover, when was the last increase, and are there any pending special assessments or reserve-fund shortfalls?
- Why hasn't it sold? Are there any deal-killer items the seller is aware of (foundation, flood, title, zoning, code violations)?
- Is there a deadline driving the sale (1031 exchange, divorce, estate, relocation)? That informs how much negotiation room exists.
- Schools are A-rated — typically a magnet for longer-tenancy family renters. What's the average tenant stay here, and is there a school-zone premium baked into asking?
- What's the average days-on-market for RENTAL listings here right now (not sales)? A rising rental-DOM trend means longer vacancies and softer asking-rent achievability than the comps imply.
- What's the recent tenant-quality profile in this submarket — average credit score on applications, eviction rate, late-payment / NSF rate, and stable-employment percentage? A property-management company in the area should have these aggregated.
- How much new for-sale + rental construction is in the pipeline within 1–3 miles? Heavy new supply typically softens prices + rents 12–24 months out; constrained supply supports both.
Investment metrics
- 1% rule
- 1.15% ✓
- Cap rate
- 6.09%
- Cash-on-cash
- -0.74%
- DSCR
- 0.97
- GRM
- 7.2
CMA / ARV
- ARV (median comp)
- $364,205
- List price
- $294,925
- Delta
- -19.02%
- Verdict
- UNDERPRICED
- Comps
- 20 within 1.0 mi
Show comp detail 12 sales within ~0.75 mi
| Address | Dist | Beds/Ba | Sqft | Sold | Price | $/sf | Match |
|---|---|---|---|---|---|---|---|
| 6 Acorn Ct | 0.08mi | 2/1.5 (-1) | 1,388 (0%) | 19mo | $308,000 | $222 | 75 |
| 7 Ash Ct | 0.11mi | 3/3.0 | 1,380 (-1%) | 18mo | $400,000 | $290 | 72 |
| 27 Butternut Ct | 0.23mi | 2/2.0 (-1) | 1,380 (-1%) | 16mo | $403,000 | $292 | 68 |
| 7 Helene Cir | 0.31mi | 3/2.0 | 1,409 (+2%) | 18mo | $430,000 | $305 | 66 |
| 11 Plum Ct | 0.35mi | 3/2.5 | 1,363 (-2%) | 15mo | $425,000 | $312 | 64 |
| 16 Terra Ct | 0.06mi | 3/2.5 | 1,575 (+14%) | 16mo | $348,500 | $221 | 58 |
| 5 Fox Meadow Dr | 0.31mi | 3/3.5 | 1,505 (+8%) | 11mo | $485,000 | $322 | 54 |
| 6 Horizon Ct | 0.29mi | 3/2.5 | 1,569 (+13%) | 13mo | $485,000 | $309 | 50 |
| 8 Horizon Ct | 0.28mi | 3/2.5 | 1,569 (+13%) | 18mo | $460,000 | $293 | 46 |
| 3 Highview Ct | 0.35mi | 3/2.5 | 1,569 (+13%) | 18mo | $430,000 | $274 | 42 |
| 17 Rockridge Dr | 0.35mi | 2/2.5 (-1) | 1,569 (+13%) | 16mo | $415,000 | $264 | 39 |
| 8 Canyon Ct | 0.43mi | 3/2.5 | 1,569 (+13%) | 19mo | $430,000 | $274 | 38 |
Match score weights: distance 35% · size 25% · config 20% · recency 20%. Top-matched comps best support the ARV.
Projected returns pro-forma
-3.0% appreciation · 3.0% rent growth · sell at horizon
- IRR
- -17.3%
- Equity multiple
- 0.39×
- Total profit
- $-50,553
- Equity at exit
- $43,974
- IRR
- -9.0%
- Equity multiple
- 0.44×
- Total profit
- $-46,237
- Equity at exit
- $25,500
Cash invested: $82,579 (down + closing). Projections, not guarantees.
Landlord ↔ Tenant lean methodology
- Overall (STATE)
- 15 Strongly Tenant-Friendly
- State New York
- 15 Strongly Tenant-Friendly · D+10
- County
- — inherits STATE
- City
- — inherits STATE
ZIP-level market 10930
- Home prices YoY
- -15.8%
- Active inventory
- 82
- Price-to-rent
- 7.2×
Monthly cashflow live
- Estimated rent
- $3,405 medium interval (Pro) →
- Mortgage (P&I)
- −$1,547
- Tax from tax record
- −$737 /mo · $8,840/yr
- Insurance
- −$123
- HOA
- −$335
- Vacancy / Maint / Mgmt
- −$715
- Net cashflow
- $-51
Break-even live
UW: 25.0% down · 7.5% · 30yr · 1.5% tax · 5.0% vac · 8.0% maint · 8.0% mgmt
Financing live
Cash to close
- Down payment
- $73,731
- Closing costs
- $8,848
- Reserves months
- —
- Total cash needed
- —
Loan-product check · same deal, 3 products live
Conventional
25% down · 7.5% · 30yr
- Down + closing
- —
- Monthly P&I
- —
- Monthly cashflow
- —
- DSCR
- —
- Eligible?
- —
Personal DTI + credit; lowest rate.
DSCR
20% down · 8.5% · 30yr
- Down + closing
- —
- Monthly P&I
- —
- Monthly cashflow
- —
- DSCR
- —
- Eligible?
- —
No personal income docs; deal must DSCR.
Hard money
10% down · 12.0% · 12mo
- Down + closing
- —
- Monthly P&I
- —
- Monthly cashflow
- —
- DSCR
- —
- Eligible?
- —
Short-term bridge; refi at stabilization.
Rent comps 3 comps
| Address | Beds | Baths | Sqft | Rent | $/sqft | DOM | Units | Dist |
|---|---|---|---|---|---|---|---|---|
| 19 Mountainview Dr Highland Mills, NY | 4.0 | 1.5 | 1622 | $3,500 | $2.16 | 23d | 1 | 0.33mi |
| 8 Fillmore Ct Highland Mills, NY | 3.0 | 1.5 | 1836 | $3,300 | $1.80 | 21d | 1 | 0.40mi |
| 468 State Route 32 Highland Mills, NY | 3.0 | 2.5 | 1722 | $2,250 | $1.31 | 21d | 1 | 0.62mi |
HOA detail
- Monthly dues
- $335 · $4,020/yr
Listing history 27 events
-
2026-06-18days on market $294,925 Active 73 DOM
-
2026-06-17days on market $294,925 Active 72 DOM
-
2026-06-16days on market $294,925 Active 71 DOM
-
2026-06-15days on market $294,925 Active 70 DOM
-
2026-06-14days on market $294,925 Active 68 DOM
-
2026-06-10days on market $294,925 Active 65 DOM
-
2026-06-09days on market $294,925 Active 64 DOM
-
2026-06-08days on market $294,925 Active 63 DOM
-
2026-06-07days on market $294,925 Active 62 DOM
-
2026-06-05days on market $294,925 Active 59 DOM
-
2026-06-03days on market $294,925 Active 58 DOM
-
2026-06-02days on market $294,925 Active 57 DOM
-
2026-06-01days on market $294,925 Active 56 DOM
-
2026-05-31days on market $294,925 Active 55 DOM
-
2026-05-30days on market $294,925 Active 54 DOM
-
2026-04-30price $294,925 432-char remark
Show marketing remark (432 chars)
Roomy 3 Bedroom townhome in Timber Ridge, offering an open layout on the first floor. Living Room has sliding glass doors to a private deck facing the woods. Second floor offers 3 good size bedrooms and a full hallway bath. The lower level has mechanicals, laundry room with potential for additional living space, over 600 square feet. This is a short sale, third party approval needed. Realtor in charge of negotiations with bank.
-
2026-04-06$249,925 Active 432-char remark
Show marketing remark (432 chars)
Roomy 3 Bedroom townhome in Timber Ridge, offering an open layout on the first floor. Living Room has sliding glass doors to a private deck facing the woods. Second floor offers 3 good size bedrooms and a full hallway bath. The lower level has mechanicals, laundry room with potential for additional living space, over 600 square feet. This is a short sale, third party approval needed. Realtor in charge of negotiations with bank.
-
2024-07-05status Active
-
2024-04-12historical
-
2024-02-13status Pending
-
2023-10-13$299,000 Active
-
2004-09-15soldstatus $261,000
-
2000-07-07soldstatus $124,500
-
2000-06-20price $134,900
-
2000-06-20historical
-
2000-03-19$124,500
-
1987-05-18soldstatus $135,000
ⓘ Source: listings_history table (triggers on properties + properties_extension) + one-shot
backfill from property_details.listing_events for pre-trigger history.
Tax reassessment forecast NY · Partial reset (capped growth)
- Current annual tax
- $8,840 · $737/mo
- Projected year-2 tax
- $8,840 · $737/mo
- Expected delta
- $0/yr ($0/mo · 0.0%)
ⓘ Screening estimate from a state-policy table — verify with the county assessor before closing.
Climate risk First Street
- Flood 1/10 Low FEMA zone X (unshaded) · 0% chance over 30 yrs
- Wildfire 3/10 Moderate
- Heat 5/10 Major 7 d/yr ≥96°F today · 17 d/yr by 30 yrs out
- Wind 4/10 Moderate 17% chance of damaging wind over 30 yrs
- Air quality 2/10 Low 1 unhealthy d/yr today · 2 by 30 yrs out
Nearby sold comps map
Loading sold comps map…
Walkable amenities ~0.75 mi
Loading nearby amenities…
Taxation est. · year 1
- Rental income
- $40,864
- − Mortgage interest
- −$16,520
- − Property taxes
- −$8,840
- − Insurance
- −$1,475
- − Repairs & maintenance
- −$3,269
- − Management
- −$3,269
- − HOA
- −$4,020
- − Depreciation
- −$8,580
- Taxable loss
- −$5,109
- Est. tax savings @ 24.0%
- +$1,226
- After-tax cash flow
- $615/yr
For passive investors: Depreciation is non-cash, so a rental often shows a tax loss while cash-flowing — sheltering income. Rental losses are passive: they offset passive income freely, and up to $25,000/yr can offset ordinary (W-2) income if you actively participate and your MAGI is under $100k (phasing out to $0 by $150k); unused losses carry forward. On sale, claimed depreciation is recaptured at up to 25%, and gains may owe capital-gains tax (a 1031 exchange can defer both). Figures are a year-1 estimate at your 24.0% rate — not tax advice; consult a CPA.
Schools (NCES district)
- District
- Monroe-Woodbury Central School District
- NCES district ID
- 3619650
- Math proficiency
- 50% ▼ -17.00%
- Reading proficiency
- 56% ▼ -1.00%
- Median HH income
- $104,681
- Composite
- 50.48/100
- National rank
- #1855
- State rank
- #250 of 590 in NY
Livability — Woodbury
- Score
- 66/100
- State rank
- #663
- US rank
- #11975
Category grades
Schools grade is shown separately in the Schools card above.
Census & demographics
- Census place
- Woodbury, NY
- County
- Orange County · 267,004 people
- City population
- 9,402
- Metro
- Poughkeepsie-Newburgh-Middletown, NY
- Population (ZIP)
- 9,569
- Household income
- $120,098
- Rent vs Own
- Severe rent burden
- 104.0
Population outlook (Orange County) Hauer SSP2
- Today (2025)
- 379,830 people
- By 2030
- 378,955 · -0.2%
- By 2040
- 375,444 · -1.2%
- By 2050
- 369,311 · -2.8%
- By 2075
- 354,233 · -6.7%
- By 2100
- 318,150 · -16.2%
Race, ethnicity, and origin ACS 2023
- Neighborhood character
- Diverse neighborhood (Simpson 0.64)
- Race & ethnicity
- White 52% Hispanic / Latino 27% Two or more races 16% Black 10% Asian 6%
- Hispanic origin (detail)
- Mexican 6% Puerto Rican 14% Dominican 5%
- Common ancestry
- Romanian 7% Scandinavian 2% Slovak 2%
- Foreign-born
- 14% · Canada, China, Jamaica
- Languages at home
- 81% English-only · Spanish 11% German/W. Germanic 4% Other Indo-European 2%
Political lean MEDSL · Orange
- 2024 margin
- Lean R (+8.4) · D 45.8% · R 54.2%
- 2008→2024 swing
- -12.5pp toward R · 2008: 4.1pp · 2024: -8.4pp
- All cycles
- 2024: R+8.4 2020: R+0.2 2016: R+6.5 2012: D+5.2 2008: D+4.1
Not yet ingested
- Civics
- —
Market trends
- HPI YoY
- ▼ -50.76%
- Current HPI
- 271.431
- Rent YoY
- —
- Metro
- Poughkeepsie-Newburgh-Middletown, NY
- State GDP YoY
- ▲ 2.60%
- F500 in state
- 92
Industry mix (Fortune 500 HQ in NY)
| Industry | F500 HQs | Revenue |
|---|---|---|
| Financial Services | 10 | $950B |
|
||
| Consumer Goods | 9 | $162B |
|
||
| Insurance | 4 | $225B |
|
||
| Telecommunications | 2 | $144B |
|
||
| Pharmaceuticals | 2 | $112B |
|
||
| Media / Entertainment | 2 | $69B |
|
||
Price history
+118.5% since first listed12 events — show timeline
- 2026-04-30 Price Changed $294,925 OneKey® MLS as Distributed by MLS Grid
- 2026-04-06 Listed $249,925 OneKey® MLS as Distributed by MLS Grid
- 2024-07-05 Relisted — OneKey® MLS as Distributed by MLS Grid
- 2024-04-12 Listing Removed — OneKey® MLS as Distributed by MLS Grid
- 2024-02-13 Pending — OneKey® MLS as Distributed by MLS Grid
- 2023-10-13 Listed $299,000 OneKey® MLS as Distributed by MLS Grid
- 2004-09-15 Sold (Public Records) $261,000 Public Records
- 2000-07-07 Sold (MLS) $124,500 HGMLS
- 2000-06-20 Delisted — HGMLS
- 2000-06-20 Price Changed $134,900 HGMLS
- 2000-03-19 Listed $124,500 HGMLS
- 1987-05-18 Sold (Public Records) $135,000 Public Records
Property tax history
+0.4%/yrLatest (2025): $8,840 · -0.5% YoY. Source: county tax records.
Cash-flow waterfall
monthlySold comps — $/sqft
last 12 mo · ≤1 miLoading sold comps…