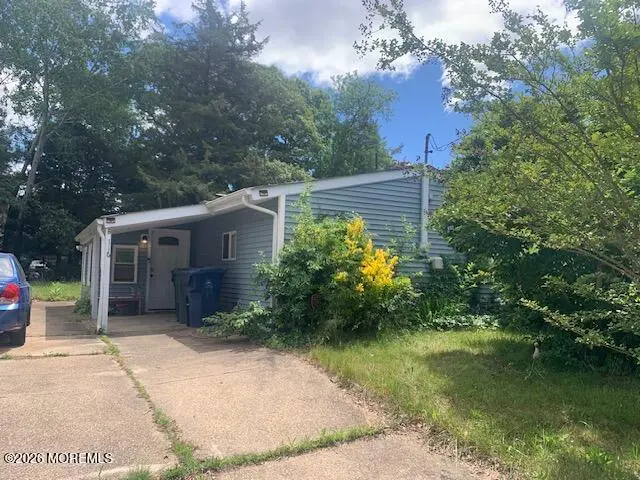
116 National Union Blvd · Mystic Island, NJ
Flood risk 4/10 · Minor
- FEMA flood zone
- X (shaded)
- Chance of flooding over 30 yrs
- 0.17%
- Est. flood insurance / yr
- $507 – $1,088
Fire risk 4/10 · Minor
- Est. fire insurance / yr
- $526 – $976
Heat risk 8/10 · Major
- Hot days now (above 99°F)
- 7 days/yr
- Hot days in 30 yrs
- 15 days/yr
Wind risk 8/10 · Major
- Chance of severe wind over 30 yrs
- 80.0%
Air-quality risk 3/10 · Minor
- Unhealthy air days now
- 2 days/yr
- Unhealthy air days in 30 yrs
- 3 days/yr
Risk factors via First Street. Map © Google.
Why this score? — see what drove the D+ grade
The composite is a weighted blend of 9 inputs, each scored 0–100. Each bar is that input's sub-score; the figure is the points it added to the 100-point composite (weight × sub-score).
- ARV discount +15.0/15.0
- Cash flow +12.5/30.0
- 1% rule +3.8/10.0
- DSCR +3.7/10.0
- Livability +3.1/5.0
- Schools +2.7/10.0
- Rent growth +2.5/5.0
- Condition / age +2.5/5.0
- Appreciation +0.0/10.0
$249,000
🖨 Deal sheet 📄 Offer letter ✓ Due diligence
Listing remarks MLS
Completely redone Ranch in the desirable Mystic Island section. Near Veterans Park and with in walking distance to the Marinas. This house features new windows , siding & roof. New HVAC done in 2021. New Shaker white cabinets and Quartz counter-top with the finishing touch of High end SS Appliances. This one will not last ! Book your showing Today.
Key facts
- Roof
- Ss steel appliances
- Ranch style home
Tags
Property features AI
Exterior
- Parking: No garage
- Utilities: Public sewer
- Home design: Property in Mystic Island / Little Egg Harbor area
- Exterior features: Shingle roof; Fee simple ownership
Interior
- Kitchen: Dishwasher; Microwave
- Bedrooms: 2 bedrooms
- Bathrooms: 1 full bathroom
- Heating & cooling: Forced air heating; Central air conditioning
- Interior features: Dishwasher; Light fixtures; Microwave; No fireplaces; No basement
Neighborhood map
What this means for you Summary
Snapshot
- This is a 2-bed/1.0-bath single-family listed at $249k.
Deal economics
- At list price, monthly cash flow is $-36 ($-436/yr) — negative.
- To cash-flow at today's rent, offer at most $243k (2.6% below list).
- To meet the 1% rule (rent ≥ 1% of price), the offer needs to be $220k (11.7% below list).
- Recommended offer: $220k (11.7% below list) — sets the bar for 1% rule.
- Cap rate 6.1% vs local median 2.6% in Mystic Island — top-decile yield for the area; either an underpriced asset or a hidden risk that comps aren't pricing in. Stress-test before assuming the spread holds.
Location & tenants
- Location reads 62/100 on livability (#455 in NJ) — a middle-class / working-renter tenant base. Strengths: housing A; Watch: employment C-, schools F, amenities F.
- Pinelands Regional School District (rural): math 14% / reading 46% proficiency, ranked #344 of 472 in NJ (top 73%) — families likely to look elsewhere, expect single-tenant / working-renter base with shorter leases.
- Market conditions: 296 active listings in the ZIP; 3 comparable units currently listed for rent nearby; rentals at typical pace (median 15d on market — plan ~3-4 weeks tenant-placement turnaround); solid renter incomes; 4,434 units permitted in Ocean County in 2024 (868 in 5+ unit buildings).
Forward outlook
- Local home prices are declining (-3.0%/yr); year-one equity from $2k of loan paydown is wiped out by about $7k of value loss. Plan a longer hold.
- Ocean County population projected to shrink 8% by 2050 — rents likely to lag national; underwrite the cash flow, not the appreciation.
Negotiation context
- It's been on market 16 days — a 2% lower offer ($245k) is reasonable based on typical stale-listing flexibility.
- 5 sale attempts since 29y ago; this cycle's ask has dropped $30k (11%) from the opening price — seller is motivated, your offer sets the floor, not the list.
- Current owner paid $200k; 24% above their basis — modest negotiation headroom, anchor on the comps not their cost.
Risks & watch-outs
- Climate carrying-cost: severe wind risk, 80% chance of damaging wind over 30y; extreme-heat days projected 7→15/yr by 2055 (HVAC capex compounding) — expect insurance premiums to compound above CPI over the hold.
Questions for the listing agent
- What do current leases actually rent for vs. the listed asking? Can we see a recent rent roll and the last 12 months of T-12 income?
- Is there a deadline driving the sale (1031 exchange, divorce, estate, relocation)? That informs how much negotiation room exists.
- Schools are F-rated, which usually means shorter tenancies and higher turnover. Who's the typical renter profile here, and what's been the actual vacancy rate?
- The area grade is low — what's the realistic commute time and amenity access for the typical tenant pool here? Any planned neighborhood developments (good or bad) we should know about?
- What's the average days-on-market for RENTAL listings here right now (not sales)? A rising rental-DOM trend means longer vacancies and softer asking-rent achievability than the comps imply.
- What's the recent tenant-quality profile in this submarket — average credit score on applications, eviction rate, late-payment / NSF rate, and stable-employment percentage? A property-management company in the area should have these aggregated.
- How much new for-sale + rental construction is in the pipeline within 1–3 miles? Heavy new supply typically softens prices + rents 12–24 months out; constrained supply supports both.
Investment metrics
- 1% rule
- 0.88% ✗
- Cap rate
- 6.12%
- Cash-on-cash
- -0.62%
- DSCR
- 0.97
- GRM
- 9.4
CMA / ARV
- ARV (on-the-fly)
- $323,856
- Comps found
- 12
Show comp detail 12 sales within ~0.75 mi
| Address | Dist | Beds/Ba | Sqft | Sold | Price | $/sf | Match |
|---|---|---|---|---|---|---|---|
| 9 Lake Saint Clair | 0.17mi | 2/2.0 | 960 (+3%) | 3mo | $529,900 | $552 | 81 |
| 303 Lake Champlain Dr | 0.25mi | 3/1.0 (+1) | 940 (+0%) | 4mo | $325,000 | $346 | 80 |
| 18 Lake Huron Dr | 0.20mi | 3/1.0 (+1) | 1,000 (+7%) | 1mo | $430,000 | $430 | 73 |
| 308 Falcon Dr | 0.21mi | 3/1.0 (+1) | 1,008 (+8%) | 3mo | $250,000 | $248 | 70 |
| 118 Lake Deerbrook Dr | 0.11mi | 3/1.0 (+1) | 1,040 (+11%) | 2mo | $335,000 | $322 | 70 |
| 21 S Dayton Dr | 0.61mi | 2/1.0 | 912 (-3%) | 0mo | $425,000 | $466 | 67 |
| 215 Lexington Dr | 0.66mi | 2/1.0 | 944 (+1%) | 2mo | $145,000 | $154 | 66 |
| 34 N Captains Dr | 0.58mi | 2/1.0 | 900 (-4%) | 2mo | $415,000 | $461 | 65 |
| 203 Lake Placid Dr | 0.50mi | 2/1.0 | 864 (-8%) | 2mo | $324,900 | $376 | 62 |
| 26 W Mullica Rd | 0.57mi | 3/2.0 (+1) | 986 (+5%) | 2mo | $302,000 | $306 | 54 |
| 233 Yorktowne Dr | 0.70mi | 2/2.0 | 986 (+5%) | 3mo | $249,900 | $253 | 52 |
| 425 National Union Blvd | 0.48mi | 3/1.0 (+1) | 1,056 (+13%) | 1mo | $338,000 | $320 | 51 |
Match score weights: distance 35% · size 25% · config 20% · recency 20%. Top-matched comps best support the ARV.
Projected returns pro-forma
-3.0% appreciation · 3.0% rent growth · sell at horizon
- IRR
- -17.3%
- Equity multiple
- 0.39×
- Total profit
- $-42,595
- Equity at exit
- $37,127
- IRR
- -9.2%
- Equity multiple
- 0.43×
- Total profit
- $-39,802
- Equity at exit
- $21,529
Cash invested: $69,720 (down + closing). Projections, not guarantees.
Landlord ↔ Tenant lean methodology
- Overall (STATE)
- 21 Tenant-Leaning
- State New Jersey
- 21 Tenant-Leaning · D+6
- County
- — inherits STATE
- City
- — inherits STATE
ZIP-level market 08087
- Active inventory
- 296
- Price-to-rent
- 9.4×
Monthly cashflow live
- Estimated rent
- $2,199 medium interval (Pro) →
- Mortgage (P&I)
- −$1,306
- Tax from tax record
- −$364 /mo · $4,367/yr
- Insurance
- −$104
- HOA
- −$0
- Vacancy / Maint / Mgmt
- −$462
- Net cashflow
- $-36
Break-even live
UW: 25.0% down · 7.5% · 30yr · 1.5% tax · 5.0% vac · 8.0% maint · 8.0% mgmt
Financing live
Cash to close
- Down payment
- $62,250
- Closing costs
- $7,470
- Reserves months
- —
- Total cash needed
- —
Loan-product check · same deal, 3 products live
Conventional
25% down · 7.5% · 30yr
- Down + closing
- —
- Monthly P&I
- —
- Monthly cashflow
- —
- DSCR
- —
- Eligible?
- —
Personal DTI + credit; lowest rate.
DSCR
20% down · 8.5% · 30yr
- Down + closing
- —
- Monthly P&I
- —
- Monthly cashflow
- —
- DSCR
- —
- Eligible?
- —
No personal income docs; deal must DSCR.
Hard money
10% down · 12.0% · 12mo
- Down + closing
- —
- Monthly P&I
- —
- Monthly cashflow
- —
- DSCR
- —
- Eligible?
- —
Short-term bridge; refi at stabilization.
Rent comps 3 comps
| Address | Beds | Baths | Sqft | Rent | $/sqft | DOM | Units | Dist |
|---|---|---|---|---|---|---|---|---|
| 32 Pin Oak Ln Little Egg Harbor Twp, NJ | 3.0 | 1.5 | 1000 | $2,550 | $2.55 | 1d | 1 | 0.75mi |
| 8 Scotch Pine Dr #186 Little Egg Harbor Twp, NJ | 1.0 | 1.0 | 680 | $1,600 | $2.35 | 15d | 1 | 0.79mi |
| 12 Timberline Dr Little Egg Harbor Twp, NJ | 2.0 | 1.5 | 943 | $2,250 | $2.39 | 24d | 1 | 1.33mi |
Listing history 12 events
-
2026-06-17status $249,000 Pending 16 DOM
-
2026-06-17days on market $249,000 Active 16 DOM
-
2026-06-16days on market $249,000 Active 15 DOM
-
2026-06-15days on market $249,000 Active 14 DOM
-
2026-06-13days on market $249,000 Active 12 DOM
-
2026-06-09days on market $249,000 Active 8 DOM
-
2026-06-08days on market $249,000 Active 7 DOM
-
2026-06-07pricedays on market $249,000 Active 6 DOM
-
2026-06-04days on market $279,000 Active 3 DOM
-
2026-06-03days on market $279,000 Active 2 DOM
-
2026-06-02remarks 306-char remark
-
2026-06-02$279,000 Active 1 DOM
ⓘ Source: listings_history table (triggers on properties + properties_extension) + one-shot
backfill from property_details.listing_events for pre-trigger history.
Tax reassessment forecast NJ · Partial reset (capped growth)
- Current annual tax
- $4,367 · $364/mo
- Projected year-2 tax
- $5,284 · $440/mo
- Expected delta
- +$916/yr (+$76/mo · 21.0%)
ⓘ Screening estimate from a state-policy table — verify with the county assessor before closing.
Climate risk First Street
- Flood 4/10 Moderate FEMA zone X (shaded) · 17% chance over 30 yrs
- Wildfire 4/10 Moderate
- Heat 8/10 Severe 7 d/yr ≥99°F today · 15 d/yr by 30 yrs out
- Wind 8/10 Severe 80% chance of damaging wind over 30 yrs
- Air quality 3/10 Moderate 2 unhealthy d/yr today · 3 by 30 yrs out
Nearby sold comps map
Loading sold comps map…
Walkable amenities ~0.75 mi
Loading nearby amenities…
Taxation est. · year 1
- Rental income
- $26,387
- − Mortgage interest
- −$13,948
- − Property taxes
- −$4,367
- − Insurance
- −$1,245
- − Repairs & maintenance
- −$2,111
- − Management
- −$2,111
- − Depreciation
- −$7,244
- Taxable loss
- −$4,638
- Est. tax savings @ 24.0%
- +$1,113
- After-tax cash flow
- $678/yr
For passive investors: Depreciation is non-cash, so a rental often shows a tax loss while cash-flowing — sheltering income. Rental losses are passive: they offset passive income freely, and up to $25,000/yr can offset ordinary (W-2) income if you actively participate and your MAGI is under $100k (phasing out to $0 by $150k); unused losses carry forward. On sale, claimed depreciation is recaptured at up to 25%, and gains may owe capital-gains tax (a 1031 exchange can defer both). Figures are a year-1 estimate at your 24.0% rate — not tax advice; consult a CPA.
Schools (NCES district)
- District
- Pinelands Regional School District
- NCES district ID
- 3413000
- Math proficiency
- 14% ▼ -20.00%
- Reading proficiency
- 46% ▼ -7.00%
- Median HH income
- $59,396
- Composite
- 26.97/100
- National rank
- #7075
- State rank
- #344 of 472 in NJ
Livability — Mystic Island
- Score
- 62/100
- State rank
- #455
- US rank
- #17110
Category grades
Schools grade is shown separately in the Schools card above.
Census & demographics
- Census place
- Mystic Island, NJ
- County
- Ocean County · 439,426 people
- Metro
- New York-Newark-Jersey City, NY-NJ-PA
- Population (ZIP)
- 25,342
- Household income
- $91,677
- Rent vs Own
- Severe rent burden
- 519.0
Population outlook (Ocean County) Hauer SSP2
- Today (2025)
- 586,991 people
- By 2030
- 581,403 · -1.0%
- By 2040
- 564,913 · -3.8%
- By 2050
- 538,149 · -8.3%
- By 2075
- 468,845 · -20.1%
- By 2100
- 350,297 · -40.3%
Race, ethnicity, and origin ACS 2023
- Neighborhood character
- Predominantly White (86%)
- Race & ethnicity
- White 86% Hispanic / Latino 6% Two or more races 6% Black 3% Asian 1%
- Hispanic origin (detail)
- Mexican 1% Puerto Rican 2%
- Common ancestry
- Romanian 6% Slovak 2% Portuguese 2%
- Foreign-born
- 3% · Canada
- Languages at home
- 95% English-only · Spanish 2% Other Indo-European 1% German/W. Germanic 1%
Political lean MEDSL · Ocean
- 2024 margin
- Solid R (+36.0) · D 31.4% · R 67.4% · Other 1.2%
- 2008→2024 swing
- -17.6pp toward R · 2008: -18.4pp · 2024: -36.0pp
- All cycles
- 2024: R+36.0 2020: R+28.7 2016: R+34.0 2012: R+17.7 2008: R+18.4
Not yet ingested
- Civics
- —
Market trends
- HPI YoY
- ▼ -243.86%
- Current HPI
- 340.4378
- Rent YoY
- —
- Metro
- New York-Newark-Jersey City, NY-NJ-PA
- State GDP YoY
- ▲ 2.05%
- F500 in state
- 34
Industry mix (Fortune 500 HQ in NJ)
| Industry | F500 HQs | Revenue |
|---|---|---|
| Consumer Goods | 3 | $31B |
|
||
| Pharmaceuticals | 2 | $153B |
|
||
| Technology | 2 | $21B |
|
||
| Insurance | 2 | $20B |
|
||
| Healthcare | 2 | $19B |
|
||
| Financial Services | 1 | $70B |
|
||
Price history
+595.8% since first listed17 events — show timeline
- 2026-06-01 Listed $279,000 MOMLS
- 2021-05-07 Sold (Public Records) $200,000 Public Records
- 2021-04-16 Sold (MLS) $200,000 MOMLS
- 2021-01-20 Pending — MOMLS
- 2021-01-17 Listed $189,900 MOMLS
- 2020-11-05 Sold (Public Records) $82,500 Public Records
- 2020-10-21 Sold (MLS) $82,500 BRIGHT MLS
- 2020-10-21 Sold (MLS) $82,500 MOMLS
- 2020-09-19 Pending — BRIGHT MLS
- 2020-09-19 Pending — MOMLS
- 2020-08-12 Listed $95,000 BRIGHT MLS
- 2020-08-12 Listed $95,000 MOMLS
- 1997-12-30 Sold (Public Records) $55,000 Public Records
- 1997-12-18 Sold (MLS) $55,000 MOMLS
- 1997-10-23 Delisted — MOMLS
- 1997-09-24 Listed $60,000 MOMLS
- 1983-11-01 Sold (Public Records) $40,100 Public Records
Property tax history
+3.4%/yrLatest (2025): $4,367 · +10.8% YoY. Source: county tax records.
Cash-flow waterfall
monthlySold comps — $/sqft
last 12 mo · ≤1 miLoading sold comps…