1784 Ebenezer Rd Unit D · Rock Hill, SC
Flood risk 1/10 · Minimal
- FEMA flood zone
- X (unshaded)
- Chance of flooding over 30 yrs
- 0.0%
- Est. flood insurance / yr
- $507 – $1,088
Fire risk 3/10 · Minor
- Est. fire insurance / yr
- $783 – $1,453
Heat risk 6/10 · Moderate
- Hot days now (above 105°F)
- 7 days/yr
- Hot days in 30 yrs
- 16 days/yr
Wind risk 6/10 · Moderate
- Chance of severe wind over 30 yrs
- 27.0%
Air-quality risk 3/10 · Minor
- Unhealthy air days now
- 3 days/yr
- Unhealthy air days in 30 yrs
- 3 days/yr
Risk factors via First Street. Map © Google.
Why this score? — see what drove the D grade
The composite is a weighted blend of 9 inputs, each scored 0–100. Each bar is that input's sub-score; the figure is the points it added to the 100-point composite (weight × sub-score).
- Cash flow +11.9/30.0
- ARV discount +7.5/15.0
- 1% rule +5.9/10.0
- DSCR +3.5/10.0
- Schools +3.5/10.0
- Livability +3.5/5.0
- Condition / age +2.5/5.0
- Rent growth +2.4/5.0
- Appreciation +0.0/10.0
$169,900
🖨 Deal sheet 📄 Offer letter ✓ Due diligence
Listing remarks
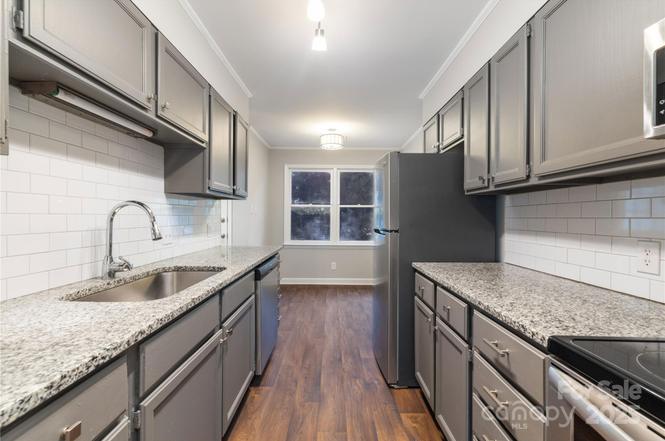
Welcome to this beautifully updated 3-bedroom, 2-bath condo located just minutes from shopping, dining, and Winthrop University. This inviting home features a completely renovated kitchen with sleek granite countertops, a modern tile backsplash, and stainless steel appliances that elevate the space. Luxury vinyl plank flooring flows throughout the main level, and both bathrooms have been tastefully refreshed. The open living and dining area offers great natural light and leads to a private patio – perfect for relaxing or entertaining. Ideal for homeowners or investors, this move-in ready unit combines modern touches with a prime location.
Key facts
- Renovated kitchen
- Private patio
- Granite countertops
Tags
Property features AI
Finance
- HOA & community: Mandatory HOA (New Town) with monthly fee of $237.90
Exterior
- Parking: Assigned parking
- Security: Carbon monoxide detector(s); Smoke detector(s)
- Utilities: City water; Public sewer
- Home design: Residential condominium; Site-built construction; One story; Entry level: 1
- Construction: Vinyl exterior; Slab foundation
- Exterior features: Paved road access; Publicly maintained road
Interior
- Kitchen: Dishwasher; Disposal; Electric range; Microwave; Refrigerator
- Bedrooms: 3 bedrooms on the main level
- Flooring: Vinyl flooring
- Bathrooms: 2 full bathrooms on the main level
- Heating & cooling: Heat pump heating; Central air conditioning
- Interior features: 8 total rooms; Living room fireplace; Carbon monoxide and smoke detectors
- Laundry & utility: Inside laundry in a laundry closet on the main level
Neighborhood map
What this means for you Summary
Snapshot
- This is a 3-bed/2.0-bath condo listed at $170k.
Deal economics
- At list price, monthly cash flow is $-44 ($-528/yr) — negative.
- To cash-flow at today's rent, offer at most $162k (4.6% below list).
- Meets the 1% rule at list price ($2k rent vs $170k).
- Recommended offer: $150k (12.0% below list) — sets the bar for market timing.
- Cap rate 6.0% vs local median 3.4% in Rock Hill — top-decile yield for the area; either an underpriced asset or a hidden risk that comps aren't pricing in. Stress-test before assuming the spread holds.
Location & tenants
- Location reads 70/100 on livability (#62 in SC) — a middle-class / working-renter tenant base. Strengths: cost of living A+, housing A+, health & safety A+; Watch: employment D+, crime D-, amenities D-.
- York 03 (urban): math 36% / reading 47% proficiency, ranked #32 of 80 in SC (top 40%) — families likely to look elsewhere, expect single-tenant / working-renter base with shorter leases.
- Zoned schools: Ebinport Elementary (math 22% / reading 32%, grade F, #421 of 597 statewide, top 73%, 459 students, 100% FRL); South Pointe High (math 47% / reading 77%, grade B-, #99 of 196 statewide, top 53%, 1,196 students, 60% FRL) — zoned schools average 80% FRL vs 49% district-wide (31 pts higher); higher-poverty schools than district average — tighter screening recommended.
- Market conditions: Rents soft (-0.2%/yr); 370 active listings in the ZIP; 27 comparable units currently listed for rent nearby; rentals at typical pace (median 24d on market — plan ~3-4 weeks tenant-placement turnaround); solid renter incomes; 2,550 units permitted in York County in 2024 (350 in 5+ unit buildings).
Forward outlook
- Local home prices are declining (-3.0%/yr); year-one equity from $1k of loan paydown is wiped out by about $5k of value loss. Plan a longer hold.
- York County population projected at +44% by 2050 — long-run rental-demand tailwind backs the buy-and-hold thesis.
Negotiation context
- It's been on market 314 days — a 12% lower offer ($150k) is reasonable based on typical stale-listing flexibility.
- 2 sale attempts; this cycle's ask has dropped $50k (23%) from the opening price — seller is motivated, your offer sets the floor, not the list.
- Current owner paid $75k; list at $170k implies a 127% gain — meaningful room to come down on a strong offer.
Risks & watch-outs
- Climate carrying-cost: major wind risk, 27% chance of damaging wind over 30y; extreme-heat days projected 7→16/yr by 2055 (HVAC capex compounding) — expect insurance premiums to compound above CPI over the hold.
Questions for the listing agent
- What do current leases actually rent for vs. the listed asking? Can we see a recent rent roll and the last 12 months of T-12 income?
- It's been on market 314 days. Have you received any prior offers? Is the seller open to a 12% concession, seller financing, or rate buy-down credit?
- Built in 1979 — when were the roof, HVAC, electrical panel, plumbing, and water heater last replaced?
- What does the HOA fee cover, when was the last increase, and are there any pending special assessments or reserve-fund shortfalls?
- Any open or pending special assessments — roof, HVAC, plumbing, elevator, façade? What's the per-unit balance and payoff schedule, and is the seller paying it off at close or rolling it to the buyer?
- Why hasn't it sold? Are there any deal-killer items the seller is aware of (foundation, flood, title, zoning, code violations)?
- Is there a deadline driving the sale (1031 exchange, divorce, estate, relocation)? That informs how much negotiation room exists.
- Schools are D-rated, which usually means shorter tenancies and higher turnover. Who's the typical renter profile here, and what's been the actual vacancy rate?
- Crime grade is D in this area — have there been break-ins, vandalism, or insurance claims at this property in the last 3 years? What carrier currently insures it and at what premium?
- The area grade is low — what's the realistic commute time and amenity access for the typical tenant pool here? Any planned neighborhood developments (good or bad) we should know about?
- What's the average days-on-market for RENTAL listings here right now (not sales)? A rising rental-DOM trend means longer vacancies and softer asking-rent achievability than the comps imply.
- What's the recent tenant-quality profile in this submarket — average credit score on applications, eviction rate, late-payment / NSF rate, and stable-employment percentage? A property-management company in the area should have these aggregated.
- How much new apartment / multifamily construction is in the pipeline within 1–3 miles? Heavy new supply (>2% of stock underway) typically softens rents 12–24 months out; light construction supports rent growth.
Investment metrics
- 1% rule
- 1.09% ✓
- Cap rate
- 5.98%
- Cash-on-cash
- -1.11%
- DSCR
- 0.95
- GRM
- 7.7
CMA / ARV
No comps found within radius.
Projected returns pro-forma
-3.0% appreciation · 0.0% rent growth · sell at horizon
- IRR
- -22.4%
- Equity multiple
- 0.25×
- Total profit
- $-35,515
- Equity at exit
- $25,333
- IRR
- -31.2%
- Equity multiple
- -0.15×
- Total profit
- $-54,513
- Equity at exit
- $14,690
Cash invested: $47,572 (down + closing). Projections, not guarantees.
Landlord ↔ Tenant lean methodology
- Overall (STATE)
- 90 Strongly Landlord-Friendly
- State South Carolina
- 90 Strongly Landlord-Friendly · R+6
- County
- — inherits STATE
- City
- — inherits STATE
ZIP-level market 29732
- Rents YoY
- -0.2%
- Active inventory
- 370
- Price-to-rent
- 7.7×
Monthly cashflow live
- Estimated rent
- $1,846 high interval (Pro) →
- Mortgage (P&I)
- −$891
- Tax from tax record
- −$304 /mo · $3,646/yr
- Insurance
- −$71
- HOA
- −$237
- Vacancy / Maint / Mgmt
- −$388
- Net cashflow
- $-44
Break-even live
UW: 25.0% down · 7.5% · 30yr · 1.5% tax · 5.0% vac · 8.0% maint · 8.0% mgmt
Financing live
Cash to close
- Down payment
- $42,475
- Closing costs
- $5,097
- Reserves months
- —
- Total cash needed
- —
Loan-product check · same deal, 3 products live
Conventional
25% down · 7.5% · 30yr
- Down + closing
- —
- Monthly P&I
- —
- Monthly cashflow
- —
- DSCR
- —
- Eligible?
- —
Personal DTI + credit; lowest rate.
DSCR
20% down · 8.5% · 30yr
- Down + closing
- —
- Monthly P&I
- —
- Monthly cashflow
- —
- DSCR
- —
- Eligible?
- —
No personal income docs; deal must DSCR.
Hard money
10% down · 12.0% · 12mo
- Down + closing
- —
- Monthly P&I
- —
- Monthly cashflow
- —
- DSCR
- —
- Eligible?
- —
Short-term bridge; refi at stabilization.
Rent comps 27 comps
| Address | Beds | Baths | Sqft | Rent | $/sqft | DOM | Units | Dist |
|---|---|---|---|---|---|---|---|---|
| 1837 Ebenezer Rd Rock Hill, SC | 2.0 | 1.5 | 1150 | $1,350 | $1.17 | 24d | 1 | 0.19mi |
| 1933 Ebenezer Rd Rock Hill, SC | 2.0 | 1.5 | 953 | $1,450 | $1.52 | 24d | 1 | 0.33mi |
| 180 Glenwood Dr Unit 1612 Rock Hill, SC | 2.0 | 2.0 | 1275 | $1,450 | $1.14 | 24d | 1 | 0.48mi |
| 650 Melville Dr Rock Hill, SC | 3.0 | 2.5 | 1759 | $2,250 | $1.28 | 24d | 1 | 0.49mi |
| 650 Melville Dr Rock Hill, SC | 3.0 | 2.5 | 1759 | $2,250 | $1.28 | 4d | 1 | 0.49mi |
| 648 Melville Dr Rock Hill, SC | 3.0 | 2.5 | 1759 | $2,250 | $1.28 | 24d | 1 | 0.51mi |
| 565 Stockton Way Rock Hill, SC | 3.0 | 2.5 | 1770 | $3,500 | $1.98 | 24d | 1 | 0.51mi |
| 1004 Kensington Sq Rock Hill, SC | 2.0 | 1.5 | 990 | $1,345 | $1.36 | 22d | 4 | 0.60mi |
| 285 Herlong Ave Unit F Rock Hill, SC | 2.0 | 1.5 | 992 | $1,325 | $1.34 | 24d | 1 | 0.62mi |
| 1750 Ridgefield Ct Rock Hill, SC | 3.0 | 2.0 | 1676 | $2,100 | $1.25 | 22d | 1 | 0.73mi |
| 308 Voldemort St Rock Hill, SC | 3.0 | 2.0 | 1800 | $2,195 | $1.22 | 15d | 2 | 0.89mi |
| 332 Voldemort St Rock Hill, SC | 3.0 | 2.0 | 1800 | $2,195 | $1.22 | 2d | 2 | 0.94mi |
| 2351 Ridgerock Ln Rock Hill, SC | 3.0 | 2.0 | 1320 | $1,595 | $1.21 | 24d | 1 | 0.97mi |
| 1084 Constitution Park Blvd Rock Hill, SC | 2.0 | 2.5 | 1338 | $1,750 | $1.31 | 22d | 1 | 1.04mi |
| 325 Hancock Union Ln Rock Hill, SC | 3.0 | 2.5 | 1506 | $2,400 | $1.59 | 22d | 1 | 1.04mi |
| 1037 Constitution Park Blvd Rock Hill, SC | 2.0 | 2.5 | 1118 | $1,570 | $1.40 | 4d | 1 | 1.05mi |
| 1878 Gingercake Cir Rock Hill, SC | 1.0–3.0 | 1.0–2.0 | 1088 | $1,775 | $1.63 | 2d | 18 | 1.08mi |
| 1264 Liberty Bell Ct Rock Hill, SC | 3.0 | 2.5 | 1120 | $1,795 | $1.60 | 18d | 1 | 1.09mi |
| 1292 Liberty Bell Ct Rock Hill, SC | 2.0 | 2.5 | 1280 | $2,200 | $1.72 | 24d | 1 | 1.09mi |
| 1247 Spring View Ct Rock Hill, SC | 3.0 | 2.0 | 1248 | $1,210 | $0.97 | 20d | 1 | 1.11mi |
| 2051 McGee Rd Rock Hill, SC | 2.0 | 2.0 | 1000 | $1,349 | $1.35 | 3d | 3 | 1.14mi |
| 764 McDow Dr Rock Hill, SC | 3.0 | 2.0 | 1063 | $1,975 | $1.86 | 24d | 1 | 1.17mi |
| 2172 Ebinport Rd Rock Hill, SC | 1.0–2.0 | 1.0–2.0 | 840 | $1,525 | $1.82 | 24d | 1 | 1.23mi |
| 1112 Camden Ave Unit 104 Rock Hill, SC | 2.0 | 1.5 | 1000 | $1,350 | $1.35 | 18d | 1 | 1.23mi |
| 1112 Camden Ave Unit 108 Rock Hill, SC | 2.0 | 1.5 | 1000 | $1,350 | $1.35 | 24d | 1 | 1.23mi |
| 760 Goudlock Rd Rock Hill, SC | 3.0 | 2.0 | 1740 | $2,245 | $1.29 | 24d | 1 | 1.40mi |
| 1042 Bose Ave Rock Hill, SC | 2.0 | 1.0 | 900 | $1,295 | $1.44 | 24d | 1 | 1.43mi |
HOA detail condo
- Monthly dues
- $237 · $2,844/yr
- Assessments
- None detected in remarks — confirm with the listing agent.
Listing history 24 events
-
2026-06-18days on market $169,900 Active 314 DOM
-
2026-06-17days on market $169,900 Active 313 DOM
-
2026-06-16days on market $169,900 Active 312 DOM
-
2026-06-15days on market $169,900 Active 311 DOM
-
2026-06-13days on market $169,900 Active 309 DOM
-
2026-06-09days on market $169,900 Active 305 DOM
-
2026-06-08days on market $169,900 Active 304 DOM
-
2026-06-07days on market $169,900 Active 303 DOM
-
2026-06-04days on market $169,900 Active 300 DOM
-
2026-06-03days on market $169,900 Active 299 DOM
-
2026-06-02days on market $169,900 Active 298 DOM
-
2026-06-01days on market $169,900 Active 297 DOM
-
2026-05-31days on market $169,900 Active 296 DOM
-
2026-05-13price $169,900
-
2026-04-20price $179,900
-
2026-04-01price $184,900
-
2026-02-13status Active
-
2025-12-30historical Active Under Contract
-
2025-10-16price $189,900
-
2025-09-30price $199,900
-
2025-09-16price $209,900
-
2025-08-07$219,900 Active
-
2023-03-30soldstatus $75,000
-
2002-08-08soldstatus $76,500
ⓘ Source: listings_history table (triggers on properties + properties_extension) + one-shot
backfill from property_details.listing_events for pre-trigger history.
Tax reassessment forecast SC · Resets to sale price
- Current annual tax
- $3,646 · $304/mo
- Projected year-2 tax
- $3,646 · $304/mo
- Expected delta
- $0/yr ($0/mo · -0.0%)
ⓘ Screening estimate from a state-policy table — verify with the county assessor before closing.
Climate risk First Street
- Flood 1/10 Low FEMA zone X (unshaded) · 0% chance over 30 yrs
- Wildfire 3/10 Moderate
- Heat 6/10 Major 7 d/yr ≥105°F today · 16 d/yr by 30 yrs out
- Wind 6/10 Major 27% chance of damaging wind over 30 yrs
- Air quality 3/10 Moderate 3 unhealthy d/yr today · 3 by 30 yrs out
Nearby sold comps map
Loading sold comps map…
Walkable amenities ~0.75 mi
Loading nearby amenities…
Taxation est. · year 1
- Rental income
- $22,156
- − Mortgage interest
- −$9,517
- − Property taxes
- −$3,646
- − Insurance
- −$850
- − Repairs & maintenance
- −$1,772
- − Management
- −$1,772
- − HOA
- −$2,844
- − Depreciation
- −$4,943
- Taxable loss
- −$3,188
- Est. tax savings @ 24.0%
- +$765
- After-tax cash flow
- $237/yr
For passive investors: Depreciation is non-cash, so a rental often shows a tax loss while cash-flowing — sheltering income. Rental losses are passive: they offset passive income freely, and up to $25,000/yr can offset ordinary (W-2) income if you actively participate and your MAGI is under $100k (phasing out to $0 by $150k); unused losses carry forward. On sale, claimed depreciation is recaptured at up to 25%, and gains may owe capital-gains tax (a 1031 exchange can defer both). Figures are a year-1 estimate at your 24.0% rate — not tax advice; consult a CPA.
Schools (NCES district)
- District
- York 03
- NCES district ID
- 4503870
- Math proficiency
- 36% ▼ -8.00%
- Reading proficiency
- 47% ▲ 3.00%
- Median HH income
- $47,570
- Composite
- 35.46/100
- National rank
- #4928
- State rank
- #32 of 80 in SC
Livability — Rock Hill
- Score
- 70/100
- State rank
- #62
- US rank
- #7573
Category grades
Schools grade is shown separately in the Schools card above.
Census & demographics
- Census place
- Rock Hill, SC
- County
- York County · 281,758 people
- City population
- 115,874
- Metro
- Charlotte-Concord-Gastonia, NC-SC
- Population (ZIP)
- 57,675
- Household income
- $84,937
- Rent vs Own
- Severe rent burden
- 1774.0
Population outlook (York County) Hauer SSP2
- Today (2025)
- 307,757 people
- By 2030
- 335,979 · +9.2%
- By 2040
- 391,378 · +27.2%
- By 2050
- 443,234 · +44.0%
- By 2075
- 557,102 · +81.0%
- By 2100
- 625,837 · +103.4%
Race, ethnicity, and origin ACS 2023
- Neighborhood character
- Predominantly White (66%)
- Race & ethnicity
- White 66% Black 21% Hispanic / Latino 7% Two or more races 6% Asian 2%
- Hispanic origin (detail)
- Mexican 3%
- Common ancestry
- Serbian 4% Slovak 3% Romanian 2%
- Foreign-born
- 5% · Canada
- Languages at home
- 92% English-only · Spanish 5% Other Indo-European 1%
Political lean MEDSL · York
- 2024 margin
- R (+19.1) · D 39.7% · R 58.8% · Other 1.5%
- 2008→2024 swing
- -1.4pp toward R · 2008: -17.7pp · 2024: -19.1pp
- All cycles
- 2024: R+19.1 2020: R+16.5 2016: R+22.1 2012: R+20.5 2008: R+17.7
Not yet ingested
- Civics
- —
Market trends
- HPI YoY
- ▼ -257.27%
- Current HPI
- 239.0701
- Rent YoY
- ▼ -0.25%
- Metro
- Charlotte-Concord-Gastonia, NC-SC
- State GDP YoY
- ▲ 4.51%
- F500 in state
- 2
Industry mix (Fortune 500 HQ in SC)
| Industry | F500 HQs | Revenue |
|---|---|---|
| Packaging | 1 | $7B |
|
||
Price history
+122.1% since first listed11 events — show timeline
- 2026-05-13 Price Changed $169,900 CANOPYMLS as Distributed by MLS Grid
- 2026-04-20 Price Changed $179,900 CANOPYMLS as Distributed by MLS Grid
- 2026-04-01 Price Changed $184,900 CANOPYMLS as Distributed by MLS Grid
- 2026-02-13 Relisted — CANOPYMLS as Distributed by MLS Grid
- 2025-12-30 Contingent — CANOPYMLS as Distributed by MLS Grid
- 2025-10-16 Price Changed $189,900 CANOPYMLS as Distributed by MLS Grid
- 2025-09-30 Price Changed $199,900 CANOPYMLS as Distributed by MLS Grid
- 2025-09-16 Price Changed $209,900 CANOPYMLS as Distributed by MLS Grid
- 2025-08-07 Listed $219,900 CANOPYMLS as Distributed by MLS Grid
- 2023-03-30 Sold (Public Records) $75,000 Public Records
- 2002-08-08 Sold (Public Records) $76,500 Public Records
Property tax history
+6.2%/yrLatest (2025): $3,646 · +11.7% YoY. Source: county tax records.
Cash-flow waterfall
monthlySold comps — $/sqft
last 12 mo · ≤1 miLoading sold comps…