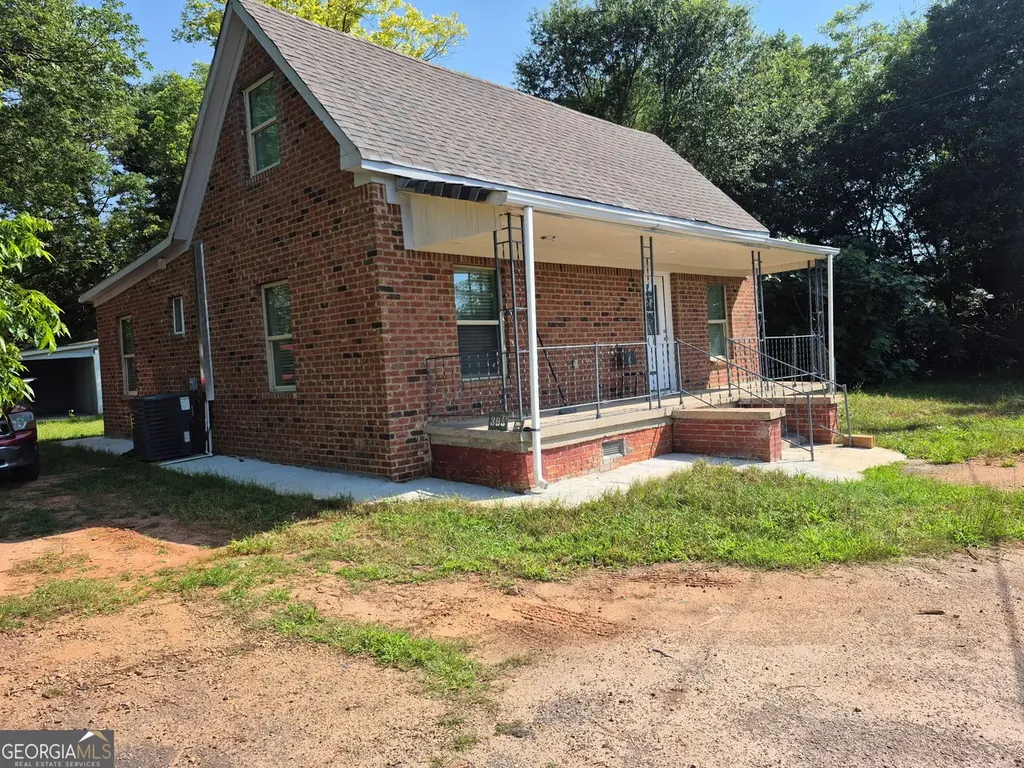
395 S Elm St · Commerce, GA
Flood risk 1/10 · Minimal
- FEMA flood zone
- X (unshaded)
- Chance of flooding over 30 yrs
- 0.0%
- Est. flood insurance / yr
- $507 – $1,088
Fire risk 4/10 · Minor
- Est. fire insurance / yr
- $963 – $1,789
Heat risk 5/10 · Moderate
- Hot days now (above 104°F)
- 7 days/yr
- Hot days in 30 yrs
- 17 days/yr
Wind risk 4/10 · Minor
- Chance of severe wind over 30 yrs
- 14.0%
Air-quality risk 4/10 · Minor
- Unhealthy air days now
- 3 days/yr
- Unhealthy air days in 30 yrs
- 6 days/yr
Risk factors via First Street. Map © Google.
Why this score? — see what drove the D+ grade
The composite is a weighted blend of 9 inputs, each scored 0–100. Each bar is that input's sub-score; the figure is the points it added to the 100-point composite (weight × sub-score).
- ARV discount +15.0/15.0
- Appreciation +10.0/10.0
- Cash flow +7.4/30.0
- Schools +3.3/10.0
- Livability +3.2/5.0
- Condition / age +2.5/5.0
- 1% rule +2.1/10.0
- DSCR +1.5/10.0
- Rent growth +1.4/5.0
$254,000
🖨 Deal sheet 📄 Offer letter ✓ Due diligence
Listing remarks MLS
Very motivated seller! Come check out this updated home. This property is conveniently located to shopping and more
Key facts
- 0.38 acre lot
- Built 1960
- Listed 157 days
Neighborhood map
What this means for you Summary
Snapshot
- This is a 4-bed/1.0-bath single-family listed at $254k.
Deal economics
- At list price, monthly cash flow is $-330 ($-4k/yr) — negative.
- To cash-flow at today's rent, offer at most $206k (18.8% below list).
- To meet the 1% rule (rent ≥ 1% of price), the offer needs to be $180k (29.0% below list).
- Recommended offer: $180k (29.0% below list) — sets the bar for 1% rule.
- Cap rate 4.7% vs local median 3.3% in Commerce — top-decile yield for the area; either an underpriced asset or a hidden risk that comps aren't pricing in. Stress-test before assuming the spread holds.
Location & tenants
- Location reads 64/100 on livability (#271 in GA) — a middle-class / working-renter tenant base. Strengths: cost of living A+, housing A+; Watch: employment D, schools D-, amenities F.
- Jackson County (rural): math 38% / reading 37% proficiency, ranked #50 of 174 in GA (top 29%) — families likely to look elsewhere, expect single-tenant / working-renter base with shorter leases.
- Market conditions: Rents falling (-4.2%/yr); 151 active listings in the ZIP; 1 comparable units currently listed for rent nearby; 2,167 units permitted in Jackson County in 2024 (59 in 5+ unit buildings).
- This rent runs 35% of the median local income ($62k/yr) — at the standard rent-burdened threshold; future hikes will face affordability resistance.
Forward outlook
- In year one you build about $27k of equity ($2k loan paydown + $25k appreciation (10.0% local appreciation)).
- Jackson County population projected at +14% by 2050 — modest demand growth; plan on rents tracking national, not racing it.
- By year 2, paydown + projected appreciation supports a ~$44k cash-out refi (75% LTV) — recoverable capital for the next deal without selling this one.
Negotiation context
- It's been on market 158 days — a 12% lower offer ($224k) is reasonable based on typical stale-listing flexibility.
- 6 sale attempts since 7y ago with the ask held roughly flat each time — persistent listings suggest the price (not the market) is what's stuck; bring a comps-based counter.
- Current owner paid $12k; list at $254k implies a 2017% gain — meaningful room to come down on a strong offer.
Risks & watch-outs
- Climate carrying-cost: extreme-heat days projected 7→17/yr by 2055 (HVAC capex compounding) — expect insurance premiums to compound above CPI over the hold.
Questions for the listing agent
- What do current leases actually rent for vs. the listed asking? Can we see a recent rent roll and the last 12 months of T-12 income?
- It's been on market 158 days. Have you received any prior offers? Is the seller open to a 29% concession, seller financing, or rate buy-down credit?
- Built in 1960 — when were the roof, HVAC, electrical panel, plumbing, and water heater last replaced?
- Why hasn't it sold? Are there any deal-killer items the seller is aware of (foundation, flood, title, zoning, code violations)?
- Is there a deadline driving the sale (1031 exchange, divorce, estate, relocation)? That informs how much negotiation room exists.
- Schools are D-rated, which usually means shorter tenancies and higher turnover. Who's the typical renter profile here, and what's been the actual vacancy rate?
- The area grade is low — what's the realistic commute time and amenity access for the typical tenant pool here? Any planned neighborhood developments (good or bad) we should know about?
- What's the average days-on-market for RENTAL listings here right now (not sales)? A rising rental-DOM trend means longer vacancies and softer asking-rent achievability than the comps imply.
- What's the recent tenant-quality profile in this submarket — average credit score on applications, eviction rate, late-payment / NSF rate, and stable-employment percentage? A property-management company in the area should have these aggregated.
- How much new for-sale + rental construction is in the pipeline within 1–3 miles? Heavy new supply typically softens prices + rents 12–24 months out; constrained supply supports both.
Investment metrics
- 1% rule
- 0.71% ✗
- Cap rate
- 4.74%
- Cash-on-cash
- -5.56%
- DSCR
- 0.75
- GRM
- 11.7
CMA / ARV
- ARV (median comp)
- $305,157
- List price
- $254,000
- Delta
- -16.76%
- Verdict
- UNDERPRICED
- Comps
- 20 within 1.0 mi
Show comp detail 2 sales within ~0.75 mi
| Address | Dist | Beds/Ba | Sqft | Sold | Price | $/sf | Match |
|---|---|---|---|---|---|---|---|
| 61 Chestnut St | 0.49mi | 3/1.0 (-1) | 936 (+8%) | 15mo | $115,000 | $123 | 47 |
| 94 Hillcrest St | 0.73mi | 3/1.0 (-1) | 975 (+12%) | 3mo | $267,000 | $274 | 38 |
Match score weights: distance 35% · size 25% · config 20% · recency 20%. Top-matched comps best support the ARV.
Projected returns pro-forma
10.0% appreciation · 0.0% rent growth · sell at horizon
- IRR
- 19.5%
- Equity multiple
- 2.58×
- Total profit
- $112,076
- Equity at exit
- $228,823
- IRR
- 17.4%
- Equity multiple
- 5.74×
- Total profit
- $337,142
- Equity at exit
- $493,466
Cash invested: $71,120 (down + closing). Projections, not guarantees.
Landlord ↔ Tenant lean methodology
- Overall (STATE)
- 90 Strongly Landlord-Friendly
- State Georgia
- 90 Strongly Landlord-Friendly · R+3
- County
- — inherits STATE
- City
- — inherits STATE
ZIP-level market 30529
- Home prices YoY
- 6.6%
- Rents YoY
- -4.2%
- Active inventory
- 151
- Price-to-rent
- 11.7×
Monthly cashflow live
- Estimated rent
- $1,805 medium interval (Pro) →
- Mortgage (P&I)
- −$1,332
- Tax est. 1.5%
- −$318 /mo · $3,810/yr
- Insurance
- −$106
- HOA
- −$0
- Vacancy / Maint / Mgmt
- −$379
- Net cashflow
- $-330
Break-even live
UW: 25.0% down · 7.5% · 30yr · 1.5% tax · 5.0% vac · 8.0% maint · 8.0% mgmt
Financing live
Cash to close
- Down payment
- $63,500
- Closing costs
- $7,620
- Reserves months
- —
- Total cash needed
- —
Loan-product check · same deal, 3 products live
Conventional
25% down · 7.5% · 30yr
- Down + closing
- —
- Monthly P&I
- —
- Monthly cashflow
- —
- DSCR
- —
- Eligible?
- —
Personal DTI + credit; lowest rate.
DSCR
20% down · 8.5% · 30yr
- Down + closing
- —
- Monthly P&I
- —
- Monthly cashflow
- —
- DSCR
- —
- Eligible?
- —
No personal income docs; deal must DSCR.
Hard money
10% down · 12.0% · 12mo
- Down + closing
- —
- Monthly P&I
- —
- Monthly cashflow
- —
- DSCR
- —
- Eligible?
- —
Short-term bridge; refi at stabilization.
Rent comps 1 comps
| Address | Beds | Baths | Sqft | Rent | $/sqft | DOM | Units | Dist |
|---|---|---|---|---|---|---|---|---|
| 100 Heritage Hills Dr Commerce, GA | 1.0–3.0 | 1.0–2.0 | 1087 | $1,503 | $1.38 | 13d | 1 | 1.20mi |
Listing history 30 events
-
2026-06-19days on market $254,000 Active 158 DOM
-
2026-06-18days on market $254,000 Active 157 DOM
-
2026-06-17days on market $254,000 Active 156 DOM
-
2026-06-16days on market $254,000 Active 155 DOM
-
2026-06-15days on market $254,000 Active 154 DOM
-
2026-06-14days on market $254,000 Active 152 DOM
-
2026-06-13days on market $254,000 Active 151 DOM
-
2026-06-10days on market $254,000 Active 149 DOM
-
2026-06-09days on market $254,000 Active 148 DOM
-
2026-06-08days on market $254,000 Active 147 DOM
-
2026-06-07days on market $254,000 Active 146 DOM
-
2026-06-02days on market $254,000 Active 141 DOM
-
2026-06-01days on market $254,000 Active 140 DOM
-
2026-05-31days on market $254,000 Active 139 DOM
-
2026-05-30days on market $254,000 Active 138 DOM
-
2026-05-12status Back On Market 115-char remark
Show marketing remark (115 chars)
Very motivated seller! Come check out this updated home. This property is conveniently located to shopping and more
-
2026-04-02status Under Contract 115-char remark
Show marketing remark (115 chars)
Very motivated seller! Come check out this updated home. This property is conveniently located to shopping and more
-
2026-03-05status Back On Market 115-char remark
Show marketing remark (115 chars)
Very motivated seller! Come check out this updated home. This property is conveniently located to shopping and more
-
2026-02-19historical 115-char remark
Show marketing remark (115 chars)
Very motivated seller! Come check out this updated home. This property is conveniently located to shopping and more
-
2025-11-19$254,000 New 115-char remark
Show marketing remark (115 chars)
Very motivated seller! Come check out this updated home. This property is conveniently located to shopping and more
-
2025-11-13historical
-
2025-10-07status Back On Market
-
2025-10-03historical
-
2025-08-19price $259,000
-
2025-07-01$269,000 New
-
2019-06-14soldstatus $12,000 Sold
-
2019-05-23status Under Contract
-
2019-04-16price $15,000
-
2019-04-06price $18,500
-
2019-03-25$25,000 New
ⓘ Source: listings_history table (triggers on properties + properties_extension) + one-shot
backfill from property_details.listing_events for pre-trigger history.
Climate risk First Street
- Flood 1/10 Low FEMA zone X (unshaded) · 0% chance over 30 yrs
- Wildfire 4/10 Moderate
- Heat 5/10 Major 7 d/yr ≥104°F today · 17 d/yr by 30 yrs out
- Wind 4/10 Moderate 14% chance of damaging wind over 30 yrs
- Air quality 4/10 Moderate 3 unhealthy d/yr today · 6 by 30 yrs out
Nearby sold comps map
Loading sold comps map…
Walkable amenities ~0.75 mi
Loading nearby amenities…
Taxation est. · year 1
- Rental income
- $21,655
- − Mortgage interest
- −$14,228
- − Property taxes
- −$3,810
- − Insurance
- −$1,270
- − Repairs & maintenance
- −$1,732
- − Management
- −$1,732
- − Depreciation
- −$7,389
- Taxable loss
- −$8,506
- Est. tax savings @ 24.0%
- +$2,042
- After-tax cash flow
- $-1,915/yr
For passive investors: Depreciation is non-cash, so a rental often shows a tax loss while cash-flowing — sheltering income. Rental losses are passive: they offset passive income freely, and up to $25,000/yr can offset ordinary (W-2) income if you actively participate and your MAGI is under $100k (phasing out to $0 by $150k); unused losses carry forward. On sale, claimed depreciation is recaptured at up to 25%, and gains may owe capital-gains tax (a 1031 exchange can defer both). Figures are a year-1 estimate at your 24.0% rate — not tax advice; consult a CPA.
Schools (NCES district)
- District
- Jackson County
- NCES district ID
- 1302940
- Math proficiency
- 38% ▼ -14.00%
- Reading proficiency
- 37% ▼ -10.00%
- Median HH income
- $56,773
- Composite
- 33.08/100
- National rank
- #5566
- State rank
- #50 of 174 in GA
Livability — Commerce
- Score
- 64/100
- State rank
- #271
- US rank
- #14693
Category grades
Schools grade is shown separately in the Schools card above.
Census & demographics
- County
- Jackson County · 50,436 people
- City population
- 12,874
- Metro
- Jefferson, GA
- Population (ZIP)
- 12,874
- Household income
- $62,168
- Rent vs Own
- Severe rent burden
- 297.0
Population outlook (Jackson County) Hauer SSP2
- Today (2025)
- 68,403 people
- By 2030
- 70,771 · +3.5%
- By 2040
- 75,050 · +9.7%
- By 2050
- 78,022 · +14.1%
- By 2075
- 82,646 · +20.8%
- By 2100
- 80,701 · +18.0%
Race, ethnicity, and origin ACS 2023
- Neighborhood character
- Predominantly White (72%)
- Race & ethnicity
- White 72% Hispanic / Latino 14% Black 11% Two or more races 9% Asian 2%
- Hispanic origin (detail)
- Mexican 8% Puerto Rican 1%
- Common ancestry
- Lithuanian 2% Slovak 2% Serbian 1%
- Foreign-born
- 5% · Canada, Jamaica
- Languages at home
- 89% English-only · Spanish 10% Other Indo-European 1%
Political lean MEDSL · Jackson
- 2024 margin
- Solid R (+55.1) · D 22.2% · R 77.2%
- 2008→2024 swing
- +0.8pp no change · 2008: -55.9pp · 2024: -55.1pp
- All cycles
- 2024: R+55.1 2020: R+58.0 2016: R+63.9 2012: R+62.9 2008: R+55.9
Not yet ingested
- Civics
- —
Market trends
- HPI YoY
- ▲ 28.53%
- Current HPI
- 458.5304
- Rent YoY
- ▼ -4.25%
- Metro
- Jefferson, GA
- State GDP YoY
- ▲ 2.66%
- F500 in state
- 28
Industry mix (Fortune 500 HQ in GA)
| Industry | F500 HQs | Revenue |
|---|---|---|
| Paper / Packaging | 2 | $29B |
|
||
| Retail | 1 | $160B |
|
||
| Transportation / Logistics | 1 | $91B |
|
||
| Airlines | 1 | $62B |
|
||
| Consumer Goods | 1 | $47B |
|
||
| Utilities | 1 | $25B |
|
||
Price history
+916.0% since first listed15 events — show timeline
- 2026-05-12 Relisted — GAMLS
- 2026-04-02 Pending — GAMLS
- 2026-03-05 Relisted — GAMLS
- 2026-02-19 Listing Removed — GAMLS
- 2025-11-19 Listed $254,000 GAMLS
- 2025-11-13 Listing Removed — GAMLS
- 2025-10-07 Relisted — GAMLS
- 2025-10-03 Listing Removed — GAMLS
- 2025-08-19 Price Changed $259,000 GAMLS
- 2025-07-01 Listed $269,000 GAMLS
- 2019-06-14 Sold (MLS) $12,000 GAMLS
- 2019-05-23 Pending — GAMLS
- 2019-04-16 Price Changed $15,000 GAMLS
- 2019-04-06 Price Changed $18,500 GAMLS
- 2019-03-25 Listed $25,000 GAMLS
Property tax history
+5.9%/yrLatest (2025): $366 · +58.3% YoY. Source: county tax records.
Cash-flow waterfall
monthlySold comps — $/sqft
last 12 mo · ≤1 miLoading sold comps…