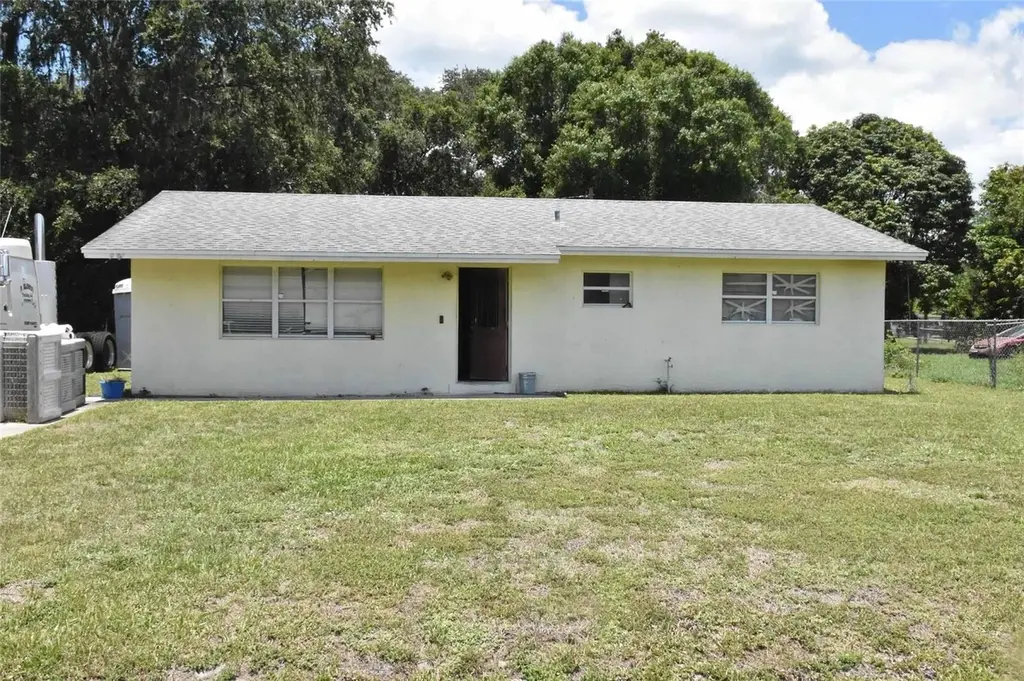
907 Pine St · Immokalee, FL
Flood risk 1/10 · Minimal
- FEMA flood zone
- AH
- Chance of flooding over 30 yrs
- 0.0%
- Est. flood insurance / yr
- $1,142 – $2,507
Fire risk 5/10 · Moderate
- Est. fire insurance / yr
- $947 – $1,759
Heat risk 10/10 · Severe
- Hot days now (above 110°F)
- 7 days/yr
- Hot days in 30 yrs
- 28 days/yr
Wind risk 10/10 · Severe
- Chance of severe wind over 30 yrs
- 99.0%
Air-quality risk 1/10 · Minimal
- Unhealthy air days now
- 0 days/yr
- Unhealthy air days in 30 yrs
- 0 days/yr
Risk factors via First Street. Map © Google.
Why this score? — see what drove the C- grade
The composite is a weighted blend of 9 inputs, each scored 0–100. Each bar is that input's sub-score; the figure is the points it added to the 100-point composite (weight × sub-score).
- Cash flow +17.1/30.0
- ARV discount +7.5/15.0
- DSCR +5.3/10.0
- Schools +5.0/10.0
- Appreciation +4.5/10.0
- Livability +4.0/5.0
- 1% rule +3.7/10.0
- Rent growth +3.2/5.0
- Condition / age +2.5/5.0
$320,000
🖨 Deal sheet (PDF) 📄 Offer letter ✓ Due diligence
Listing remarks
INVESTOR SPECIAL! CASH ONLY! Opportunity knocks in one of Immokalee’s most desirable locations! This 4 bedroom, 2 bathroom home sits on an oversized 0.41-acre lot just off Lake Trafford Road (SR-89), steps away from the soon-to-open Aldi — making this an incredibly strategic acquisition for the savvy investor. At 1,232 square feet with a fully fenced, expansive backyard, the lot alone makes this property worth a serious look. The home is being sold strictly as-is and will require a full rehabilitation. The master bathroom renovation was started but left incomplete, and bat remediation has been professionally completed, though residual cleanup remains. It is STRONGLY ADVISED
Key facts
- Existing septic tank
- Oversized lot
- Roof replaced
Tags
Property features AI
Finance
- Other: Property type: Residential, single-family; Zoned RSF-3; Lot about 0.41 acres (approx. 85 x 210); No CDD; Unfurnished
- Financial info: No additional financial details provided
- HOA & community: No HOA (association not indicated)
Exterior
- Parking: No parking details provided
- Security: No security features listed
- Utilities: Public water available; Public sewer and septic tank; Electricity available; Propane available
- Home design: Single-family residence; One story; Faces east; Entry level: One
- Construction: Block construction; Shingle roof; Slab foundation; Built area about 1,232–1,250 square feet
- Exterior features: Chain link fencing; Asphalt road access
Interior
- Kitchen: No appliances listed
- Bedrooms: 4 bedrooms
- Flooring: Tile flooring; Vinyl flooring
- Bathrooms: 2 full bathrooms
- Heating & cooling: No heating; No cooling
- Interior features: No specific interior features listed
- Laundry & utility: Washer and dryer hookups inside (electric dryer hookup); Dedicated laundry room
Neighborhood map
What this means for you Summary
Snapshot
- This is a 4-bed/2.0-bath single-family listed at $320k.
Deal economics
- At list price, monthly cash flow is $73 ($870/yr) — positive.
- The deal already cash-flows at list — no discount required.
- To meet the 1% rule (rent ≥ 1% of price), the offer needs to be $279k (12.8% below list).
- Recommended offer: $279k (12.8% below list) — sets the bar for 1% rule.
Location & tenants
- Location reads 80/100 on livability (#132 in FL, #1,967 nationally) — a professional / high-income tenant draw. Strengths: commute A+, cost of living A+, housing A+; Watch: crime D+, schools D-, amenities F.
- Collier (suburban): math 60% / reading 56% proficiency, ranked #16 of 73 in FL (top 22%) — acceptable for families but not a draw, mixed tenant base, ~2y average lease.
- Market conditions: Rents rising (+3.0%/yr); 451 active listings in the ZIP; 1 comparable units currently listed for rent nearby; 3,520 units permitted in Collier County in 2024 (959 in 5+ unit buildings).
- At $2,791/mo this rent would consume 54% of the median local household income ($62k/yr) (locally 1093% of renters already pay >50% of income on rent) — very limited rent-growth headroom before tenants either downsize or default.
Forward outlook
- Local home prices are declining (-1.1%/yr); year-one equity from $2k of loan paydown is wiped out by about $3k of value loss. Plan a longer hold.
- Collier County population projected at +30% by 2050 — long-run rental-demand tailwind backs the buy-and-hold thesis.
Negotiation context
- Only 13 days on market — expect competitive offers; lowballing is unlikely to land.
Risks & watch-outs
- Watch-outs: flood insurance adds $152/mo.
- Climate carrying-cost: in FEMA flood zone AH (mandatory federal flood insurance); severe wind risk, 99% chance of damaging wind over 30y; moderate wildfire risk; extreme-heat days projected 7→28/yr by 2055 (HVAC capex compounding) — expect insurance premiums to compound above CPI over the hold.
Questions for the listing agent
- Built in 1977 — when were the roof, HVAC, electrical panel, plumbing, and water heater last replaced?
- What's the actual annual flood-insurance premium (NFIP or private), and is the property in a SFHA with mandatory coverage?
- Is there a deadline driving the sale (1031 exchange, divorce, estate, relocation)? That informs how much negotiation room exists.
- Schools are D-rated, which usually means shorter tenancies and higher turnover. Who's the typical renter profile here, and what's been the actual vacancy rate?
- Crime grade is D in this area — have there been break-ins, vandalism, or insurance claims at this property in the last 3 years? What carrier currently insures it and at what premium?
- What's the average days-on-market for RENTAL listings here right now (not sales)? A rising rental-DOM trend means longer vacancies and softer asking-rent achievability than the comps imply.
- What's the recent tenant-quality profile in this submarket — average credit score on applications, eviction rate, late-payment / NSF rate, and stable-employment percentage? A property-management company in the area should have these aggregated.
- How much new for-sale + rental construction is in the pipeline within 1–3 miles? Heavy new supply typically softens prices + rents 12–24 months out; constrained supply supports both.
Investment metrics
- 1% rule
- 0.87% ✗
- Cap rate
- 7.14%
- Cash-on-cash
- 3.01%
- DSCR
- 1.13
- GRM
- 9.6
CMA / ARV
No comps found within radius.
Projected returns pro-forma
-1.05% appreciation · 2.95% rent growth · sell at horizon
- IRR
- -5.2%
- Equity multiple
- 0.77×
- Total profit
- $-20,319
- Equity at exit
- $76,504
- IRR
- 1.6%
- Equity multiple
- 1.15×
- Total profit
- $13,002
- Equity at exit
- $79,706
Cash invested: $89,600 (down + closing). Projections, not guarantees.
Landlord ↔ Tenant lean methodology
- Overall (STATE)
- 87 Strongly Landlord-Friendly
- State Florida
- 87 Strongly Landlord-Friendly · R+3
- County
- — inherits STATE
- City
- — inherits STATE
ZIP-level market 34142
- Home prices YoY
- -0.5%
- Rents YoY
- 3.0%
- Active inventory
- 451
- Price-to-rent
- 9.6×
Monthly cashflow live
- Estimated rent
- $2,791 medium interval (Pro) →
- Mortgage (P&I)
- −$1,678
- Tax from tax record
- −$169 /mo · $2,029/yr
- Insurance
- −$133
- Flood insurance flood zone
- −$152 /mo · $1,824/yr
- HOA
- −$0
- Vacancy / Maint / Mgmt
- −$586
- Net cashflow
- $73
Break-even live
Sensitivity live
| Price | -10% $254 | -5% $163 | +0% $73 | +5% $-18 | +10% $-109 |
|---|---|---|---|---|---|
| Rent | -10% $-148 | -5% $-38 | +0% $73 | +5% $183 | +10% $293 |
| Rate | -1.0pp $234 | -0.5pp $154 | base $73 | +0.5pp $-10 | +1.0pp $-95 |
UW: 25.0% down · 7.5% · 30yr · 1.5% tax · 5.0% vac · 8.0% maint · 8.0% mgmt
Financing live
Cash to close
- Down payment
- $80,000
- Closing costs
- $9,600
- Reserves months
- —
- Total cash needed
- —
Loan-product check · same deal, 3 products live
Conventional
25% down · 7.5% · 30yr
- Down + closing
- —
- Monthly P&I
- —
- Monthly cashflow
- —
- DSCR
- —
- Eligible?
- —
Personal DTI + credit; lowest rate.
DSCR
20% down · 8.5% · 30yr
- Down + closing
- —
- Monthly P&I
- —
- Monthly cashflow
- —
- DSCR
- —
- Eligible?
- —
No personal income docs; deal must DSCR.
Hard money
10% down · 12.0% · 12mo
- Down + closing
- —
- Monthly P&I
- —
- Monthly cashflow
- —
- DSCR
- —
- Eligible?
- —
Short-term bridge; refi at stabilization.
Rent comps 1 comps
| Address | Beds | Baths | Sqft | Rent | $/sqft | DOM | Units | Dist |
|---|---|---|---|---|---|---|---|---|
| 715 Crestview Dr Immokalee, FL | 2.0–3.0 | 2.0 | 982 | $1,585 | $1.61 | 15d | 10 | 0.87mi |
Listing history 9 events
-
2026-06-21days on market $320,000 Active 13 DOM
-
2026-06-18days on market $320,000 Active 10 DOM
-
2026-06-17days on market $320,000 Active 9 DOM
-
2026-06-16days on market $320,000 Active 8 DOM
-
2026-06-15days on market $320,000 Active 7 DOM
-
2026-06-14days on market $320,000 Active 5 DOM
-
2026-06-10days on market $320,000 Active 2 DOM
-
2026-06-09remarks 687-char remark
-
2026-06-09$320,000 Active 1 DOM
ⓘ Source: listings_history table (triggers on properties + properties_extension) + one-shot
backfill from property_details.listing_events for pre-trigger history.
Tax reassessment forecast FL · Resets to sale price
- Current annual tax
- $2,029 · $169/mo
- Projected year-2 tax
- $2,656 · $221/mo
- Expected delta
- +$627/yr (+$52/mo · 30.9%)
ⓘ Screening estimate from a state-policy table — verify with the county assessor before closing.
Climate risk First Street
- Flood 1/10 Low FEMA zone AH · 0% chance over 30 yrs
- Wildfire 5/10 Major
- Heat 10/10 Extreme 7 d/yr ≥110°F today · 28 d/yr by 30 yrs out
- Wind 10/10 Extreme 99% chance of damaging wind over 30 yrs
- Air quality 1/10 Low 0 unhealthy d/yr today · 0 by 30 yrs out
Nearby sold comps map
Loading sold comps map…
Walkable amenities ~0.75 mi
Loading nearby amenities…
Taxation est. · year 1
- Rental income
- $33,495
- − Mortgage interest
- −$17,925
- − Property taxes
- −$2,029
- − Insurance
- −$3,424
- − Repairs & maintenance
- −$2,680
- − Management
- −$2,680
- − Depreciation
- −$9,309
- Taxable loss
- −$4,552
- Est. tax savings @ 24.0%
- +$1,092
- After-tax cash flow
- $1,963/yr
For passive investors: Depreciation is non-cash, so a rental often shows a tax loss while cash-flowing — sheltering income. Rental losses are passive: they offset passive income freely, and up to $25,000/yr can offset ordinary (W-2) income if you actively participate and your MAGI is under $100k (phasing out to $0 by $150k); unused losses carry forward. On sale, claimed depreciation is recaptured at up to 25%, and gains may owe capital-gains tax (a 1031 exchange can defer both). Figures are a year-1 estimate at your 24.0% rate — not tax advice; consult a CPA.
Schools (NCES district)
- District
- Collier
- NCES district ID
- 1200330
- Math proficiency
- 60% ▼ -4.00%
- Reading proficiency
- 56% ▼ -2.00%
- Median HH income
- $58,275
- Composite
- 50.23/100
- National rank
- #1892
- State rank
- #16 of 73 in FL
Livability — Immokalee
- Score
- 80/100
- State rank
- #132
- US rank
- #1967
Category grades
Schools grade is shown separately in the Schools card above.
Census & demographics
- Census place
- Immokalee, FL
- County
- Collier County · 396,295 people
- City population
- 35,149
- Metro
- Naples-Marco Island, FL
- Population (ZIP)
- 35,149
- Household income
- $62,333
- Rent vs Own
- Severe rent burden
- 1093.0
Population outlook (Collier County) Hauer SSP2
- Today (2025)
- 420,858 people
- By 2030
- 450,054 · +6.9%
- By 2040
- 502,232 · +19.3%
- By 2050
- 544,932 · +29.5%
- By 2075
- 627,203 · +49.0%
- By 2100
- 659,015 · +56.6%
Race, ethnicity, and origin ACS 2023
- Neighborhood character
- Majority Hispanic (63%)
- Race & ethnicity
- Hispanic / Latino 63% Two or more races 39% Black 19% White 16% Native American 7%
- Hispanic origin (detail)
- Mexican 43% Puerto Rican 3% Cuban 2% Dominican 1%
- Common ancestry
- Hispanic 8% Slovak 1% Serbian 1%
- Foreign-born
- 32% · Canada, Jamaica
- Languages at home
- 34% English-only · Spanish 53% French/Haitian/Cajun 12%
Political lean MEDSL · Collier
- 2024 margin
- Solid R (+33.1) · D 33.1% · R 66.2%
- 2008→2024 swing
- -10.6pp toward R · 2008: -22.5pp · 2024: -33.1pp
- All cycles
- 2024: R+33.1 2020: R+24.7 2016: R+26.0 2012: R+30.1 2008: R+22.5
Not yet ingested
- Civics
- —
Market trends
- HPI YoY
- ▼ -1.05%
- Current HPI
- 226.9105
- Rent YoY
- ▲ 2.95%
- Metro
- Naples-Marco Island, FL
- State GDP YoY
- ▲ 3.28%
- F500 in state
- 36
Industry mix (Fortune 500 HQ in FL)
| Industry | F500 HQs | Revenue |
|---|---|---|
| Industrial Technology | 2 | $29B |
|
||
| Insurance | 2 | $17B |
|
||
| Retail | 1 | $60B |
|
||
| Technology Distribution | 1 | $58B |
|
||
| Homebuilding | 1 | $35B |
|
||
| Technology Manufacturing | 1 | $35B |
|
||
Price history
1 event — show timeline
- 2026-06-08 Listed $320,000 Stellar MLS as Distributed by MLS Grid
Property tax history
+16.3%/yrLatest (2025): $2,029 · +16.9% YoY. Source: county tax records.
Cash-flow waterfall
monthlySold comps — $/sqft
last 12 mo · ≤1 miLoading sold comps…