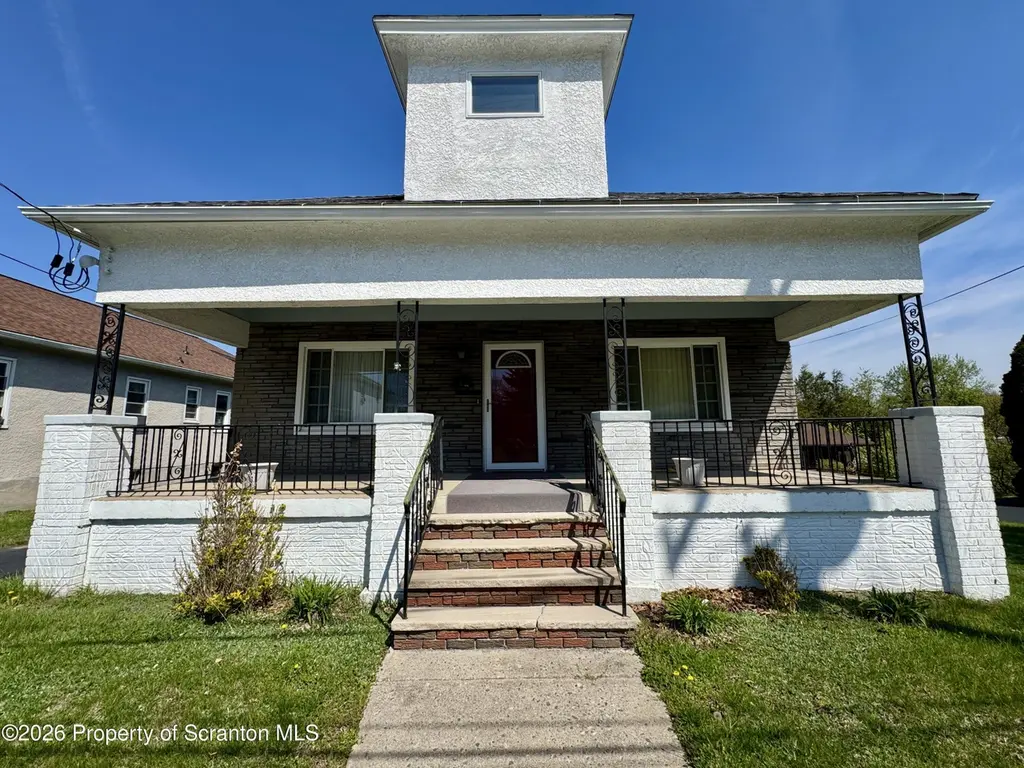
341 Orchard St · Old Forge, PA
Flood risk 1/10 · Minimal
- FEMA flood zone
- X (unshaded)
- Chance of flooding over 30 yrs
- 0.0%
- Est. flood insurance / yr
- $473 – $860
Fire risk 3/10 · Minor
- Est. fire insurance / yr
- $511 – $949
Heat risk 4/10 · Minor
- Hot days now (above 96°F)
- 7 days/yr
- Hot days in 30 yrs
- 15 days/yr
Wind risk 3/10 · Minor
- Chance of severe wind over 30 yrs
- 4.0%
Air-quality risk 2/10 · Minimal
- Unhealthy air days now
- 0 days/yr
- Unhealthy air days in 30 yrs
- 1 days/yr
Risk factors via First Street. Map © Google.
Why this score? — see what drove the D- grade
The composite is a weighted blend of 9 inputs, each scored 0–100. Each bar is that input's sub-score; the figure is the points it added to the 100-point composite (weight × sub-score).
- Cash flow +10.0/30.0
- Appreciation +7.6/10.0
- Livability +3.9/5.0
- Schools +3.1/10.0
- 1% rule +3.0/10.0
- DSCR +2.8/10.0
- Rent growth +2.5/5.0
- Condition / age +2.5/5.0
- ARV discount +0.2/15.0
$215,000
🖨 Deal sheet (PDF) 📄 Offer letter ✓ Due diligence
Listing remarks
Check out this charming 3 bed, 1 bath home in Old Forge! Features include: Large living room, eat in kitchen, central air, walk up attic, and 2 car garage!
Key facts
- 0.26 acre lot
- 2 garage spots
- Built 1960
Neighborhood map
What this means for you Summary
Snapshot
- This is a 3-bed/1.0-bath single-family listed at $215k.
Deal economics
- At list price, monthly cash flow is $-131 ($-2k/yr) — negative.
- To cash-flow at today's rent, offer at most $196k (8.8% below list).
- To meet the 1% rule (rent ≥ 1% of price), the offer needs to be $171k (20.2% below list).
- Recommended offer: $171k (20.2% below list) — sets the bar for 1% rule.
Location & tenants
- Location reads 78/100 on livability (#287 in PA, #2,531 nationally) — a middle-class / working-renter tenant base. Strengths: crime A+, cost of living A+, housing A+; Watch: employment C-, amenities F, commute F.
- Old Forge SD (suburban): math 22% / reading 49% proficiency, ranked #409 of 539 in PA (top 76%) — families likely to look elsewhere, expect single-tenant / working-renter base with shorter leases.
- Zoned schools: Old Forge El Sch (math 17% / reading 47%, grade F, #1,094 of 1,518 statewide, top 73%, 493 students, 50% FRL); Old Forge Jshs (math 32% / reading 52%, grade F, #232 of 437 statewide, top 57%, 453 students, 36% FRL).
- Market conditions: 39 active listings in the ZIP; 11 comparable units currently listed for rent nearby; rentals at typical pace (median 16d on market — plan ~3-4 weeks tenant-placement turnaround); 251 units permitted in Lackawanna County in 2024 (0 in 5+ unit buildings).
Forward outlook
- In year one you build about $13k of equity ($1k loan paydown + $11k appreciation (5.2% local appreciation)).
- Lackawanna County population projected to shrink 4% by 2050 — rents likely to lag national; underwrite the cash flow, not the appreciation.
- By year 3, paydown + projected appreciation supports a ~$31k cash-out refi (75% LTV) — recoverable capital for the next deal without selling this one.
Negotiation context
- Only 4 days on market — expect competitive offers; lowballing is unlikely to land.
Questions for the listing agent
- What do current leases actually rent for vs. the listed asking? Can we see a recent rent roll and the last 12 months of T-12 income?
- Built in 1960 — when were the roof, HVAC, electrical panel, plumbing, and water heater last replaced?
- Is there a deadline driving the sale (1031 exchange, divorce, estate, relocation)? That informs how much negotiation room exists.
- Schools are B-rated — typically a magnet for longer-tenancy family renters. What's the average tenant stay here, and is there a school-zone premium baked into asking?
- The area grade is low — what's the realistic commute time and amenity access for the typical tenant pool here? Any planned neighborhood developments (good or bad) we should know about?
- What's the average days-on-market for RENTAL listings here right now (not sales)? A rising rental-DOM trend means longer vacancies and softer asking-rent achievability than the comps imply.
- What's the recent tenant-quality profile in this submarket — average credit score on applications, eviction rate, late-payment / NSF rate, and stable-employment percentage? A property-management company in the area should have these aggregated.
- How much new for-sale + rental construction is in the pipeline within 1–3 miles? Heavy new supply typically softens prices + rents 12–24 months out; constrained supply supports both.
Investment metrics
- 1% rule
- 0.80% ✗
- Cap rate
- 5.56%
- Cash-on-cash
- -2.61%
- DSCR
- 0.88
- GRM
- 10.4
CMA / ARV
- ARV (on-the-fly)
- $185,000
- Comps found
- 12
Show comp detail 12 sales within ~0.75 mi
| Address | Dist | Beds/Ba | Sqft | Sold | Price | $/sf | Match |
|---|---|---|---|---|---|---|---|
| 341 Orchard St | 0.00mi | 3/1.0 | 1,250 (0%) | 0mo | $230,333 | $184 | 100 |
| 115 Taroli St Unit L20 22 | 0.23mi | 2/1.0 (-1) | 1,350 (+8%) | 2mo | $130,000 | $96 | 69 |
| 254 Hoover St | 0.26mi | 2/1.5 (-1) | 1,400 (+12%) | 1mo | $226,000 | $161 | 60 |
| 1141 Main St | 0.67mi | 3/1.0 | 1,204 (-4%) | 5mo | $178,000 | $148 | 59 |
| 412 Brook St | 0.54mi | 3/2.0 | 1,320 (+6%) | 5mo | $197,000 | $149 | 57 |
| 147 2nd St | 0.67mi | 3/1.0 | 1,170 (-6%) | 5mo | $130,000 | $111 | 54 |
| 331 Drake St | 0.71mi | 3/2.0 | 1,227 (-2%) | 9mo | $188,000 | $153 | 52 |
| 199 Marion St | 0.71mi | 2/2.0 (-1) | 1,226 (-2%) | 4mo | $149,500 | $122 | 52 |
| 116 Broadhead St | 0.68mi | 4/2.0 (+1) | 1,400 (+12%) | 0mo | $204,750 | $146 | 39 |
| 1118 Main St | 0.61mi | 4/1.0 (+1) | 1,100 (-12%) | 9mo | $128,000 | $116 | 39 |
| 602 Milwaukee Ave | 0.67mi | 2/2.0 (-1) | 1,395 (+12%) | 5mo | $270,000 | $194 | 36 |
| 516 W Grace St Unit L 269 | 0.69mi | 2/1.0 (-1) | 1,067 (-15%) | 7mo | $158,000 | $148 | 33 |
Match score weights: distance 35% · size 25% · config 20% · recency 20%. Top-matched comps best support the ARV.
Projected returns pro-forma
5.15% appreciation · 3.0% rent growth · sell at horizon
- IRR
- 11.1%
- Equity multiple
- 1.71×
- Total profit
- $43,031
- Equity at exit
- $123,752
- IRR
- 12.3%
- Equity multiple
- 3.27×
- Total profit
- $136,563
- Equity at exit
- $215,179
Cash invested: $60,200 (down + closing). Projections, not guarantees.
Landlord ↔ Tenant lean methodology
- Overall (STATE)
- 62 Landlord-Friendly
- State Pennsylvania
- 62 Landlord-Friendly · EVEN
- County
- — inherits STATE
- City
- — inherits STATE
ZIP-level market 18518
- Home prices YoY
- 2.2%
- Active inventory
- 39
- Price-to-rent
- 10.4×
Monthly cashflow live
- Estimated rent
- $1,715 high interval (Pro) →
- Mortgage (P&I)
- −$1,127
- Tax est. 1.5%
- −$269 /mo · $3,225/yr
- Insurance
- −$90
- HOA
- −$0
- Vacancy / Maint / Mgmt
- −$360
- Net cashflow
- $-131
Break-even live
Sensitivity live
| Price | -10% $17 | -5% $-57 | +0% $-131 | +5% $-205 | +10% $-280 |
|---|---|---|---|---|---|
| Rent | -10% $-267 | -5% $-199 | +0% $-131 | +5% $-63 | +10% $4 |
| Rate | -1.0pp $-23 | -0.5pp $-76 | base $-131 | +0.5pp $-187 | +1.0pp $-243 |
UW: 25.0% down · 7.5% · 30yr · 1.5% tax · 5.0% vac · 8.0% maint · 8.0% mgmt
Financing live
Cash to close
- Down payment
- $53,750
- Closing costs
- $6,450
- Reserves months
- —
- Total cash needed
- —
Loan-product check · same deal, 3 products live
Conventional
25% down · 7.5% · 30yr
- Down + closing
- —
- Monthly P&I
- —
- Monthly cashflow
- —
- DSCR
- —
- Eligible?
- —
Personal DTI + credit; lowest rate.
DSCR
20% down · 8.5% · 30yr
- Down + closing
- —
- Monthly P&I
- —
- Monthly cashflow
- —
- DSCR
- —
- Eligible?
- —
No personal income docs; deal must DSCR.
Hard money
10% down · 12.0% · 12mo
- Down + closing
- —
- Monthly P&I
- —
- Monthly cashflow
- —
- DSCR
- —
- Eligible?
- —
Short-term bridge; refi at stabilization.
Rent comps 11 comps
| Address | Beds | Baths | Sqft | Rent | $/sqft | DOM | Units | Dist |
|---|---|---|---|---|---|---|---|---|
| 864 S Main St #3 Old Forge, PA | 2.0 | 1.0 | 965 | $1,350 | $1.40 | 15d | 1 | 0.32mi |
| 152 Drakes Ln Old Forge, PA | 2.0 | 1.0 | 979 | $1,700 | $1.74 | 15d | 1 | 0.44mi |
| 200 Oak St Unit 2 Old Forge, PA | 3.0 | 1.5 | 1500 | $1,800 | $1.20 | 45d | 1 | 0.68mi |
| 75 Marimar Dr Old Forge, PA | 2.0 | 2.0 | 1300 | $2,500 | $1.92 | 15d | 1 | 0.77mi |
| 163 Bianca Way Old Forge, PA | 2.0 | 2.0 | 1194 | $2,500 | $2.09 | 15d | 1 | 0.82mi |
| 304 Vine St Unit 304 Old Forge, PA | 2.0 | 1.0 | 1000 | $1,400 | $1.40 | 45d | 1 | 0.85mi |
| 962 Wood St Unit 2 Old Forge, PA | 2.0 | 1.0 | 964 | $1,250 | $1.30 | 45d | 1 | 0.85mi |
| 1418 Grove St Moosic, PA | 3.0 | 2.0 | 1820 | $1,850 | $1.02 | 15d | 1 | 0.98mi |
| 230 Swetland St Duryea, PA | 2.0 | 1.0 | 1092 | $1,400 | $1.28 | 23d | 1 | 1.41mi |
| 230 Swetland St Duryea, PA | 2.0 | 1.0 | 950 | $1,400 | $1.47 | 15d | 1 | 1.41mi |
| 652 Marion Ln Moosic, PA | 2.0 | 2.0 | 1000 | $1,500 | $1.50 | 45d | 1 | 1.42mi |
Listing history 2 events
-
2026-04-28status Pending
-
2026-04-23$215,000 Active
ⓘ Source: listings_history table (triggers on properties + properties_extension) + one-shot
backfill from property_details.listing_events for pre-trigger history.
Climate risk First Street
- Flood 1/10 Low FEMA zone X (unshaded) · 0% chance over 30 yrs
- Wildfire 3/10 Moderate
- Heat 4/10 Moderate 7 d/yr ≥96°F today · 15 d/yr by 30 yrs out
- Wind 3/10 Moderate 4% chance of damaging wind over 30 yrs
- Air quality 2/10 Low 0 unhealthy d/yr today · 1 by 30 yrs out
Nearby sold comps map
Loading sold comps map…
Walkable amenities ~0.75 mi
Loading nearby amenities…
Taxation est. · year 1
- Rental income
- $20,578
- − Mortgage interest
- −$12,043
- − Property taxes
- −$3,225
- − Insurance
- −$1,075
- − Repairs & maintenance
- −$1,646
- − Management
- −$1,646
- − Depreciation
- −$6,255
- Taxable loss
- −$5,312
- Est. tax savings @ 24.0%
- +$1,275
- After-tax cash flow
- $-298/yr
For passive investors: Depreciation is non-cash, so a rental often shows a tax loss while cash-flowing — sheltering income. Rental losses are passive: they offset passive income freely, and up to $25,000/yr can offset ordinary (W-2) income if you actively participate and your MAGI is under $100k (phasing out to $0 by $150k); unused losses carry forward. On sale, claimed depreciation is recaptured at up to 25%, and gains may owe capital-gains tax (a 1031 exchange can defer both). Figures are a year-1 estimate at your 24.0% rate — not tax advice; consult a CPA.
Schools (NCES district)
- District
- Old Forge SD
- NCES district ID
- 4218120
- Math proficiency
- 22% ▼ -19.00%
- Reading proficiency
- 49% ▼ -17.00%
- Median HH income
- $49,409
- Composite
- 30.6/100
- National rank
- #6196
- State rank
- #409 of 539 in PA
Livability — Old Forge
- Score
- 78/100
- State rank
- #287
- US rank
- #2531
Category grades
Schools grade is shown separately in the Schools card above.
Census & demographics
- Census place
- Old Forge, PA
- City population
- 8,533
- Population (ZIP)
- 8,533
Population outlook (Lackawanna County) Hauer SSP2
- Today (2025)
- 210,652 people
- By 2030
- 208,623 · -1.0%
- By 2040
- 203,980 · -3.2%
- By 2050
- 201,069 · -4.5%
- By 2075
- 205,026 · -2.7%
- By 2100
- 210,851 · +0.1%
Race, ethnicity, and origin ACS 2023
- Neighborhood character
- Predominantly White (84%)
- Race & ethnicity
- White 84% Two or more races 13% Hispanic / Latino 9% Asian 1%
- Hispanic origin (detail)
- Puerto Rican 9%
- Common ancestry
- Romanian 17% Scotch-Irish 4% Subsaharan African 2%
- Foreign-born
- 2% · Canada
- Languages at home
- 95% English-only · Spanish 3% Other Indo-European 1% Other Asian/Pacific 1%
Political lean MEDSL · Lackawanna
- 2024 margin
- Toss-up / Even · D 51.0% · R 48.3%
- 2008→2024 swing
- -23.2pp toward R · 2008: 26.0pp · 2024: 2.8pp
- All cycles
- 2024: D+2.8 2020: D+8.4 2016: D+3.4 2012: D+27.4 2008: D+26.0
Not yet ingested
- Civics
- —
Market trends
- HPI YoY
- ▲ 5.15%
- Current HPI
- 242.2839
- Rent YoY
- —
- Metro
- —
- State GDP YoY
- ▲ 1.68%
- F500 in state
- 34
Industry mix (Fortune 500 HQ in PA)
| Industry | F500 HQs | Revenue |
|---|---|---|
| Healthcare | 2 | $309B |
|
||
| Insurance | 2 | $27B |
|
||
| Telecommunications / Media | 1 | $124B |
|
||
| Industrial Distribution | 1 | $22B |
|
||
| Financial Services | 1 | $20B |
|
||
| Chemicals / Materials | 1 | $18B |
|
||
Price history
2 events — show timeline
- 2026-04-28 Pending — GSBR as distributed by MLS GRID
- 2026-04-23 Listed $215,000 GSBR as distributed by MLS GRID
Property tax history
+38.5%/yrLatest (2026): $50,688 · +2954.8% YoY. Source: county tax records.
Cash-flow waterfall
monthlySold comps — $/sqft
last 12 mo · ≤1 miLoading sold comps…