689 Hunter Trl · Bridgeport, TX
Flood risk 1/10 · Minimal
- FEMA flood zone
- X (unshaded)
- Chance of flooding over 30 yrs
- 0.0%
- Est. flood insurance / yr
- $507 – $1,088
Fire risk 8/10 · Major
- Est. fire insurance / yr
- $1,222 – $2,270
Heat risk 7/10 · Major
- Hot days now (above 110°F)
- 7 days/yr
- Hot days in 30 yrs
- 21 days/yr
Wind risk 4/10 · Minor
- Chance of severe wind over 30 yrs
- 18.0%
Air-quality risk 1/10 · Minimal
- Unhealthy air days now
- 0 days/yr
- Unhealthy air days in 30 yrs
- 0 days/yr
Risk factors via First Street. Map © Google.
Why this score? — see what drove the C- grade
The composite is a weighted blend of 9 inputs, each scored 0–100. Each bar is that input's sub-score; the figure is the points it added to the 100-point composite (weight × sub-score).
- Cash flow +19.1/30.0
- ARV discount +7.5/15.0
- DSCR +6.0/10.0
- Appreciation +4.6/10.0
- 1% rule +4.5/10.0
- Schools +3.6/10.0
- Livability +3.4/5.0
- Rent growth +2.5/5.0
- Condition / age +1.0/5.0
$149,900
🖨 Deal sheet 📄 Offer letter ✓ Due diligence
Listing remarks MLS
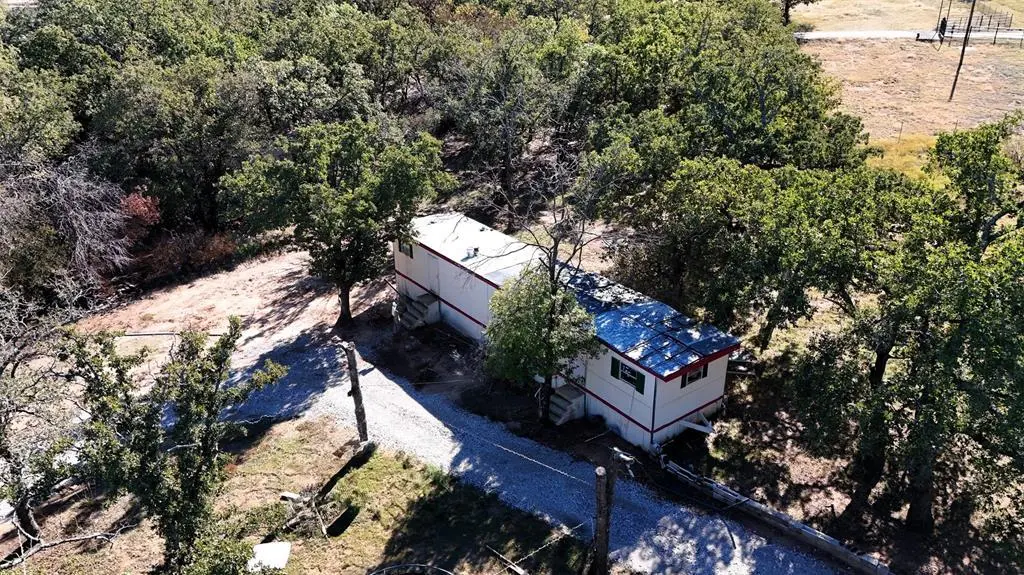
Great location, out of the city with beautiful trees, fenced and ready to be made your own. Older mobile home could be remodeled or removed and a new dream home built. Beautiful properties being built in this rural subdivision. This is your opportunity to get 2 acres at a reasonable price. Check it out!
Key facts
- 2 acre lot
- Built 1979
- Listed 586 days
Neighborhood map
What this means for you Summary
Snapshot
- This is a 3-bed/1.0-bath manufactured listed at $150k. Condition is rated poor.
Deal economics
- At list price, monthly cash flow is $158 ($2k/yr) — positive.
- The deal already cash-flows at list — no discount required.
- To meet the 1% rule (rent ≥ 1% of price), the offer needs to be $142k (5.4% below list).
- Recommended offer: $132k (12.0% below list) — sets the bar for market timing.
- Cap rate 7.6% vs local median 3.3% in Bridgeport — top-decile yield for the area; either an underpriced asset or a hidden risk that comps aren't pricing in. Stress-test before assuming the spread holds.
Location & tenants
- Location reads 68/100 on livability (#472 in TX) — a middle-class / working-renter tenant base. Strengths: cost of living A+, housing A+, crime B+; Watch: health & safety D+, schools F, amenities F.
- Bridgeport ISD (rural): math 41% / reading 41% proficiency, ranked #356 of 826 in TX (top 43%) — families likely to look elsewhere, expect single-tenant / working-renter base with shorter leases.
- Market conditions: 338 active listings in the ZIP; solid renter incomes; 460 units permitted in Wise County in 2024 (243 in 5+ unit buildings).
Forward outlook
- Local home prices are declining (-0.8%/yr); year-one equity from $1k of loan paydown is wiped out by about $1k of value loss. Plan a longer hold.
- Wise County population projected at +27% by 2050 — long-run rental-demand tailwind backs the buy-and-hold thesis.
Negotiation context
- It's been on market 587 days — a 12% lower offer ($132k) is reasonable based on typical stale-listing flexibility.
Risks & watch-outs
- Climate carrying-cost: severe wildfire risk; extreme-heat days projected 7→21/yr by 2055 (HVAC capex compounding) — expect insurance premiums to compound above CPI over the hold.
Questions for the listing agent
- It's been on market 587 days. Have you received any prior offers? Is the seller open to a 12% concession, seller financing, or rate buy-down credit?
- Have any recent inspections been done? Can we get a copy of the seller's disclosures and any deferred-maintenance estimates?
- Built in 1979 — when were the roof, HVAC, electrical panel, plumbing, and water heater last replaced?
- Why hasn't it sold? Are there any deal-killer items the seller is aware of (foundation, flood, title, zoning, code violations)?
- Is there a deadline driving the sale (1031 exchange, divorce, estate, relocation)? That informs how much negotiation room exists.
- Schools are F-rated, which usually means shorter tenancies and higher turnover. Who's the typical renter profile here, and what's been the actual vacancy rate?
- What's the average days-on-market for RENTAL listings here right now (not sales)? A rising rental-DOM trend means longer vacancies and softer asking-rent achievability than the comps imply.
- What's the recent tenant-quality profile in this submarket — average credit score on applications, eviction rate, late-payment / NSF rate, and stable-employment percentage? A property-management company in the area should have these aggregated.
- How much new for-sale + rental construction is in the pipeline within 1–3 miles? Heavy new supply typically softens prices + rents 12–24 months out; constrained supply supports both.
Investment metrics
- 1% rule
- 0.95% ✗
- Cap rate
- 7.56%
- Cash-on-cash
- 4.52%
- DSCR
- 1.20
- GRM
- 8.8
CMA / ARV
No comps found within radius.
Projected returns pro-forma
-0.82% appreciation · 3.0% rent growth · sell at horizon
- IRR
- -0.0%
- Equity multiple
- 1.00×
- Total profit
- $-24
- Equity at exit
- $37,480
- IRR
- 6.4%
- Equity multiple
- 1.63×
- Total profit
- $26,324
- Equity at exit
- $40,473
Cash invested: $41,972 (down + closing). Projections, not guarantees.
Landlord ↔ Tenant lean methodology
- Overall (STATE)
- 87 Strongly Landlord-Friendly
- State Texas
- 87 Strongly Landlord-Friendly · R+5
- County
- — inherits STATE
- City
- — inherits STATE
ZIP-level market 76426
- Home prices YoY
- -0.2%
- Active inventory
- 338
- Price-to-rent
- 8.8×
Monthly cashflow live
- Estimated rent
- $1,418 medium interval (Pro) →
- Mortgage (P&I)
- −$786
- Tax from tax record
- −$113 /mo · $1,361/yr
- Insurance
- −$62
- HOA
- −$0
- Vacancy / Maint / Mgmt
- −$298
- Net cashflow
- $158
Break-even live
UW: 25.0% down · 7.5% · 30yr · 1.5% tax · 5.0% vac · 8.0% maint · 8.0% mgmt
Financing live
Cash to close
- Down payment
- $37,475
- Closing costs
- $4,497
- Reserves months
- —
- Total cash needed
- —
Loan-product check · same deal, 3 products live
Conventional
25% down · 7.5% · 30yr
- Down + closing
- —
- Monthly P&I
- —
- Monthly cashflow
- —
- DSCR
- —
- Eligible?
- —
Personal DTI + credit; lowest rate.
DSCR
20% down · 8.5% · 30yr
- Down + closing
- —
- Monthly P&I
- —
- Monthly cashflow
- —
- DSCR
- —
- Eligible?
- —
No personal income docs; deal must DSCR.
Hard money
10% down · 12.0% · 12mo
- Down + closing
- —
- Monthly P&I
- —
- Monthly cashflow
- —
- DSCR
- —
- Eligible?
- —
Short-term bridge; refi at stabilization.
Listing history 18 events
-
2026-06-18days on market $149,900 Active 587 DOM
-
2026-06-17days on market $149,900 Active 586 DOM
-
2026-06-16days on market $149,900 Active 585 DOM
-
2026-06-15days on market $149,900 Active 584 DOM
-
2026-06-13days on market $149,900 Active 582 DOM
-
2026-06-13pricedays on market $149,900 Active 581 DOM
-
2026-06-09days on market $165,000 Active 578 DOM
-
2026-06-08days on market $165,000 Active 577 DOM
-
2026-06-07days on market $165,000 Active 576 DOM
-
2026-06-04days on market $165,000 Active 573 DOM
-
2026-06-03days on market $165,000 Active 572 DOM
-
2026-06-02days on market $165,000 Active 571 DOM
-
2026-06-01days on market $165,000 Active 570 DOM
-
2026-05-31days on market $165,000 Active 569 DOM
-
2025-10-17price $165,000 304-char remark
Show marketing remark (304 chars)
Great location, out of the city with beautiful trees, fenced and ready to be made your own. Older mobile home could be remodeled or removed and a new dream home built. Beautiful properties being built in this rural subdivision. This is your opportunity to get 2 acres at a reasonable price. Check it out!
-
2025-09-16price $174,000 304-char remark
Show marketing remark (304 chars)
Great location, out of the city with beautiful trees, fenced and ready to be made your own. Older mobile home could be remodeled or removed and a new dream home built. Beautiful properties being built in this rural subdivision. This is your opportunity to get 2 acres at a reasonable price. Check it out!
-
2025-01-13price $194,000 304-char remark
Show marketing remark (304 chars)
Great location, out of the city with beautiful trees, fenced and ready to be made your own. Older mobile home could be remodeled or removed and a new dream home built. Beautiful properties being built in this rural subdivision. This is your opportunity to get 2 acres at a reasonable price. Check it out!
-
2024-11-08$199,000 Active 304-char remark
Show marketing remark (304 chars)
Great location, out of the city with beautiful trees, fenced and ready to be made your own. Older mobile home could be remodeled or removed and a new dream home built. Beautiful properties being built in this rural subdivision. This is your opportunity to get 2 acres at a reasonable price. Check it out!
ⓘ Source: listings_history table (triggers on properties + properties_extension) + one-shot
backfill from property_details.listing_events for pre-trigger history.
Tax reassessment forecast TX · Resets to sale price
- Current annual tax
- $1,361 · $113/mo
- Projected year-2 tax
- $2,743 · $229/mo
- Expected delta
- +$1,382/yr (+$115/mo · 101.5%)
ⓘ Screening estimate from a state-policy table — verify with the county assessor before closing.
Climate risk First Street
- Flood 1/10 Low FEMA zone X (unshaded) · 0% chance over 30 yrs
- Wildfire 8/10 Severe
- Heat 7/10 Severe 7 d/yr ≥110°F today · 21 d/yr by 30 yrs out
- Wind 4/10 Moderate 18% chance of damaging wind over 30 yrs
- Air quality 1/10 Low 0 unhealthy d/yr today · 0 by 30 yrs out
Nearby sold comps map
Loading sold comps map…
Walkable amenities ~0.75 mi
Loading nearby amenities…
Taxation est. · year 1
- Rental income
- $17,014
- − Mortgage interest
- −$8,397
- − Property taxes
- −$1,361
- − Insurance
- −$750
- − Repairs & maintenance
- −$1,361
- − Management
- −$1,361
- − Depreciation
- −$4,361
- Taxable loss
- −$577
- Est. tax savings @ 24.0%
- +$138
- After-tax cash flow
- $2,035/yr
For passive investors: Depreciation is non-cash, so a rental often shows a tax loss while cash-flowing — sheltering income. Rental losses are passive: they offset passive income freely, and up to $25,000/yr can offset ordinary (W-2) income if you actively participate and your MAGI is under $100k (phasing out to $0 by $150k); unused losses carry forward. On sale, claimed depreciation is recaptured at up to 25%, and gains may owe capital-gains tax (a 1031 exchange can defer both). Figures are a year-1 estimate at your 24.0% rate — not tax advice; consult a CPA.
Condition & rehab AI · 9 photos
This mobile home is in poor condition with extensive repairs and maintenance needed. Significant potential exists for increased value through renovation and landscaping improvements.
Repairs flagged
- Major exterior siding — Significant damage and wear
- Major roof — Significant damage and wear
- Major flooring — Significant damage and wear
- Major interior walls/paint — Significant damage and wear
- Major HVAC/mechanicals — No visible signs of HVAC/mechanicals in the photos
- Major landscaping — Overgrown and in poor condition
Value-add opportunities
- Both Remodel or replace the mobile home — Significant potential for increased value through renovation
- Both Landscaping and curb appeal improvements — Improving the appearance can increase both resale and rental value
Renovation cost estimate screening
| Repair item | Severity | Est. cost |
|---|---|---|
| exterior siding · Significant damage and wear | Major | $15,000–50,000 |
| roof · Significant damage and wear | Major | $15,000–50,000 |
| flooring · Significant damage and wear | Major | $15,000–50,000 |
| interior walls/paint · Significant damage and wear | Major | $15,000–50,000 |
| HVAC/mechanicals · No visible signs of HVAC/mechanicals in the photos | Major | $15,000–50,000 |
| landscaping · Overgrown and in poor condition | Major | $15,000–50,000 |
| Total estimated repair cost · 6 items | $90,000–300,000 |
Value-add ROI direction
- Both Remodel or replace the mobile home — Significant potential for increased value through renovation ↑
- Both Landscaping and curb appeal improvements — Improving the appearance can increase both resale and rental value ↑
ⓘ Cost ranges are severity-bucket heuristics (US national rule-of-thumb). Get contractor quotes + a written scope before underwriting a rehab budget.
Schools (NCES district)
- District
- Bridgeport ISD
- NCES district ID
- 4811340
- Math proficiency
- 41% ▼ -4.00%
- Reading proficiency
- 41% ▲ 3.00%
- Median HH income
- $51,866
- Composite
- 35.51/100
- National rank
- #4913
- State rank
- #356 of 826 in TX
Livability — Bridgeport
- Score
- 68/100
- State rank
- #472
- US rank
- #9507
Category grades
Schools grade is shown separately in the Schools card above.
Census & demographics
- County
- Wise County · 49,037 people
- Metro
- Dallas-Fort Worth-Arlington, TX
- Population (ZIP)
- 11,632
- Household income
- $92,130
- Rent vs Own
- Severe rent burden
- 74.0
Population outlook (Wise County) Hauer SSP2
- Today (2025)
- 71,620 people
- By 2030
- 75,858 · +5.9%
- By 2040
- 83,908 · +17.2%
- By 2050
- 90,717 · +26.7%
- By 2075
- 107,583 · +50.2%
- By 2100
- 114,996 · +60.6%
Race, ethnicity, and origin ACS 2023
- Neighborhood character
- Majority White (60%)
- Race & ethnicity
- White 60% Hispanic / Latino 32% Two or more races 9% Black 2% Asian 1% Native American 1%
- Hispanic origin (detail)
- Mexican 31%
- Common ancestry
- Slovak 1% Lithuanian 1% Romanian 1%
- Foreign-born
- 14% · Canada, Vietnam
- Languages at home
- 72% English-only · Spanish 27%
Political lean MEDSL · Wise
- 2024 margin
- Solid R (+70.0) · D 14.7% · R 84.7%
- 2008→2024 swing
- -14.3pp toward R · 2008: -55.7pp · 2024: -70.0pp
- All cycles
- 2024: R+70.0 2020: R+68.2 2016: R+69.9 2012: R+67.5 2008: R+55.7
Not yet ingested
- Civics
- —
Market trends
- HPI YoY
- ▼ -0.82%
- Current HPI
- 417.89
- Rent YoY
- —
- Metro
- Dallas-Fort Worth-Arlington, TX
- State GDP YoY
- ▲ 3.95%
- F500 in state
- 110
Industry mix (Fortune 500 HQ in TX)
| Industry | F500 HQs | Revenue |
|---|---|---|
| Energy | 16 | $1,198B |
|
||
| Technology | 5 | $198B |
|
||
| Engineering / Construction | 4 | $72B |
|
||
| Energy Services | 3 | $60B |
|
||
| Utilities | 3 | $41B |
|
||
| Healthcare | 2 | $330B |
|
||
Price history
-17.1% since first listed4 events — show timeline
- 2025-10-17 Price Changed $165,000 NTREIS
- 2025-09-16 Price Changed $174,000 NTREIS
- 2025-01-13 Price Changed $194,000 NTREIS
- 2024-11-08 Listed $199,000 NTREIS
Property tax history
-0.1%/yrLatest (2025): $1,361 · -19.5% YoY. Source: county tax records.
Cash-flow waterfall
monthlySold comps — $/sqft
last 12 mo · ≤1 miLoading sold comps…