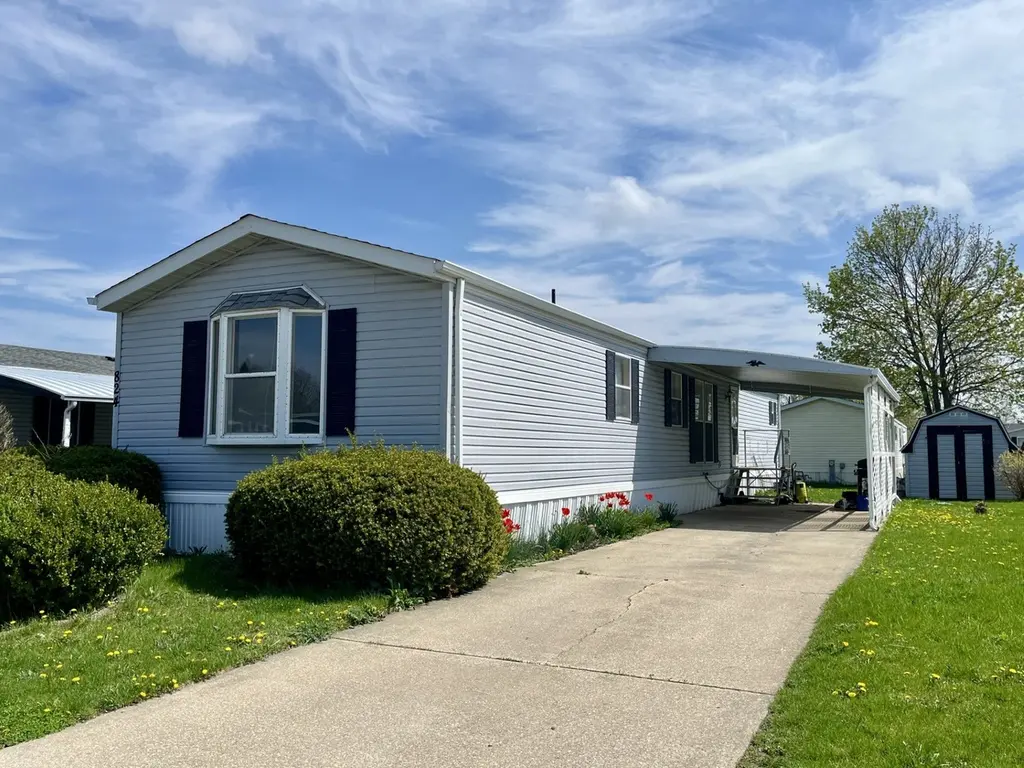
824 Springdale Ln · DeKalb, IL
Flood risk 1/10 · Minimal
- FEMA flood zone
- X (unshaded)
- Chance of flooding over 30 yrs
- 0.0%
- Est. flood insurance / yr
- $507 – $1,088
Fire risk 1/10 · Minimal
- Est. fire insurance / yr
- $804 – $1,492
Heat risk 3/10 · Minor
- Hot days now (above 101°F)
- 7 days/yr
- Hot days in 30 yrs
- 15 days/yr
Wind risk 2/10 · Minimal
- Chance of severe wind over 30 yrs
- —
Air-quality risk 3/10 · Minor
- Unhealthy air days now
- 1 days/yr
- Unhealthy air days in 30 yrs
- 3 days/yr
Risk factors via First Street. Map © Google.
Why this score? — see what drove the B- grade
The composite is a weighted blend of 9 inputs, each scored 0–100. Each bar is that input's sub-score; the figure is the points it added to the 100-point composite (weight × sub-score).
- Cash flow +30.0/30.0
- 1% rule +10.0/10.0
- DSCR +10.0/10.0
- ARV discount +7.5/15.0
- Rent growth +4.3/5.0
- Livability +3.9/5.0
- Condition / age +2.2/5.0
- Schools +1.2/10.0
- Appreciation +0.0/10.0
$66,000
🖨 Deal sheet (PDF) 📄 Offer letter ✓ Due diligence
Listing remarks MLS
This spacious 2-bedroom, 2-bath single-wide home offers more room than you'd expect, with an expanded layout that sets it apart from typical homes in its class. Inside, you'll find large, comfortable bedrooms and a centrally located eat-in kitchen that opens to a welcoming living area-perfect for both everyday living and entertaining. The home features a covered front entry with an awning, as well as a generous carport along the driveway side for convenient, protected parking. Located within a private manufactured home community, this property offers both comfort and convenience with easy access to I-88, as well as nearby shopping and dining options. An excellent opportunity for affordable, low-maintenance living in a great location. Call our office today to schedule a tour!
Key facts
- Generous carport
- Expanded layout
- Eat-in kitchen
Tags
Neighborhood map
What this means for you Summary
Snapshot
- This is a 2-bed/2.0-bath manufactured listed at $66k. Condition is rated fair.
Deal economics
- At list price, monthly cash flow is $658 ($8k/yr) — positive.
- The deal already cash-flows at list — no discount required.
- Meets the 1% rule at list price ($1k rent vs $66k).
- Recommended offer: $62k (6.0% below list) — sets the bar for market timing.
- Cap rate 18.3% vs local median 4.4% in DeKalb — top-decile yield for the area; either an underpriced asset or a hidden risk that comps aren't pricing in. Stress-test before assuming the spread holds.
Location & tenants
- Location reads 77/100 on livability (#154 in IL, #2,835 nationally) — a middle-class / working-renter tenant base. Strengths: commute A+, cost of living A+, housing A+; Watch: amenities D+, schools D, crime D-.
- Dekalb CUSD 428 (suburban): math 11% / reading 16% proficiency, ranked #541 of 620 in IL (top 87%) — low school quality limits family demand, transient renter base, plan for 1-2y turnover.
- Market conditions: Rents rising fast (+7.3%/yr); 85 active listings in the ZIP; 5 comparable units currently listed for rent nearby; rentals at typical pace (median 25d on market — plan ~3-4 weeks tenant-placement turnaround); 40% of comp listings sitting > 30 days — soft ceiling on asking rent; 260 units permitted in DeKalb County in 2024 (73 in 5+ unit buildings).
- This rent runs 36% of the median local income ($47k/yr) — at the standard rent-burdened threshold; future hikes will face affordability resistance.
Forward outlook
- Local home prices are declining (-3.0%/yr); year-one equity from $456 of loan paydown is wiped out by about $2k of value loss. Plan a longer hold.
- DeKalb County population projected to shrink 5% by 2050 — rents likely to lag national; underwrite the cash flow, not the appreciation.
- At projected returns (-3.0% appreciation + 7.3% rent growth), your $18k cash investment doubles in ~3 years — after that, you're playing with house money.
Negotiation context
- It's been on market 62 days — a 6% lower offer ($62k) is reasonable based on typical stale-listing flexibility.
Questions for the listing agent
- It's been on market 62 days. Have you received any prior offers? Is the seller open to a 6% concession, seller financing, or rate buy-down credit?
- Have any recent inspections been done? Can we get a copy of the seller's disclosures and any deferred-maintenance estimates?
- Why hasn't it sold? Are there any deal-killer items the seller is aware of (foundation, flood, title, zoning, code violations)?
- Is there a deadline driving the sale (1031 exchange, divorce, estate, relocation)? That informs how much negotiation room exists.
- Schools are D-rated, which usually means shorter tenancies and higher turnover. Who's the typical renter profile here, and what's been the actual vacancy rate?
- Crime grade is D in this area — have there been break-ins, vandalism, or insurance claims at this property in the last 3 years? What carrier currently insures it and at what premium?
- What's the average days-on-market for RENTAL listings here right now (not sales)? A rising rental-DOM trend means longer vacancies and softer asking-rent achievability than the comps imply.
- What's the recent tenant-quality profile in this submarket — average credit score on applications, eviction rate, late-payment / NSF rate, and stable-employment percentage? A property-management company in the area should have these aggregated.
- How much new for-sale + rental construction is in the pipeline within 1–3 miles? Heavy new supply typically softens prices + rents 12–24 months out; constrained supply supports both.
Investment metrics
- 1% rule
- 2.14% ✓
- Cap rate
- 18.25%
- Cash-on-cash
- 42.71%
- DSCR
- 2.90
- GRM
- 3.9
CMA / ARV
No comps found within radius.
Projected returns pro-forma
-3.0% appreciation · 7.33% rent growth · sell at horizon
- IRR
- 44.3%
- Equity multiple
- 3.04×
- Total profit
- $37,629
- Equity at exit
- $9,841
- IRR
- 52.2%
- Equity multiple
- 7.25×
- Total profit
- $115,563
- Equity at exit
- $5,706
Cash invested: $18,480 (down + closing). Projections, not guarantees.
Landlord ↔ Tenant lean methodology
- Overall (STATE)
- 43 Moderately Tenant-Leaning
- State Illinois
- 43 Moderately Tenant-Leaning · D+7
- County
- — inherits STATE
- City
- — inherits STATE
ZIP-level market 60115
- Home prices YoY
- -31.9%
- Rents YoY
- 7.3%
- Active inventory
- 85
- Price-to-rent
- 3.9×
Monthly cashflow live
- Estimated rent
- $1,410 high interval (Pro) →
- Mortgage (P&I)
- −$346
- Tax est. 1.5%
- −$82 /mo · $990/yr
- Insurance
- −$28
- HOA
- −$0
- Vacancy / Maint / Mgmt
- −$296
- Net cashflow
- $658
Break-even live
Sensitivity live
| Price | -10% $703 | -5% $681 | +0% $658 | +5% $635 | +10% $612 |
|---|---|---|---|---|---|
| Rent | -10% $546 | -5% $602 | +0% $658 | +5% $713 | +10% $769 |
| Rate | -1.0pp $691 | -0.5pp $675 | base $658 | +0.5pp $641 | +1.0pp $623 |
UW: 25.0% down · 7.5% · 30yr · 1.5% tax · 5.0% vac · 8.0% maint · 8.0% mgmt
Financing live
Cash to close
- Down payment
- $16,500
- Closing costs
- $1,980
- Reserves months
- —
- Total cash needed
- —
Loan-product check · same deal, 3 products live
Conventional
25% down · 7.5% · 30yr
- Down + closing
- —
- Monthly P&I
- —
- Monthly cashflow
- —
- DSCR
- —
- Eligible?
- —
Personal DTI + credit; lowest rate.
DSCR
20% down · 8.5% · 30yr
- Down + closing
- —
- Monthly P&I
- —
- Monthly cashflow
- —
- DSCR
- —
- Eligible?
- —
No personal income docs; deal must DSCR.
Hard money
10% down · 12.0% · 12mo
- Down + closing
- —
- Monthly P&I
- —
- Monthly cashflow
- —
- DSCR
- —
- Eligible?
- —
Short-term bridge; refi at stabilization.
Rent comps 5 comps
| Address | Beds | Baths | Sqft | Rent | $/sqft | DOM | Units | Dist |
|---|---|---|---|---|---|---|---|---|
| 219 S 7th St DeKalb, IL | 2.0 | 1.5 | 1054 | $1,700 | $1.61 | 7d | 1 | 0.41mi |
| 511 S 3rd St Unit 1 DeKalb, IL | 1.0 | 1.0 | 921 | $1,200 | $1.30 | 44d | 1 | 0.52mi |
| 227 W Locust St Unit 1 DeKalb, IL | 1.0 | 1.0 | 700 | $950 | $1.36 | 25d | 1 | 0.95mi |
| 118 Augusta Ave Apt 10 DeKalb, IL | 1.0 | 1.0 | 750 | $925 | $1.23 | 44d | 1 | 0.96mi |
| 172 Oak Dr DeKalb, IL | 3.0 | 1.0 | 950 | $2,000 | $2.11 | 21d | 1 | 1.38mi |
Listing history 15 events
-
2026-06-18days on market $66,000 Active 62 DOM
-
2026-06-17days on market $66,000 Active 61 DOM
-
2026-06-16days on market $66,000 Active 60 DOM
-
2026-06-15days on market $66,000 Active 59 DOM
-
2026-06-13days on market $66,000 Active 57 DOM
-
2026-06-13days on market $66,000 Active 56 DOM
-
2026-06-09days on market $66,000 Active 53 DOM
-
2026-06-08days on market $66,000 Active 52 DOM
-
2026-06-07days on market $66,000 Active 51 DOM
-
2026-06-04days on market $66,000 Active 48 DOM
-
2026-06-03days on market $66,000 Active 47 DOM
-
2026-06-02days on market $66,000 Active 46 DOM
-
2026-06-01days on market $66,000 Active 45 DOM
-
2026-05-31days on market $66,000 Active 44 DOM
-
2026-04-18$70,000 Active 785-char remark
Show marketing remark (785 chars)
This spacious 2-bedroom, 2-bath single-wide home offers more room than you'd expect, with an expanded layout that sets it apart from typical homes in its class. Inside, you'll find large, comfortable bedrooms and a centrally located eat-in kitchen that opens to a welcoming living area-perfect for both everyday living and entertaining. The home features a covered front entry with an awning, as well as a generous carport along the driveway side for convenient, protected parking. Located within a private manufactured home community, this property offers both comfort and convenience with easy access to I-88, as well as nearby shopping and dining options. An excellent opportunity for affordable, low-maintenance living in a great location. Call our office today to schedule a tour!
ⓘ Source: listings_history table (triggers on properties + properties_extension) + one-shot
backfill from property_details.listing_events for pre-trigger history.
Climate risk First Street
- Flood 1/10 Low FEMA zone X (unshaded) · 0% chance over 30 yrs
- Wildfire 1/10 Low
- Heat 3/10 Moderate 7 d/yr ≥101°F today · 15 d/yr by 30 yrs out
- Wind 2/10 Low
- Air quality 3/10 Moderate 1 unhealthy d/yr today · 3 by 30 yrs out
Nearby sold comps map
Loading sold comps map…
Walkable amenities ~0.75 mi
Loading nearby amenities…
Taxation est. · year 1
- Rental income
- $16,919
- − Mortgage interest
- −$3,697
- − Property taxes
- −$990
- − Insurance
- −$330
- − Repairs & maintenance
- −$1,354
- − Management
- −$1,354
- − Depreciation
- −$1,920
- Taxable income
- $7,275
- Est. tax owed @ 24.0%
- −$1,746
- After-tax cash flow
- $6,147/yr
For passive investors: Depreciation is non-cash, so a rental often shows a tax loss while cash-flowing — sheltering income. Rental losses are passive: they offset passive income freely, and up to $25,000/yr can offset ordinary (W-2) income if you actively participate and your MAGI is under $100k (phasing out to $0 by $150k); unused losses carry forward. On sale, claimed depreciation is recaptured at up to 25%, and gains may owe capital-gains tax (a 1031 exchange can defer both). Figures are a year-1 estimate at your 24.0% rate — not tax advice; consult a CPA.
Condition & rehab AI · 12 photos
This single-wide manufactured home offers a spacious layout with potential for cosmetic upgrades to enhance its curb appeal and interior aesthetics.
Repairs flagged
- Minor Paint — Paint appears faded
- Minor Siding — Light wear on siding
Value-add opportunities
- Both Paint and siding repairs — Enhances curb appeal and interior aesthetics
- Resale Appliance upgrades — Modernizes kitchen and appeals to buyers
- Resale Flooring replacement — Upgrades living spaces and adds value
Renovation cost estimate screening
| Repair item | Severity | Est. cost |
|---|---|---|
| Paint · Paint appears faded | Minor | $500–3,000 |
| Siding · Light wear on siding | Minor | $500–3,000 |
| Total estimated repair cost · 2 items | $1,000–6,000 |
Value-add ROI direction
- Both Paint and siding repairs — Enhances curb appeal and interior aesthetics ↑
- Resale Appliance upgrades — Modernizes kitchen and appeals to buyers ↑
- Resale Flooring replacement — Upgrades living spaces and adds value ↑
ⓘ Cost ranges are severity-bucket heuristics (US national rule-of-thumb). Get contractor quotes + a written scope before underwriting a rehab budget.
Schools (NCES district)
- District
- Dekalb CUSD 428
- NCES district ID
- 1712000
- Math proficiency
- 11% ▼ -9.00%
- Reading proficiency
- 16% ▼ -6.00%
- Median HH income
- $42,007
- Composite
- 11.74/100
- National rank
- #9685
- State rank
- #541 of 620 in IL
Livability — DeKalb
- Score
- 77/100
- State rank
- #154
- US rank
- #2835
Category grades
Schools grade is shown separately in the Schools card above.
Census & demographics
- Census place
- DeKalb, IL
- County
- DeKalb County · 64,760 people
- City population
- 42,536
- Metro
- Chicago-Naperville-Elgin, IL-IN-WI
- Population (ZIP)
- 42,536
- Household income
- $47,043
- Rent vs Own
- Severe rent burden
- 3794.0
Population outlook (DeKalb County) Hauer SSP2
- Today (2025)
- 104,983 people
- By 2030
- 104,428 · -0.5%
- By 2040
- 102,199 · -2.7%
- By 2050
- 99,303 · -5.4%
- By 2075
- 93,978 · -10.5%
- By 2100
- 88,527 · -15.7%
Race, ethnicity, and origin ACS 2023
- Neighborhood character
- Diverse neighborhood (Simpson 0.61)
- Race & ethnicity
- White 58% Hispanic / Latino 18% Black 15% Two or more races 12% Asian 4%
- Hispanic origin (detail)
- Mexican 14% Puerto Rican 2%
- Common ancestry
- Romanian 5% Portuguese 3% Lithuanian 2%
- Foreign-born
- 9% · Canada, China
- Languages at home
- 82% English-only · Spanish 10% Arabic 2% Other Indo-European 2%
Political lean MEDSL · DeKalb
- 2024 margin
- Toss-up / Even · D 50.1% · R 48.1% · Other 1.7%
- 2008→2024 swing
- -14.8pp toward R · 2008: 16.8pp · 2024: 2.0pp
- All cycles
- 2024: D+2.0 2020: D+5.7 2016: D+3.0 2012: D+5.5 2008: D+16.8
Not yet ingested
- Civics
- —
Market trends
- HPI YoY
- ▼ -89.56%
- Current HPI
- 191.1189
- Rent YoY
- ▲ 7.33%
- Metro
- Chicago-Naperville-Elgin, IL-IN-WI
- State GDP YoY
- ▲ 1.59%
- F500 in state
- 60
Industry mix (Fortune 500 HQ in IL)
| Industry | F500 HQs | Revenue |
|---|---|---|
| Insurance | 4 | $201B |
|
||
| Consumer Goods | 4 | $87B |
|
||
| Industrial Machinery | 3 | $64B |
|
||
| Healthcare | 2 | $55B |
|
||
| Retail / Pharmacy | 1 | $148B |
|
||
| Agriculture / Food | 1 | $86B |
|
||
Price history
1 event — show timeline
- 2026-04-18 Listed $70,000 Zillow
Cash-flow waterfall
monthlySold comps — $/sqft
last 12 mo · ≤1 miLoading sold comps…