 Multi-family
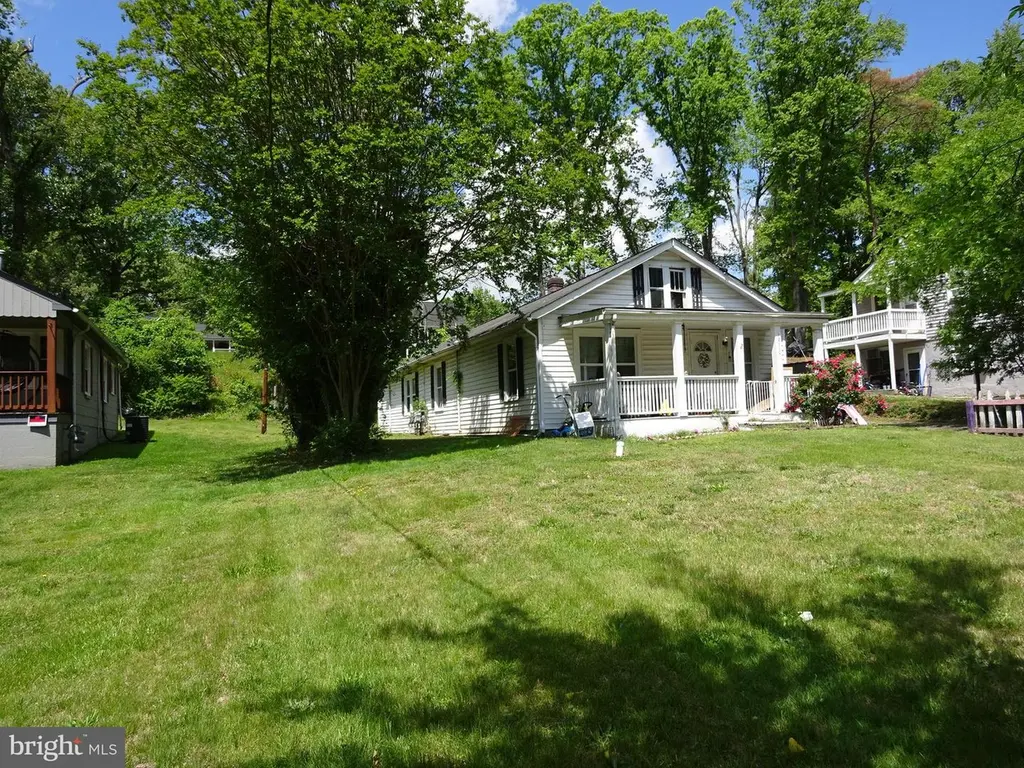
18610 Old Triangle Rd Rd · Triangle, VA
Flood risk 8/10 · Major
- FEMA flood zone
- X (unshaded)
- Chance of flooding over 30 yrs
- 0.99%
- Est. flood insurance / yr
- $507 – $1,088
Fire risk 3/10 · Minor
- Est. fire insurance / yr
- $666 – $1,236
Heat risk 8/10 · Major
- Hot days now (above 104°F)
- 7 days/yr
- Hot days in 30 yrs
- 16 days/yr
Wind risk 4/10 · Minor
- Chance of severe wind over 30 yrs
- 17.0%
Air-quality risk 2/10 · Minimal
- Unhealthy air days now
- 1 days/yr
- Unhealthy air days in 30 yrs
- 1 days/yr
Risk factors via First Street. Map © Google.
Why this score? — see what drove the F grade
The composite is a weighted blend of 9 inputs, each scored 0–100. Each bar is that input's sub-score; the figure is the points it added to the 100-point composite (weight × sub-score).
- ARV discount +15.0/15.0
- Schools +5.8/10.0
- Livability +3.7/5.0
- Cash flow +2.7/30.0
- Rent growth +2.5/5.0
- Condition / age +2.5/5.0
- 1% rule +0.0/10.0
- DSCR +0.0/10.0
- Appreciation +0.0/10.0
$380,000
🖨 Deal sheet 📄 Offer letter ✓ Due diligence
Multi-family units
County records classify this as Multi-Family (5+ Unit). Listing-text estimate: 1 unit. estimate disagrees with records
5+ unit building — per-unit beds/baths from public records are typically unavailable; the breakdown below (if shown) is an estimate from the listing text.
Listing remarks
READ CAREFULLY: BY APPOINTMENT ONLY This is an older home sitting on 1/4-acre lot being sold "AS IS". The home is currently being rented and will only be shown by appointment only. To schedule an appointment for showings, contact the listing agent directly. There are 2 homes located on this 1/4 acre lot. The main home will require renovations and the second home behind the main home is most likely a tear down and not safe to enter. The value is in the lot itself. Great location with tremendous opportunity for investors/builders. There are many new homes being built on Old Triangle Rd. There are utilities to the main home. There are a total of 3 bedrooms and 2 bathrooms in the mai
Key facts
- 0.25 acre lot
- 4 parking spots
- Built 1945
Property features AI
Exterior
- Parking: Gravel driveway; Driveway parking with four spaces (four driveway/total parking spaces)
- Utilities: Public water; Public sewer; Electric service available; Natural gas available
- Home design: Detached property; Combination construction
- Construction: Slab foundation; Combination construction materials; Above-grade finished space per assessor
- Exterior features: Lot dimensions per assessor
Interior
- Bedrooms: Three main-level bedrooms
- Bathrooms: Two full bathrooms (both on the main level)
- Heating & cooling: Electric baseboard heating and other heating; Window air conditioning units (electric); Electric hot water
- Interior features: No basement; Living area per assessor
Neighborhood map
What this means for you Summary
Snapshot
- This is a 1-bed/1.0-bath multifamily listed at $380k.
Deal economics
- At list price, monthly cash flow is $-1k ($-16k/yr) — negative.
- To cash-flow at today's rent, offer at most $140k (63.1% below list).
- To meet the 1% rule (rent ≥ 1% of price), the offer needs to be $145k (61.9% below list).
- Recommended offer: $140k (63.1% below list) — sets the bar for cash-flow.
- Cap rate 2.2% vs local median 3.2% in Triangle — below-typical yield; the buyer is paying a premium for something (appreciation thesis, condition, location) that the cap rate doesn't capture.
Location & tenants
- Location reads 74/100 on livability (#156 in VA, #4,926 nationally) — a middle-class / working-renter tenant base. Strengths: crime A+, employment A+, housing A-; Watch: amenities F, cost of living F.
- Prince William County Public School District (suburban): math 54% / reading 72% proficiency, ranked #30 of 131 in VA (top 23%) — acceptable for families but not a draw, mixed tenant base, ~2y average lease.
- Market conditions: 51 active listings in the ZIP; 2 comparable units currently listed for rent nearby; solid renter incomes; 1,418 units permitted in Prince William County in 2024 (625 in 5+ unit buildings).
- This rent is only 16% of the median local income ($110k/yr) — well below the 30% rent-burden line; pricing power to push rent on renewal without tenant pushback.
Forward outlook
- Local home prices are declining (-3.0%/yr); year-one equity from $3k of loan paydown is wiped out by about $11k of value loss. Plan a longer hold.
- Prince William County population projected at +37% by 2050 — long-run rental-demand tailwind backs the buy-and-hold thesis.
Negotiation context
- It's been on market 48 days — a 3% lower offer ($369k) is reasonable based on typical stale-listing flexibility.
- Current owner paid $45k; list at $380k implies a 744% gain — meaningful room to come down on a strong offer.
Risks & watch-outs
- Watch-outs: flood insurance adds $66/mo; built in 1945 — expect roof / HVAC / electrical / plumbing capex.
- Climate carrying-cost: severe flood risk; extreme-heat days projected 7→16/yr by 2055 (HVAC capex compounding) — expect insurance premiums to compound above CPI over the hold.
Questions for the listing agent
- What do current leases actually rent for vs. the listed asking? Can we see a recent rent roll and the last 12 months of T-12 income?
- It's been on market 48 days. Have you received any prior offers? Is the seller open to a 63% concession, seller financing, or rate buy-down credit?
- Built in 1945 — when were the roof, HVAC, electrical panel, plumbing, and water heater last replaced?
- What's the actual annual flood-insurance premium (NFIP or private), and is the property in a SFHA with mandatory coverage?
- Is there a deadline driving the sale (1031 exchange, divorce, estate, relocation)? That informs how much negotiation room exists.
- Schools are B-rated — typically a magnet for longer-tenancy family renters. What's the average tenant stay here, and is there a school-zone premium baked into asking?
- The area grade is low — what's the realistic commute time and amenity access for the typical tenant pool here? Any planned neighborhood developments (good or bad) we should know about?
- What's the average days-on-market for RENTAL listings here right now (not sales)? A rising rental-DOM trend means longer vacancies and softer asking-rent achievability than the comps imply.
- What's the recent tenant-quality profile in this submarket — average credit score on applications, eviction rate, late-payment / NSF rate, and stable-employment percentage? A property-management company in the area should have these aggregated.
- How much new apartment / multifamily construction is in the pipeline within 1–3 miles? Heavy new supply (>2% of stock underway) typically softens rents 12–24 months out; light construction supports rent growth.
Investment metrics
- 1% rule
- 0.38% ✗
- Cap rate
- 2.22%
- Cash-on-cash
- -14.55%
- DSCR
- 0.35
- GRM
- 21.9
CMA / ARV
- ARV (median comp)
- $473,434
- List price
- $380,000
- Delta
- -19.74%
- Verdict
- UNDERPRICED
- Comps
- 20 within 1.0 mi
Projected returns pro-forma
-3.0% appreciation · 3.0% rent growth · sell at horizon
- IRR
- -45.8%
- Equity multiple
- -0.39×
- Total profit
- $-148,015
- Equity at exit
- $56,659
- IRR
- -85.2%
- Equity multiple
- -1.26×
- Total profit
- $-240,346
- Equity at exit
- $32,855
Cash invested: $106,400 (down + closing). Projections, not guarantees.
Landlord ↔ Tenant lean methodology
- Overall (STATE)
- 55 Moderately Landlord-Leaning
- State Virginia
- 55 Moderately Landlord-Leaning · D+2
- County
- — inherits STATE
- City
- — inherits STATE
ZIP-level market 22172
- Home prices YoY
- -14.0%
- Active inventory
- 51
- Price-to-rent
- 21.9×
Monthly cashflow live
- Estimated rent
- $1,449 medium interval (Pro) →
- Mortgage (P&I)
- −$1,993
- Tax from tax record
- −$283 /mo · $3,399/yr
- Insurance
- −$158
- Flood insurance flood zone
- −$66 /mo · $798/yr
- HOA
- −$0
- Vacancy / Maint / Mgmt
- −$304
- Net cashflow
- $-1,356
Break-even live
UW: 25.0% down · 7.5% · 30yr · 1.5% tax · 5.0% vac · 8.0% maint · 8.0% mgmt
Financing live
Cash to close
- Down payment
- $95,000
- Closing costs
- $11,400
- Reserves months
- —
- Total cash needed
- —
Loan-product check · same deal, 3 products live
Conventional
25% down · 7.5% · 30yr
- Down + closing
- —
- Monthly P&I
- —
- Monthly cashflow
- —
- DSCR
- —
- Eligible?
- —
Personal DTI + credit; lowest rate.
DSCR
20% down · 8.5% · 30yr
- Down + closing
- —
- Monthly P&I
- —
- Monthly cashflow
- —
- DSCR
- —
- Eligible?
- —
No personal income docs; deal must DSCR.
Hard money
10% down · 12.0% · 12mo
- Down + closing
- —
- Monthly P&I
- —
- Monthly cashflow
- —
- DSCR
- —
- Eligible?
- —
Short-term bridge; refi at stabilization.
Rent comps 2 comps
| Address | Beds | Baths | Sqft | Rent | $/sqft | DOM | Units | Dist |
|---|---|---|---|---|---|---|---|---|
| 18413 Cedar Dr Triangle, VA | 2.0 | 1.0 | 1400 | $1,800 | $1.29 | 15d | 1 | 1.10mi |
| 17929 Milroy Dr Dumfries, VA | 1.0 | 1.0 | 2020 | $1,200 | $0.59 | 15d | 1 | 1.26mi |
Listing history 16 events
-
2026-06-17days on market $380,000 Active 48 DOM
-
2026-06-16days on market $380,000 Active 47 DOM
-
2026-06-15days on market $380,000 Active 46 DOM
-
2026-06-13days on market $380,000 Active 44 DOM
-
2026-06-09days on market $380,000 Active 40 DOM
-
2026-06-08days on market $380,000 Active 39 DOM
-
2026-06-07remarks 689-char remark
-
2026-06-07days on market $380,000 Active 38 DOM
-
2026-06-04days on market $380,000 Active 35 DOM
-
2026-06-03days on market $380,000 Active 34 DOM
-
2026-06-02days on market $380,000 Active 33 DOM
-
2026-06-01days on market $380,000 Active 32 DOM
-
2026-05-31days on market $380,000 Active 31 DOM
-
2026-04-30$380,000 Active 563-char remark
-
1985-01-01soldstatus $45,000
-
1985-01-01soldstatus $45,000
ⓘ Source: listings_history table (triggers on properties + properties_extension) + one-shot
backfill from property_details.listing_events for pre-trigger history.
Tax reassessment forecast VA · Resets to sale price
- Current annual tax
- $3,399 · $283/mo
- Projected year-2 tax
- $3,399 · $283/mo
- Expected delta
- $0/yr ($0/mo · 0.0%)
ⓘ Screening estimate from a state-policy table — verify with the county assessor before closing.
Climate risk First Street
- Flood 8/10 Severe FEMA zone X (unshaded) · 99% chance over 30 yrs
- Wildfire 3/10 Moderate
- Heat 8/10 Severe 7 d/yr ≥104°F today · 16 d/yr by 30 yrs out
- Wind 4/10 Moderate 17% chance of damaging wind over 30 yrs
- Air quality 2/10 Low 1 unhealthy d/yr today · 1 by 30 yrs out
Nearby sold comps map
Loading sold comps map…
Walkable amenities ~0.75 mi
Loading nearby amenities…
Taxation est. · year 1
- Rental income
- $17,385
- − Mortgage interest
- −$21,286
- − Property taxes
- −$3,399
- − Insurance
- −$2,698
- − Repairs & maintenance
- −$1,391
- − Management
- −$1,391
- − Depreciation
- −$11,055
- Taxable loss
- −$23,834
- Est. tax savings @ 24.0%
- +$5,720
- After-tax cash flow
- $-10,556/yr
For passive investors: Depreciation is non-cash, so a rental often shows a tax loss while cash-flowing — sheltering income. Rental losses are passive: they offset passive income freely, and up to $25,000/yr can offset ordinary (W-2) income if you actively participate and your MAGI is under $100k (phasing out to $0 by $150k); unused losses carry forward. On sale, claimed depreciation is recaptured at up to 25%, and gains may owe capital-gains tax (a 1031 exchange can defer both). Figures are a year-1 estimate at your 24.0% rate — not tax advice; consult a CPA.
Schools (NCES district)
- District
- Prince William County Public School District
- NCES district ID
- 5103130
- Math proficiency
- 54% ▼ -28.00%
- Reading proficiency
- 72% ▼ -7.00%
- Median HH income
- $96,347
- Composite
- 57.92/100
- National rank
- #1041
- State rank
- #30 of 131 in VA
Livability — Triangle
- Score
- 74/100
- State rank
- #156
- US rank
- #4926
Category grades
Schools grade is shown separately in the Schools card above.
Census & demographics
- Census place
- Triangle, VA
- County
- Prince William County · 452,627 people
- City population
- 11,490
- Metro
- Washington-Arlington-Alexandria, DC-VA-MD-WV
- Population (ZIP)
- 11,490
- Household income
- $109,956
- Rent vs Own
- Severe rent burden
- 364.0
Population outlook (Prince William County) Hauer SSP2
- Today (2025)
- 539,759 people
- By 2030
- 582,629 · +7.9%
- By 2040
- 665,916 · +23.4%
- By 2050
- 740,796 · +37.2%
- By 2075
- 900,980 · +66.9%
- By 2100
- 985,833 · +82.6%
Race, ethnicity, and origin ACS 2023
- Neighborhood character
- Highly diverse neighborhood (Simpson 0.73)
- Race & ethnicity
- Black 40% Hispanic / Latino 22% White 21% Two or more races 14% Asian 13% Native American 2%
- Hispanic origin (detail)
- Mexican 3% Puerto Rican 4%
- Common ancestry
- Portuguese 1% Romanian 1% Scottish 1%
- Foreign-born
- 25% · Canada, South Korea, Jamaica
- Languages at home
- 64% English-only · Spanish 19% Other Indo-European 9% French/Haitian/Cajun 2%
Political lean MEDSL · Prince William
- 2024 margin
- D (+18.0) · D 57.6% · R 39.6% · Other 2.8%
- 2008→2024 swing
- +2.1pp toward D · 2008: 15.9pp · 2024: 18.0pp
- All cycles
- 2024: D+18.0 2020: D+27.0 2016: D+20.0 2012: D+16.0 2008: D+15.9
Not yet ingested
- Civics
- —
Market trends
- HPI YoY
- ▼ -45.31%
- Current HPI
- 278.5511
- Rent YoY
- —
- Metro
- Washington-Arlington-Alexandria, DC-VA-MD-WV
- State GDP YoY
- ▲ 2.40%
- F500 in state
- 50
Industry mix (Fortune 500 HQ in VA)
| Industry | F500 HQs | Revenue |
|---|---|---|
| Aerospace / Defense | 4 | $236B |
|
||
| Technology / Defense | 3 | $32B |
|
||
| Financial Services | 2 | $176B |
|
||
| Utilities | 2 | $27B |
|
||
| Insurance | 2 | $25B |
|
||
| Technology | 2 | $15B |
|
||
Price history
+744.4% since first listed4 events — show timeline
- 2026-06-17 Listing Removed — BRIGHT MLS
- 2026-04-30 Listed $380,000 BRIGHT MLS
- 1985-01-01 Sold (Public Records) $45,000 Public Records
- 1985-01-01 Sold (Public Records) $45,000 Public Records
Property tax history
+1.9%/yrLatest (2025): $3,399 · +9.1% YoY. Source: county tax records.
Cash-flow waterfall
monthlySold comps — $/sqft
last 12 mo · ≤1 miLoading sold comps…