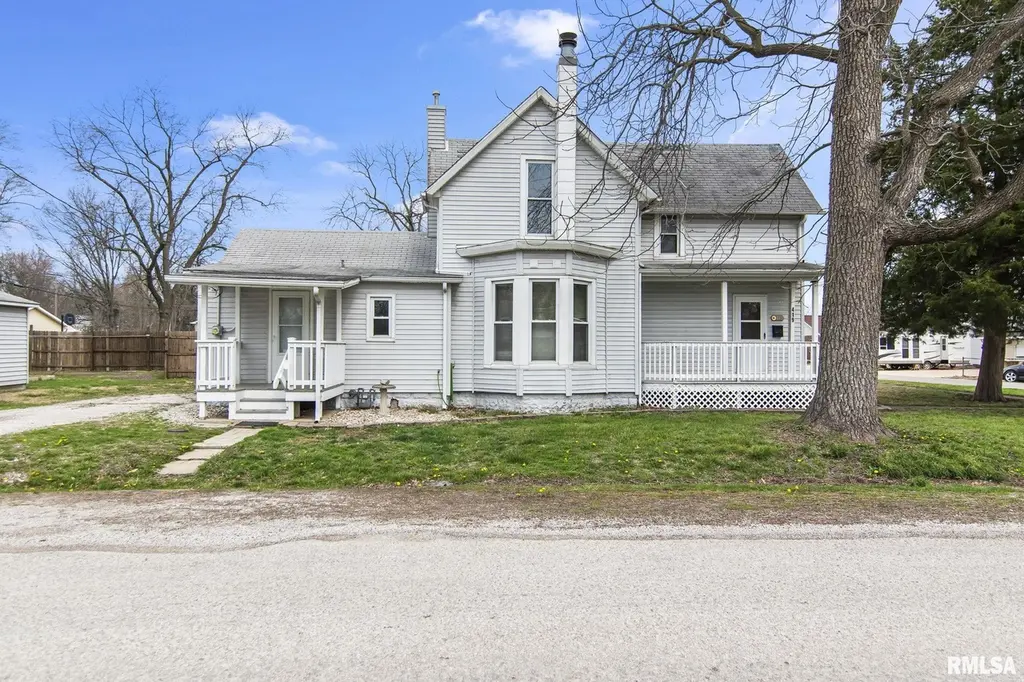
419 S 5th St · Girard, IL
Flood risk 1/10 · Minimal
- FEMA flood zone
- —
- Chance of flooding over 30 yrs
- 0.0%
- Est. flood insurance / yr
- —
Fire risk 1/10 · Minimal
- Est. fire insurance / yr
- $804 – $1,492
Heat risk 4/10 · Minor
- Hot days now (above 106°F)
- 7 days/yr
- Hot days in 30 yrs
- 20 days/yr
Wind risk 2/10 · Minimal
- Chance of severe wind over 30 yrs
- 2.0%
Air-quality risk 2/10 · Minimal
- Unhealthy air days now
- 1 days/yr
- Unhealthy air days in 30 yrs
- 2 days/yr
Risk factors via First Street. Map © Google.
Why this score? — see what drove the B grade
The composite is a weighted blend of 9 inputs, each scored 0–100. Each bar is that input's sub-score; the figure is the points it added to the 100-point composite (weight × sub-score).
- Cash flow +30.0/30.0
- 1% rule +10.0/10.0
- DSCR +10.0/10.0
- ARV discount +7.5/15.0
- Schools +5.0/10.0
- Livability +3.2/5.0
- Rent growth +2.5/5.0
- Condition / age +2.5/5.0
- Appreciation +0.0/10.0
$58,000
🖨 Deal sheet 📄 Offer letter ✓ Due diligence
Listing remarks MLS
This 4-bedroom family home sits on a desirable corner lot and offers incredible potential for the right buyer. Featuring a detached garage and additional carport, there’s plenty of space for parking and storage. Inside, you’ll find new laminate flooring in the kitchen, new carpet throughout the main floor, and an updated bathroom. With a little vision and finishing touches, this fixer-upper could be transformed into your dream home. Don’t miss this opportunity to invest in a property with endless possibilities!
Key facts
- Additional carport
- Updated bathroom
- Detached garage
Tags
Neighborhood map
What this means for you Summary
Snapshot
- This is a 4-bed/1.0-bath single-family listed at $58k.
Deal economics
- At list price, monthly cash flow is $563 ($7k/yr) — positive.
- The deal already cash-flows at list — no discount required.
- Meets the 1% rule at list price ($1k rent vs $58k).
- Recommended offer: $55k (6.0% below list) — sets the bar for market timing.
Location & tenants
- Location reads 63/100 on livability (#787 in IL) — a middle-class / working-renter tenant base. Strengths: cost of living A+, housing A+, crime A; Watch: schools F, amenities F, commute F.
- Market conditions: 14 active listings in the ZIP; 70 units permitted in Macoupin County in 2024 (0 in 5+ unit buildings).
Forward outlook
- Local home prices are declining (-3.0%/yr); year-one equity from $401 of loan paydown is wiped out by about $2k of value loss. Plan a longer hold.
- Macoupin County population projected at -27% by 2050 — secular population decline; favor cash flow + early exit over multi-decade hold.
- At projected returns (-3.0% appreciation + 3.0% rent growth), your $16k cash investment doubles in ~3 years — after that, you're playing with house money.
Negotiation context
- It's been on market 78 days — a 6% lower offer ($55k) is reasonable based on typical stale-listing flexibility.
Questions for the listing agent
- It's been on market 78 days. Have you received any prior offers? Is the seller open to a 6% concession, seller financing, or rate buy-down credit?
- Why hasn't it sold? Are there any deal-killer items the seller is aware of (foundation, flood, title, zoning, code violations)?
- Is there a deadline driving the sale (1031 exchange, divorce, estate, relocation)? That informs how much negotiation room exists.
- Schools are F-rated, which usually means shorter tenancies and higher turnover. Who's the typical renter profile here, and what's been the actual vacancy rate?
- What's the average days-on-market for RENTAL listings here right now (not sales)? A rising rental-DOM trend means longer vacancies and softer asking-rent achievability than the comps imply.
- What's the recent tenant-quality profile in this submarket — average credit score on applications, eviction rate, late-payment / NSF rate, and stable-employment percentage? A property-management company in the area should have these aggregated.
- How much new for-sale + rental construction is in the pipeline within 1–3 miles? Heavy new supply typically softens prices + rents 12–24 months out; constrained supply supports both.
Investment metrics
- 1% rule
- 2.18% ✓
- Cap rate
- 17.94%
- Cash-on-cash
- 41.61%
- DSCR
- 2.85
- GRM
- 3.8
CMA / ARV
- ARV (median comp)
- $150,596
- List price
- $58,000
- Delta
- -61.49%
- Verdict
- UNDERPRICED
- Comps
- 20 within 1.0 mi
Show comp detail 10 sales within ~0.75 mi
| Address | Dist | Beds/Ba | Sqft | Sold | Price | $/sf | Match |
|---|---|---|---|---|---|---|---|
| 522 W South | 0.04mi | 4/2.0 | 1,981 (+9%) | 16mo | $32,000 | $16 | 66 |
| 616 W Monroe St | 0.14mi | 3/2.0 (-1) | 1,850 (+2%) | 23mo | $22,616 | $12 | 62 |
| 417 W Franklin St | 0.05mi | 3/2.0 (-1) | 1,611 (-11%) | 10mo | $67,000 | $42 | 62 |
| 209 S 5th St | 0.14mi | 3/1.0 (-1) | 1,568 (-14%) | 11mo | $23,801 | $15 | 56 |
| 308 W Jefferson St | 0.34mi | 3/2.0 (-1) | 1,724 (-5%) | 22mo | $99,000 | $57 | 48 |
| 537 N 2nd St | 0.60mi | 4/2.0 | 1,902 (+5%) | 15mo | $190,000 | $100 | 48 |
| 333 Shady Ln | 0.51mi | 3/2.0 (-1) | 1,860 (+2%) | 23mo | $174,900 | $94 | 44 |
| 223 S Rachel Rd | 0.65mi | 3/2.0 (-1) | 1,846 (+2%) | 21mo | $212,000 | $115 | 40 |
| 112 Rachel Rd | 0.64mi | 3/2.0 (-1) | 1,668 (-8%) | 9mo | $199,000 | $119 | 40 |
| 402 S 9th St | 0.29mi | 3/2.0 (-1) | 1,600 (-12%) | 22mo | $182,000 | $114 | 39 |
Match score weights: distance 35% · size 25% · config 20% · recency 20%. Top-matched comps best support the ARV.
Projected returns pro-forma
-3.0% appreciation · 3.0% rent growth · sell at horizon
- IRR
- 38.2%
- Equity multiple
- 2.63×
- Total profit
- $26,507
- Equity at exit
- $8,648
- IRR
- 44.8%
- Equity multiple
- 5.28×
- Total profit
- $69,429
- Equity at exit
- $5,015
Cash invested: $16,240 (down + closing). Projections, not guarantees.
Landlord ↔ Tenant lean methodology
- Overall (STATE)
- 43 Moderately Tenant-Leaning
- State Illinois
- 43 Moderately Tenant-Leaning · D+7
- County
- — inherits STATE
- City
- — inherits STATE
ZIP-level market 62640
- Home prices YoY
- -17.8%
- Active inventory
- 14
- Price-to-rent
- 3.8×
Monthly cashflow live
- Estimated rent
- $1,265 medium interval (Pro) →
- Mortgage (P&I)
- −$304
- Tax from tax record
- −$108 /mo · $1,292/yr
- Insurance
- −$24
- HOA
- −$0
- Vacancy / Maint / Mgmt
- −$266
- Net cashflow
- $563
Break-even live
UW: 25.0% down · 7.5% · 30yr · 1.5% tax · 5.0% vac · 8.0% maint · 8.0% mgmt
Financing live
Cash to close
- Down payment
- $14,500
- Closing costs
- $1,740
- Reserves months
- —
- Total cash needed
- —
Loan-product check · same deal, 3 products live
Conventional
25% down · 7.5% · 30yr
- Down + closing
- —
- Monthly P&I
- —
- Monthly cashflow
- —
- DSCR
- —
- Eligible?
- —
Personal DTI + credit; lowest rate.
DSCR
20% down · 8.5% · 30yr
- Down + closing
- —
- Monthly P&I
- —
- Monthly cashflow
- —
- DSCR
- —
- Eligible?
- —
No personal income docs; deal must DSCR.
Hard money
10% down · 12.0% · 12mo
- Down + closing
- —
- Monthly P&I
- —
- Monthly cashflow
- —
- DSCR
- —
- Eligible?
- —
Short-term bridge; refi at stabilization.
Listing history 18 events
-
2026-06-18days on market $58,000 Under Contract 78 DOM
-
2026-06-17days on market $58,000 Under Contract 77 DOM
-
2026-06-16days on market $58,000 Under Contract 76 DOM
-
2026-06-15days on market $58,000 Under Contract 75 DOM
-
2026-06-13days on market $58,000 Under Contract 73 DOM
-
2026-06-12days on market $58,000 Under Contract 72 DOM
-
2026-06-09days on market $58,000 Under Contract 69 DOM
-
2026-06-08days on market $58,000 Under Contract 68 DOM
-
2026-06-07days on market $58,000 Under Contract 67 DOM
-
2026-06-07days on market $58,000 Under Contract 66 DOM
-
2026-06-04days on market $58,000 Under Contract 63 DOM
-
2026-06-02days on market $58,000 Under Contract 62 DOM
-
2026-06-01days on market $58,000 Under Contract 61 DOM
-
2026-05-31days on market $58,000 Under Contract 60 DOM
-
2026-05-31days on market $58,000 Under Contract 59 DOM
-
2026-05-04historical Under Contract 534-char remark
Show marketing remark (534 chars)
This 4-bedroom family home sits on a desirable corner lot and offers incredible potential for the right buyer. Featuring a detached garage and additional carport, there’s plenty of space for parking and storage. Inside, you’ll find new laminate flooring in the kitchen, new carpet throughout the main floor, and an updated bathroom. With a little vision and finishing touches, this fixer-upper could be transformed into your dream home. Don’t miss this opportunity to invest in a property with endless possibilities!
-
2026-04-25price $58,000 534-char remark
Show marketing remark (534 chars)
This 4-bedroom family home sits on a desirable corner lot and offers incredible potential for the right buyer. Featuring a detached garage and additional carport, there’s plenty of space for parking and storage. Inside, you’ll find new laminate flooring in the kitchen, new carpet throughout the main floor, and an updated bathroom. With a little vision and finishing touches, this fixer-upper could be transformed into your dream home. Don’t miss this opportunity to invest in a property with endless possibilities!
-
2026-03-31$62,000 Active 534-char remark
Show marketing remark (534 chars)
This 4-bedroom family home sits on a desirable corner lot and offers incredible potential for the right buyer. Featuring a detached garage and additional carport, there’s plenty of space for parking and storage. Inside, you’ll find new laminate flooring in the kitchen, new carpet throughout the main floor, and an updated bathroom. With a little vision and finishing touches, this fixer-upper could be transformed into your dream home. Don’t miss this opportunity to invest in a property with endless possibilities!
ⓘ Source: listings_history table (triggers on properties + properties_extension) + one-shot
backfill from property_details.listing_events for pre-trigger history.
Tax reassessment forecast IL · Partial reset (capped growth)
- Current annual tax
- $1,292 · $108/mo
- Projected year-2 tax
- $1,304 · $109/mo
- Expected delta
- +$12/yr (+$1/mo · 0.9%)
ⓘ Screening estimate from a state-policy table — verify with the county assessor before closing.
Climate risk First Street
- Flood 1/10 Low 0% chance over 30 yrs
- Wildfire 1/10 Low
- Heat 4/10 Moderate 7 d/yr ≥106°F today · 20 d/yr by 30 yrs out
- Wind 2/10 Low 2% chance of damaging wind over 30 yrs
- Air quality 2/10 Low 1 unhealthy d/yr today · 2 by 30 yrs out
Nearby sold comps map
Loading sold comps map…
Walkable amenities ~0.75 mi
Loading nearby amenities…
Taxation est. · year 1
- Rental income
- $15,176
- − Mortgage interest
- −$3,249
- − Property taxes
- −$1,292
- − Insurance
- −$290
- − Repairs & maintenance
- −$1,214
- − Management
- −$1,214
- − Depreciation
- −$1,687
- Taxable income
- $6,230
- Est. tax owed @ 24.0%
- −$1,495
- After-tax cash flow
- $5,262/yr
For passive investors: Depreciation is non-cash, so a rental often shows a tax loss while cash-flowing — sheltering income. Rental losses are passive: they offset passive income freely, and up to $25,000/yr can offset ordinary (W-2) income if you actively participate and your MAGI is under $100k (phasing out to $0 by $150k); unused losses carry forward. On sale, claimed depreciation is recaptured at up to 25%, and gains may owe capital-gains tax (a 1031 exchange can defer both). Figures are a year-1 estimate at your 24.0% rate — not tax advice; consult a CPA.
Schools (NCES district)
No district data.
Livability — Girard
- Score
- 63/100
- State rank
- #787
- US rank
- #15695
Category grades
Schools grade is shown separately in the Schools card above.
Census & demographics
- Census place
- Girard, IL
- Population (ZIP)
- 3,342
Population outlook (Macoupin County) Hauer SSP2
- Today (2025)
- 42,867 people
- By 2030
- 40,796 · -4.8%
- By 2040
- 36,135 · -15.7%
- By 2050
- 31,469 · -26.6%
- By 2075
- 22,102 · -48.4%
- By 2100
- 15,380 · -64.1%
Race, ethnicity, and origin ACS 2023
- Neighborhood character
- Predominantly White (94%)
- Race & ethnicity
- White 94% Two or more races 5% Hispanic / Latino 1%
- Common ancestry
- Lithuanian 4% Romanian 3% Iranian 3%
- Foreign-born
- 1%
- Languages at home
- 98% English-only · Spanish 1%
Political lean MEDSL · Macoupin
- 2024 margin
- Solid R (+39.2) · D 29.4% · R 68.7% · Other 1.9%
- 2008→2024 swing
- -49.0pp toward R · 2008: 9.8pp · 2024: -39.2pp
- All cycles
- 2024: R+39.2 2020: R+36.5 2016: R+35.0 2012: R+7.0 2008: D+9.8
Not yet ingested
- Civics
- —
Market trends
- HPI YoY
- ▼ -39.96%
- Current HPI
- 185.0228
- Rent YoY
- —
- Metro
- —
- State GDP YoY
- ▲ 1.59%
- F500 in state
- 60
Industry mix (Fortune 500 HQ in IL)
| Industry | F500 HQs | Revenue |
|---|---|---|
| Insurance | 4 | $201B |
|
||
| Consumer Goods | 4 | $87B |
|
||
| Industrial Machinery | 3 | $64B |
|
||
| Healthcare | 2 | $55B |
|
||
| Retail / Pharmacy | 1 | $148B |
|
||
| Agriculture / Food | 1 | $86B |
|
||
Price history
-6.5% since first listed3 events — show timeline
- 2026-05-04 Contingent — RMLSA as Distributed by MLS Grid
- 2026-04-25 Price Changed $58,000 RMLSA as Distributed by MLS Grid
- 2026-03-31 Listed $62,000 RMLSA as Distributed by MLS Grid
Property tax history
+5.6%/yrLatest (2024): $1,292 · +7.8% YoY. Source: county tax records.
Cash-flow waterfall
monthlySold comps — $/sqft
last 12 mo · ≤1 miLoading sold comps…