2 Stonytown Rd · Plandome Manor, NY
Flood risk 1/10 · Minimal
- FEMA flood zone
- X (unshaded)
- Chance of flooding over 30 yrs
- 0.0%
- Est. flood insurance / yr
- $473 – $860
Fire risk 1/10 · Minimal
- Est. fire insurance / yr
- $691 – $1,283
Heat risk 6/10 · Moderate
- Hot days now (above 98°F)
- 7 days/yr
- Hot days in 30 yrs
- 16 days/yr
Wind risk 6/10 · Moderate
- Chance of severe wind over 30 yrs
- 27.0%
Air-quality risk 4/10 · Minor
- Unhealthy air days now
- 6 days/yr
- Unhealthy air days in 30 yrs
- 7 days/yr
Risk factors via First Street. Map © Google.
Why this score? — see what drove the C- grade
The composite is a weighted blend of 9 inputs, each scored 0–100. Each bar is that input's sub-score; the figure is the points it added to the 100-point composite (weight × sub-score).
- ARV discount +15.0/15.0
- Schools +8.3/10.0
- Cash flow +7.9/30.0
- Appreciation +7.7/10.0
- Livability +3.5/5.0
- Rent growth +2.5/5.0
- Condition / age +2.5/5.0
- 1% rule +2.0/10.0
- DSCR +2.0/10.0
$1,775,000
🖨 Deal sheet (PDF) 📄 Offer letter ✓ Due diligence
Listing remarks
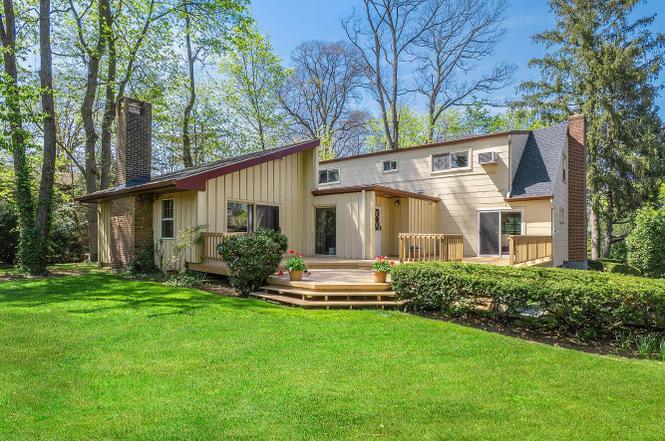
Private Contemporary Escape on Nearly Half an Acre. Tucked away on almost half an acre of flat, secluded land, this exceptional contemporary home offers the ultimate in privacy and space. With five bedrooms and two-and-a-half baths, it’s a home designed for comfort, flexibility, and today’s modern lifestyle. At the center of the home is a spectacular family room with vaulted ceilings, a fireplace, and triple exposure—flooded with natural light and seamlessly connected to an expansive deck for easy outdoor living. It’s a space where everyone naturally gathers. A formal dining room, elegant living room with a second fireplace, and a sunny breakfast room next to the new
Key facts
- Formal dining room
- Elegant living room
- Nearly half an acre
Tags
Property features AI
Exterior
- Parking: Driveway; 1-car garage
- Utilities: Cesspool septic; Electricity connected; Natural gas connected; Public trash collection; Water connected
- Home design: Single family residence; Two levels; Actual property condition
- Construction: Frame construction
- Exterior features: Back yard; Landscaped grounds; Near golf course; Private lot; Not waterfront; Deck; Other structures: Garage(s)
Interior
- Kitchen: Cooktop; Gas cooktop; Gas oven; Dishwasher; Refrigerator; Granite counters; Marble counters
- Bedrooms: First-floor bedroom
- Flooring: Hardwood floors; Carpet
- Bathrooms: 2 full baths; 1 half bath
- Heating & cooling: Baseboard heating; Ductless cooling; Wall/Window AC units
- Interior features: First-floor bedroom; First-floor full bath; Cathedral ceilings; Entrance foyer; Formal dining room; Granite counters; Marble counters; His and hers closets; Master bedroom on main level; Skylights; Deck
- Laundry & utility: Laundry room; Gas dryer hookup; Washer/dryer connections in basement; Full basement
Neighborhood map
What this means for you Summary
Snapshot
- This is a 5-bed/2.5-bath single-family listed at $1.77M.
Deal economics
- At list price, monthly cash flow is $-2k ($-23k/yr) — negative.
- To cash-flow at today's rent, offer at most $1.44M (18.9% below list).
- To meet the 1% rule (rent ≥ 1% of price), the offer needs to be $1.24M (30.2% below list).
- Recommended offer: $1.24M (30.2% below list) — sets the bar for 1% rule.
Location & tenants
- Location reads 70/100 on livability (#434 in NY) — a middle-class / working-renter tenant base. Strengths: crime A+, commute A+, employment A+; Watch: amenities F, cost of living F.
- Manhasset Union Free School District (suburban): math 86% / reading 84% proficiency, ranked #8 of 590 in NY (top 1%) — strong family-tenant draw, lease renewals of 3-5y typical; only 4% free/reduced lunch — higher-income household profile.
- Zoned schools: Shelter Rock Elementary School (math 85% / reading 82%, grade A+, #128 of 2,108 statewide, top 6%, 651 students, 0% FRL); Manhasset Middle School (math 84% / reading 79%, grade A+, #22 of 729 statewide, top 3%, 521 students, 6% FRL); Manhasset Secondary School (math 100% / reading 87%, grade A+, #141 of 1,100 statewide, top 13%, 962 students, 8% FRL) — zoned schools at 5% FRL track the district average.
- Market conditions: 119 active listings in the ZIP; 7 comparable units currently listed for rent nearby; rentals leasing fast (median 0d on market — plan ~1-2 weeks tenant-placement turnaround); 824 units permitted in Nassau County in 2024 (153 in 5+ unit buildings).
Forward outlook
- In year one you build about $108k of equity ($12k loan paydown + $96k appreciation (5.4% local appreciation)).
- Nassau County population projected at +7% by 2050 — modest demand growth; plan on rents tracking national, not racing it.
- By year 2, paydown + projected appreciation supports a ~$173k cash-out refi (75% LTV) — recoverable capital for the next deal without selling this one.
Negotiation context
- It's been on market 102 days — a 9% lower offer ($1.62M) is reasonable based on typical stale-listing flexibility.
- 7 sale attempts since 2y ago with the ask held roughly flat each time — persistent listings suggest the price (not the market) is what's stuck; bring a comps-based counter.
- Current owner paid $764k; list at $1.77M implies a 132% gain — meaningful room to come down on a strong offer.
Risks & watch-outs
- Watch-outs: built in 1959 — expect roof / HVAC / electrical / plumbing capex.
- Climate carrying-cost: major wind risk, 27% chance of damaging wind over 30y; extreme-heat days projected 7→16/yr by 2055 (HVAC capex compounding) — expect insurance premiums to compound above CPI over the hold.
Questions for the listing agent
- What do current leases actually rent for vs. the listed asking? Can we see a recent rent roll and the last 12 months of T-12 income?
- It's been on market 102 days. Have you received any prior offers? Is the seller open to a 30% concession, seller financing, or rate buy-down credit?
- Built in 1959 — when were the roof, HVAC, electrical panel, plumbing, and water heater last replaced?
- Why hasn't it sold? Are there any deal-killer items the seller is aware of (foundation, flood, title, zoning, code violations)?
- Is there a deadline driving the sale (1031 exchange, divorce, estate, relocation)? That informs how much negotiation room exists.
- What's the average days-on-market for RENTAL listings here right now (not sales)? A rising rental-DOM trend means longer vacancies and softer asking-rent achievability than the comps imply.
- What's the recent tenant-quality profile in this submarket — average credit score on applications, eviction rate, late-payment / NSF rate, and stable-employment percentage? A property-management company in the area should have these aggregated.
- How much new for-sale + rental construction is in the pipeline within 1–3 miles? Heavy new supply typically softens prices + rents 12–24 months out; constrained supply supports both.
Investment metrics
- 1% rule
- 0.70% ✗
- Cap rate
- 5.01%
- Cash-on-cash
- -4.59%
- DSCR
- 0.80
- GRM
- 11.9
CMA / ARV
- ARV (on-the-fly)
- $2,446,912
- Comps found
- 10
Show comp detail 10 sales within ~0.75 mi
| Address | Dist | Beds/Ba | Sqft | Sold | Price | $/sf | Match |
|---|---|---|---|---|---|---|---|
| 3 West Dr | 0.33mi | 4/4.0 (-1) | 2,802 (-5%) | 0mo | $2,750,000 | $981 | 66 |
| 36 South Dr | 0.35mi | 6/3.5 (+1) | 3,136 (+7%) | 10mo | $2,700,000 | $861 | 56 |
| 3 Beechtree Ln | 0.29mi | 4/3.5 (-1) | 3,012 (+2%) | 22mo | $2,505,000 | $832 | 55 |
| 60 Longridge Rd | 0.67mi | 4/2.5 (-1) | 3,050 (+4%) | 12mo | $3,200,000 | $1,049 | 48 |
| 74 South Dr | 0.29mi | 4/3.5 (-1) | 2,758 (-6%) | 23mo | $2,810,000 | $1,019 | 48 |
| 1254 Plandome Rd | 0.18mi | 5/3.5 | 2,534 (-14%) | 21mo | $1,530,000 | $604 | 47 |
| 4 Kimson Ct | 0.46mi | 6/3.5 (+1) | 3,377 (+15%) | 4mo | $2,450,511 | $726 | 42 |
| 134 Circle Dr | 0.47mi | 4/3.5 (-1) | 3,300 (+12%) | 12mo | $2,550,000 | $773 | 39 |
| 3 Terrace Ct | 0.71mi | 4/3.5 (-1) | 2,804 (-5%) | 15mo | $1,660,000 | $592 | 38 |
| 177 Bourndale Rd N | 0.62mi | 4/3.5 (-1) | 2,640 (-10%) | 12mo | $2,100,000 | $795 | 35 |
Match score weights: distance 35% · size 25% · config 20% · recency 20%. Top-matched comps best support the ARV.
Projected returns pro-forma
5.38% appreciation · 3.0% rent growth · sell at horizon
- IRR
- 10.0%
- Equity multiple
- 1.66×
- Total profit
- $326,816
- Equity at exit
- $1,047,216
- IRR
- 11.4%
- Equity multiple
- 3.16×
- Total profit
- $1,075,232
- Equity at exit
- $1,842,500
Cash invested: $497,000 (down + closing). Projections, not guarantees.
Landlord ↔ Tenant lean methodology
- Overall (STATE)
- 15 Strongly Tenant-Friendly
- State New York
- 15 Strongly Tenant-Friendly · D+10
- County
- — inherits STATE
- City
- — inherits STATE
ZIP-level market 11030
- Home prices YoY
- 1.9%
- Active inventory
- 119
- Price-to-rent
- 11.9×
Monthly cashflow live
- Estimated rent
- $12,384 high interval (Pro) →
- Mortgage (P&I)
- −$9,308
- Tax from tax record
- −$1,636 /mo · $19,626/yr
- Insurance
- −$740
- HOA
- −$0
- Vacancy / Maint / Mgmt
- −$2,601
- Net cashflow
- $-1,900
Break-even live
Sensitivity live
| Price | -10% $-895 | -5% $-1,397 | +0% $-1,900 | +5% $-2,402 | +10% $-2,904 |
|---|---|---|---|---|---|
| Rent | -10% $-2,878 | -5% $-2,389 | +0% $-1,900 | +5% $-1,410 | +10% $-921 |
| Rate | -1.0pp $-1,006 | -0.5pp $-1,448 | base $-1,900 | +0.5pp $-2,360 | +1.0pp $-2,828 |
UW: 25.0% down · 7.5% · 30yr · 1.5% tax · 5.0% vac · 8.0% maint · 8.0% mgmt
Financing live
Cash to close
- Down payment
- $443,750
- Closing costs
- $53,250
- Reserves months
- —
- Total cash needed
- —
Loan-product check · same deal, 3 products live
Conventional
25% down · 7.5% · 30yr
- Down + closing
- —
- Monthly P&I
- —
- Monthly cashflow
- —
- DSCR
- —
- Eligible?
- —
Personal DTI + credit; lowest rate.
DSCR
20% down · 8.5% · 30yr
- Down + closing
- —
- Monthly P&I
- —
- Monthly cashflow
- —
- DSCR
- —
- Eligible?
- —
No personal income docs; deal must DSCR.
Hard money
10% down · 12.0% · 12mo
- Down + closing
- —
- Monthly P&I
- —
- Monthly cashflow
- —
- DSCR
- —
- Eligible?
- —
Short-term bridge; refi at stabilization.
Rent comps 7 comps
| Address | Beds | Baths | Sqft | Rent | $/sqft | DOM | Units | Dist |
|---|---|---|---|---|---|---|---|---|
| 11 Plandome Dr Manhasset, NY | 6.0 | 5.5 | 3600 | $13,500 | $3.75 | 0d | 1 | 0.19mi |
| 27 Pine St Port Washington, NY | 4.0 | 4.5 | 3570 | $14,200 | $3.98 | 0d | 1 | 0.91mi |
| 90 Mackey Ave Port Washington, NY | 4.0 | 2.5 | 2580 | $7,500 | $2.91 | 3d | 1 | 1.01mi |
| 72 Highland Ter Manhasset, NY | 4.0 | 2.0 | 2216 | $6,400 | $2.89 | 45d | 1 | 1.05mi |
| 20 N Ravine Rd Great Neck, NY | 6.0 | 5.5 | 4000 | $12,500 | $3.12 | 0d | 1 | 1.08mi |
| 79 Reid Ave Port Washington, NY | 5.0 | 3.5 | 3092 | $15,000 | $4.85 | 12d | 1 | 1.11mi |
| 106 Thayer Rd Manhasset, NY | 5.0 | 3.0 | 2793 | $12,000 | $4.30 | 0d | 1 | 1.15mi |
Listing history 23 events
-
2026-04-25status Pending
-
2025-12-16$1,775,000 Active
-
2025-10-02status Pending
-
2025-10-02historical
-
2025-09-11$1,748,000 Active
-
2025-08-04historical
-
2025-05-30price $1,698,000
-
2025-05-02$1,788,000 Active
-
2025-04-24historical
-
2025-04-16historical
-
2025-03-07price $1,848,000
-
2025-01-31status Active
-
2024-09-19$1,898,000 Active
-
2024-09-17historical
-
2024-09-14historical
-
2024-05-22historical
-
2024-04-22price $1,798,000
-
2024-03-28price $1,988,000
-
2024-03-04price $2,078,000
-
2024-02-07$1,798,000 Active
-
2024-02-07$2,198,000 Active
-
1983-08-01soldstatus $763,630
-
1983-08-01soldstatus $210,000
ⓘ Source: listings_history table (triggers on properties + properties_extension) + one-shot
backfill from property_details.listing_events for pre-trigger history.
Tax reassessment forecast NY · Partial reset (capped growth)
- Current annual tax
- $19,626 · $1,636/mo
- Projected year-2 tax
- $24,812 · $2,068/mo
- Expected delta
- +$5,186/yr (+$432/mo · 26.4%)
ⓘ Screening estimate from a state-policy table — verify with the county assessor before closing.
Climate risk First Street
- Flood 1/10 Low FEMA zone X (unshaded) · 0% chance over 30 yrs
- Wildfire 1/10 Low
- Heat 6/10 Major 7 d/yr ≥98°F today · 16 d/yr by 30 yrs out
- Wind 6/10 Major 27% chance of damaging wind over 30 yrs
- Air quality 4/10 Moderate 6 unhealthy d/yr today · 7 by 30 yrs out
Nearby sold comps map
Loading sold comps map…
Walkable amenities ~0.75 mi
Loading nearby amenities…
Taxation est. · year 1
- Rental income
- $148,614
- − Mortgage interest
- −$99,428
- − Property taxes
- −$19,626
- − Insurance
- −$8,875
- − Repairs & maintenance
- −$11,889
- − Management
- −$11,889
- − Depreciation
- −$51,636
- Taxable loss
- −$54,730
- Est. tax savings @ 24.0%
- +$13,135
- After-tax cash flow
- $-9,661/yr
For passive investors: Depreciation is non-cash, so a rental often shows a tax loss while cash-flowing — sheltering income. Rental losses are passive: they offset passive income freely, and up to $25,000/yr can offset ordinary (W-2) income if you actively participate and your MAGI is under $100k (phasing out to $0 by $150k); unused losses carry forward. On sale, claimed depreciation is recaptured at up to 25%, and gains may owe capital-gains tax (a 1031 exchange can defer both). Figures are a year-1 estimate at your 24.0% rate — not tax advice; consult a CPA.
Schools (NCES district)
- District
- Manhasset Union Free School District
- NCES district ID
- 3618270
- Math proficiency
- 86% ▬ 0.00%
- Reading proficiency
- 84% ▲ 2.00%
- Median HH income
- $166,795
- Composite
- 82.99/100
- National rank
- #17
- State rank
- #8 of 590 in NY
Livability — Plandome Manor
- Score
- 70/100
- State rank
- #434
- US rank
- #7564
Category grades
Schools grade is shown separately in the Schools card above.
Census & demographics
- Census place
- Plandome Manor, NY
- Population (ZIP)
- 17,703
Population outlook (Nassau County) Hauer SSP2
- Today (2025)
- 1,409,302 people
- By 2030
- 1,431,482 · +1.6%
- By 2040
- 1,471,607 · +4.4%
- By 2050
- 1,502,845 · +6.6%
- By 2075
- 1,575,403 · +11.8%
- By 2100
- 1,554,356 · +10.3%
Race, ethnicity, and origin ACS 2023
- Neighborhood character
- Predominantly White (67%)
- Race & ethnicity
- White 67% Asian 20% Hispanic / Latino 8% Two or more races 7% Black 1%
- Hispanic origin (detail)
- Puerto Rican 2% Cuban 1%
- Common ancestry
- Romanian 5% Scotch-Irish 3% Italian 2%
- Foreign-born
- 18% · China, South Korea, Canada
- Languages at home
- 74% English-only · Chinese 9% Other Indo-European 8% Korean 3%
Political lean MEDSL · Nassau
- 2024 margin
- Toss-up / Even · D 47.9% · R 52.1%
- 2008→2024 swing
- -12.6pp toward R · 2008: 8.4pp · 2024: -4.2pp
- All cycles
- 2024: R+4.2 2020: D+9.5 2016: D+5.3 2012: D+6.7 2008: D+8.4
Not yet ingested
- Civics
- —
Market trends
- HPI YoY
- ▲ 5.38%
- Current HPI
- 288.8947
- Rent YoY
- —
- Metro
- —
- State GDP YoY
- ▲ 2.60%
- F500 in state
- 92
Industry mix (Fortune 500 HQ in NY)
| Industry | F500 HQs | Revenue |
|---|---|---|
| Financial Services | 10 | $950B |
|
||
| Consumer Goods | 9 | $162B |
|
||
| Insurance | 4 | $225B |
|
||
| Telecommunications | 2 | $144B |
|
||
| Pharmaceuticals | 2 | $112B |
|
||
| Media / Entertainment | 2 | $69B |
|
||
Price history
+132.4% since first listed23 events — show timeline
- 2026-04-25 Pending — OneKey® MLS as Distributed by MLS Grid
- 2025-12-16 Listed $1,775,000 OneKey® MLS as Distributed by MLS Grid
- 2025-10-02 Pending — OneKey® MLS as Distributed by MLS Grid
- 2025-10-02 Listing Removed — OneKey® MLS as Distributed by MLS Grid
- 2025-09-11 Listed $1,748,000 OneKey® MLS as Distributed by MLS Grid
- 2025-08-04 Listing Removed — OneKey® MLS as Distributed by MLS Grid
- 2025-05-30 Price Changed $1,698,000 OneKey® MLS as Distributed by MLS Grid
- 2025-05-02 Listed $1,788,000 OneKey® MLS as Distributed by MLS Grid
- 2025-04-24 Coming Soon — OneKey® MLS as Distributed by MLS Grid
- 2025-04-16 Listing Removed — OneKey® MLS as Distributed by MLS Grid
- 2025-03-07 Price Changed $1,848,000 OneKey® MLS as Distributed by MLS Grid
- 2025-01-31 Relisted — OneKey® MLS as Distributed by MLS Grid
- 2024-09-19 Listed $1,898,000 OneKey® MLS as Distributed by MLS Grid
- 2024-09-17 Coming Soon — OneKey® MLS as Distributed by MLS Grid
- 2024-09-14 Listing Removed — OneKey® MLS as Distributed by MLS Grid
- 2024-05-22 Listing Removed — OneKey® MLS as Distributed by MLS Grid
- 2024-04-22 Price Changed $1,798,000 OneKey® MLS as Distributed by MLS Grid
- 2024-03-28 Price Changed $1,988,000 OneKey® MLS as Distributed by MLS Grid
- 2024-03-04 Price Changed $2,078,000 OneKey® MLS as Distributed by MLS Grid
- 2024-02-07 Listed $2,198,000 OneKey® MLS as Distributed by MLS Grid
- 2024-02-07 Listed $1,798,000 OneKey® MLS as Distributed by MLS Grid
- 1983-08-01 Sold (Public Records) $210,000 Public Records
- 1983-08-01 Sold (Public Records) $763,630 Public Records
Property tax history
+1.1%/yrLatest (2024): $19,626 · +1.2% YoY. Source: county tax records.
Cash-flow waterfall
monthlySold comps — $/sqft
last 12 mo · ≤1 miLoading sold comps…