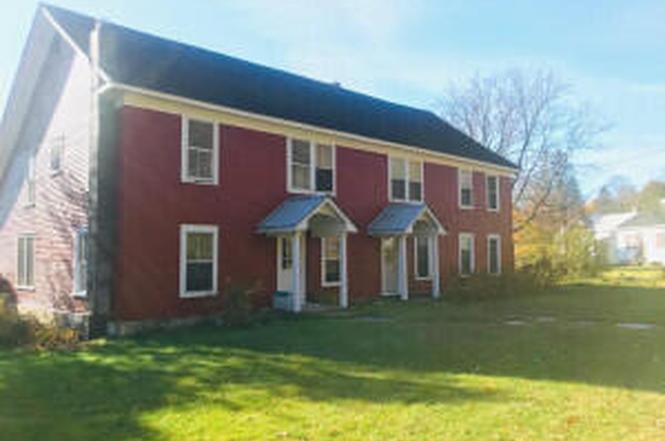
 Duplex
14 Golf Course Road Rd · Au Sable Forks, NY
Flood risk 6/10 · Moderate
- FEMA flood zone
- X (unshaded)
- Chance of flooding over 30 yrs
- 0.75%
- Est. flood insurance / yr
- $507 – $1,088
Fire risk 3/10 · Minor
- Est. fire insurance / yr
- $691 – $1,283
Heat risk 2/10 · Minimal
- Hot days now (above 93°F)
- 8 days/yr
- Hot days in 30 yrs
- 18 days/yr
Wind risk 1/10 · Minimal
- Chance of severe wind over 30 yrs
- 1.0%
Air-quality risk 2/10 · Minimal
- Unhealthy air days now
- 1 days/yr
- Unhealthy air days in 30 yrs
- 1 days/yr
Risk factors via First Street. Map © Google.
Why this score? — see what drove the B+ grade
The composite is a weighted blend of 9 inputs, each scored 0–100. Each bar is that input's sub-score; the figure is the points it added to the 100-point composite (weight × sub-score).
- Cash flow +30.0/30.0
- 1% rule +10.0/10.0
- DSCR +10.0/10.0
- Appreciation +8.5/10.0
- ARV discount +7.5/15.0
- Schools +3.7/10.0
- Livability +2.7/5.0
- Rent growth +2.5/5.0
- Condition / age +2.5/5.0
$119,000
🖨 Deal sheet (PDF) 📄 Offer letter ✓ Due diligence
Multi-family units
County records classify this as Multi-Family (2-4 Unit). Listing-text estimate: 2 units. confirmed
Listing remarks MLS
Great owner occupied or investment opportunity. Very well maintained duplex in Ausable Forks. Tenant has occupied right hand side for 25 years, rent currently set at $400 per month which is well below market value; month to month tenancy. Tenant is responsible for their own fuel and electric. Water/ sewer averages $275.00 a quarter. Owner has occupied left hand side and never rented out. Please refer to deed to reference lot size. Exterior was recently painted.
Key facts
- Attached garage
- Large backyard
- 0.64 acre lot
Tags
Property features AI
Exterior
- Parking: Seven parking spaces total; One covered/attached garage space; Six open driveway spaces; Attached driveway
- Utilities: Public water; Public sewer; Electricity connected; Electricity available; 100 Amp and 200+ Amp electric service
- Home design: Duplex residential income property; Two stories; One common wall; Has a view
- Construction: Frame construction with wood siding; Stone foundation; Asphalt roof; Built as a two-story structure
- Exterior features: Private yard; Exterior lighting; Covered front porch
Interior
- Kitchen: Dishwasher; Electric oven; Electric range; Refrigerator
- Bedrooms: Two main-level bedrooms
- Flooring: Carpet; Laminate; Wood
- Bathrooms: Eight main-level bathrooms
- Heating & cooling: Forced air heating; Hot water heating; Oil heating; Propane heating; No central cooling
- Interior features: Double-pane windows; Lighting; Private yard; Front covered porch
- Laundry & utility: Washer hookup on main level; Electric dryer hookup on main level; Basement apartment with unfinished and dirt floor
Neighborhood map
What this means for you Summary
Snapshot
- This is a 2 × 4-bed/1.0-bath units multifamily listed at $119k.
Deal economics
- At list price, monthly cash flow is $832 ($10k/yr) — positive. Per door: $416/mo.
- The deal already cash-flows at list — no discount required.
- Meets the 1% rule at list price ($2k rent vs $119k).
- Recommended offer: $105k (12.0% below list) — sets the bar for market timing.
- Cap rate 14.7% vs local median 1.4% in Au Sable Forks — top-decile yield for the area; either an underpriced asset or a hidden risk that comps aren't pricing in. Stress-test before assuming the spread holds.
Location & tenants
- Location reads 54/100 on livability (#1,143 in NY) — a working-class tenant base; expect higher turnover. Strengths: cost of living A+, housing B+; Watch: schools D-, crime F, amenities F.
- Ausable Valley Central School District (rural): math 36% / reading 51% proficiency, ranked #474 of 590 in NY (top 80%) — families likely to look elsewhere, expect single-tenant / working-renter base with shorter leases.
- Market conditions: 26 active listings in the ZIP; 192 units permitted in Clinton County in 2024 (64 in 5+ unit buildings).
Forward outlook
- In year one you build about $9k of equity ($823 loan paydown + $8k appreciation (6.9% local appreciation)).
- Clinton County population projected at -16% by 2050 — secular population decline; favor cash flow + early exit over multi-decade hold.
- At projected returns (6.9% appreciation + 3.0% rent growth), your $33k cash investment doubles in ~2 years — after that, you're playing with house money.
- By year 4, paydown + projected appreciation supports a ~$31k cash-out refi (75% LTV) — recoverable capital for the next deal without selling this one.
Negotiation context
- It's been on market 446 days — a 12% lower offer ($105k) is reasonable based on typical stale-listing flexibility.
- 3 sale attempts since 6y ago; this cycle's ask has dropped $71k (37%) from the opening price — seller is motivated, your offer sets the floor, not the list.
Risks & watch-outs
- Watch-outs: property tax is 3.0% of price; built in 1875 — expect roof / HVAC / electrical / plumbing capex.
- Climate carrying-cost: major flood risk — expect insurance premiums to compound above CPI over the hold.
Questions for the listing agent
- It's been on market 446 days. Have you received any prior offers? Is the seller open to a 12% concession, seller financing, or rate buy-down credit?
- Can we see the unit-by-unit rent roll, current vacancy, and any below-market leases? What's the average tenancy length?
- What capital expenditures (roof, boiler, parking lot, exteriors) have been made in the last 5 years, and what's planned in the next 2?
- Built in 1875 — when were the roof, HVAC, electrical panel, plumbing, and water heater last replaced?
- Property tax is high relative to price — has the assessment been appealed recently, and will the sale trigger a re-assessment?
- Why hasn't it sold? Are there any deal-killer items the seller is aware of (foundation, flood, title, zoning, code violations)?
- Is there a deadline driving the sale (1031 exchange, divorce, estate, relocation)? That informs how much negotiation room exists.
- Schools are D-rated, which usually means shorter tenancies and higher turnover. Who's the typical renter profile here, and what's been the actual vacancy rate?
- Crime grade is F in this area — have there been break-ins, vandalism, or insurance claims at this property in the last 3 years? What carrier currently insures it and at what premium?
- What's the average days-on-market for RENTAL listings here right now (not sales)? A rising rental-DOM trend means longer vacancies and softer asking-rent achievability than the comps imply.
- What's the recent tenant-quality profile in this submarket — average credit score on applications, eviction rate, late-payment / NSF rate, and stable-employment percentage? A property-management company in the area should have these aggregated.
- How much new apartment / multifamily construction is in the pipeline within 1–3 miles? Heavy new supply (>2% of stock underway) typically softens rents 12–24 months out; light construction supports rent growth.
Investment metrics
- 1% rule
- 1.92% ✓
- Cap rate
- 14.68%
- Cash-on-cash
- 29.97%
- DSCR
- 2.33
- GRM
- 4.4
CMA / ARV
No comps found within radius.
Projected returns pro-forma
6.92% appreciation · 3.0% rent growth · sell at horizon
- IRR
- 42.3%
- Equity multiple
- 3.82×
- Total profit
- $94,046
- Equity at exit
- $81,800
- IRR
- 38.7%
- Equity multiple
- 8.02×
- Total profit
- $234,028
- Equity at exit
- $154,784
Cash invested: $33,320 (down + closing). Projections, not guarantees.
Landlord ↔ Tenant lean methodology
- Overall (STATE)
- 15 Strongly Tenant-Friendly
- State New York
- 15 Strongly Tenant-Friendly · D+10
- County
- — inherits STATE
- City
- — inherits STATE
ZIP-level market 12912
- Home prices YoY
- 2.4%
- Active inventory
- 26
- Price-to-rent
- 8.7×
Monthly cashflow live
- Estimated rent
- $2,279 medium interval (Pro) →
- Mortgage (P&I)
- −$624
- Tax from tax record
- −$295 /mo · $3,537/yr
- Insurance
- −$50
- HOA
- −$0
- Vacancy / Maint / Mgmt
- −$479
- Net cashflow
- $832
Break-even live
Sensitivity live
| Price | -10% $899 | -5% $866 | +0% $832 | +5% $798 | +10% $765 |
|---|---|---|---|---|---|
| Rent | -10% $652 | -5% $742 | +0% $832 | +5% $922 | +10% $1,012 |
| Rate | -1.0pp $892 | -0.5pp $862 | base $832 | +0.5pp $801 | +1.0pp $770 |
2-unit breakdown (identical units grouped — click to expand)
| Units | Beds | Baths | Est. rent |
|---|---|---|---|
| 2× units | 4 | 1 | $2,280 |
| #1 | 4 | 1 | $1,140 |
| #2 | 4 | 1 | $1,140 |
| Total (2 units) | $2,279 | ||
UW: 25.0% down · 7.5% · 30yr · 1.5% tax · 5.0% vac · 8.0% maint · 8.0% mgmt
Financing live
Cash to close
- Down payment
- $29,750
- Closing costs
- $3,570
- Reserves months
- —
- Total cash needed
- —
Loan-product check · same deal, 3 products live
Conventional
25% down · 7.5% · 30yr
- Down + closing
- —
- Monthly P&I
- —
- Monthly cashflow
- —
- DSCR
- —
- Eligible?
- —
Personal DTI + credit; lowest rate.
DSCR
20% down · 8.5% · 30yr
- Down + closing
- —
- Monthly P&I
- —
- Monthly cashflow
- —
- DSCR
- —
- Eligible?
- —
No personal income docs; deal must DSCR.
Hard money
10% down · 12.0% · 12mo
- Down + closing
- —
- Monthly P&I
- —
- Monthly cashflow
- —
- DSCR
- —
- Eligible?
- —
Short-term bridge; refi at stabilization.
Listing history 26 events
-
2026-06-19days on market $119,000 Active 446 DOM
-
2026-06-18days on market $119,000 Active 445 DOM
-
2026-06-17days on market $119,000 Active 444 DOM
-
2026-06-16days on market $119,000 Active 443 DOM
-
2026-06-15days on market $119,000 Active 442 DOM
-
2026-06-14days on market $119,000 Active 440 DOM
-
2026-06-13days on market $119,000 Active 439 DOM
-
2026-06-10days on market $119,000 Active 437 DOM
-
2026-06-09days on market $119,000 Active 436 DOM
-
2026-06-08days on market $119,000 Active 435 DOM
-
2026-06-07days on market $119,000 Active 434 DOM
-
2026-06-05days on market $119,000 Active 431 DOM
-
2026-06-02days on market $119,000 Active 429 DOM
-
2026-06-01days on market $119,000 Active 428 DOM
-
2026-05-31days on market $119,000 Active 427 DOM
-
2026-05-30days on market $119,000 Active 426 DOM
-
2026-05-22price $119,000
-
2026-05-06price $139,000
-
2026-04-09price $149,000
-
2026-03-29status Active
-
2026-03-28historical
-
2025-10-16price $165,000
-
2025-05-31price $180,000
-
2025-03-27$190,000 Active
-
2021-05-13soldstatus $104,000 465-char remark
Show marketing remark (465 chars)
Great owner occupied or investment opportunity. Very well maintained duplex in Ausable Forks. Tenant has occupied right hand side for 25 years, rent currently set at $400 per month which is well below market value; month to month tenancy. Tenant is responsible for their own fuel and electric. Water/ sewer averages $275.00 a quarter. Owner has occupied left hand side and never rented out. Please refer to deed to reference lot size. Exterior was recently painted.
-
2020-03-02$119,000 465-char remark
Show marketing remark (465 chars)
Great owner occupied or investment opportunity. Very well maintained duplex in Ausable Forks. Tenant has occupied right hand side for 25 years, rent currently set at $400 per month which is well below market value; month to month tenancy. Tenant is responsible for their own fuel and electric. Water/ sewer averages $275.00 a quarter. Owner has occupied left hand side and never rented out. Please refer to deed to reference lot size. Exterior was recently painted.
ⓘ Source: listings_history table (triggers on properties + properties_extension) + one-shot
backfill from property_details.listing_events for pre-trigger history.
Tax reassessment forecast NY · Partial reset (capped growth)
- Current annual tax
- $3,537 · $295/mo
- Projected year-2 tax
- $3,537 · $295/mo
- Expected delta
- $0/yr ($0/mo · 0.0%)
ⓘ Screening estimate from a state-policy table — verify with the county assessor before closing.
Climate risk First Street
- Flood 6/10 Major FEMA zone X (unshaded) · 75% chance over 30 yrs
- Wildfire 3/10 Moderate
- Heat 2/10 Low 8 d/yr ≥93°F today · 18 d/yr by 30 yrs out
- Wind 1/10 Low 100% chance of damaging wind over 30 yrs
- Air quality 2/10 Low 1 unhealthy d/yr today · 1 by 30 yrs out
Nearby sold comps map
Loading sold comps map…
Walkable amenities ~0.75 mi
Loading nearby amenities…
Taxation est. · year 1
- Rental income
- $27,348
- − Mortgage interest
- −$6,666
- − Property taxes
- −$3,537
- − Insurance
- −$595
- − Repairs & maintenance
- −$2,188
- − Management
- −$2,188
- − Depreciation
- −$3,462
- Taxable income
- $8,713
- Est. tax owed @ 24.0%
- −$2,091
- After-tax cash flow
- $7,893/yr
For passive investors: Depreciation is non-cash, so a rental often shows a tax loss while cash-flowing — sheltering income. Rental losses are passive: they offset passive income freely, and up to $25,000/yr can offset ordinary (W-2) income if you actively participate and your MAGI is under $100k (phasing out to $0 by $150k); unused losses carry forward. On sale, claimed depreciation is recaptured at up to 25%, and gains may owe capital-gains tax (a 1031 exchange can defer both). Figures are a year-1 estimate at your 24.0% rate — not tax advice; consult a CPA.
Schools (NCES district)
- District
- Ausable Valley Central School District
- NCES district ID
- 3616170
- Math proficiency
- 36% ▼ -14.00%
- Reading proficiency
- 51% ▲ 5.00%
- Median HH income
- $50,989
- Composite
- 37.43/100
- National rank
- #4417
- State rank
- #474 of 590 in NY
Livability — Au Sable Forks
- Score
- 54/100
- State rank
- #1143
- US rank
- #23832
Category grades
Schools grade is shown separately in the Schools card above.
Census & demographics
- Census place
- Au Sable Forks, NY
- Population (ZIP)
- 1,860
Population outlook (Clinton County) Hauer SSP2
- Today (2025)
- 78,791 people
- By 2030
- 76,848 · -2.5%
- By 2040
- 71,579 · -9.2%
- By 2050
- 66,471 · -15.6%
- By 2075
- 57,361 · -27.2%
- By 2100
- 47,232 · -40.1%
Race, ethnicity, and origin ACS 2023
- Neighborhood character
- Predominantly White (96%)
- Race & ethnicity
- White 96% Two or more races 3% Hispanic / Latino 2%
- Common ancestry
- Lithuanian 13% Slovak 2% German 1%
- Foreign-born
- 1%
- Languages at home
- 99% English-only · Other Asian/Pacific 1%
Political lean MEDSL · Clinton
- 2024 margin
- Toss-up / Even · D 48.9% · R 51.1%
- 2008→2024 swing
- -25.1pp toward R · 2008: 22.9pp · 2024: -2.2pp
- All cycles
- 2024: R+2.2 2020: D+5.2 2016: D+0.9 2012: D+25.6 2008: D+22.9
Not yet ingested
- Civics
- —
Market trends
- HPI YoY
- ▲ 6.92%
- Current HPI
- 290.3767
- Rent YoY
- —
- Metro
- —
- State GDP YoY
- ▲ 2.60%
- F500 in state
- 92
Industry mix (Fortune 500 HQ in NY)
| Industry | F500 HQs | Revenue |
|---|---|---|
| Financial Services | 10 | $950B |
|
||
| Consumer Goods | 9 | $162B |
|
||
| Insurance | 4 | $225B |
|
||
| Telecommunications | 2 | $144B |
|
||
| Pharmaceuticals | 2 | $112B |
|
||
| Media / Entertainment | 2 | $69B |
|
||
Price history
+0.0% since first listed10 events — show timeline
- 2026-05-22 Price Changed $119,000 ACVMLS
- 2026-05-06 Price Changed $139,000 ACVMLS
- 2026-04-09 Price Changed $149,000 ACVMLS
- 2026-03-29 Relisted — ACVMLS
- 2026-03-28 Delisted — ACVMLS
- 2025-10-16 Price Changed $165,000 ACVMLS
- 2025-05-31 Price Changed $180,000 ACVMLS
- 2025-03-27 Listed $190,000 ACVMLS
- 2021-05-13 Sold (MLS) $104,000 ACVMLS
- 2020-03-02 Listed $119,000 ACVMLS
Property tax history
+11.1%/yrLatest (2025): $3,537 · +44.0% YoY. Source: county tax records.
Cash-flow waterfall
monthlySold comps — $/sqft
last 12 mo · ≤1 miLoading sold comps…