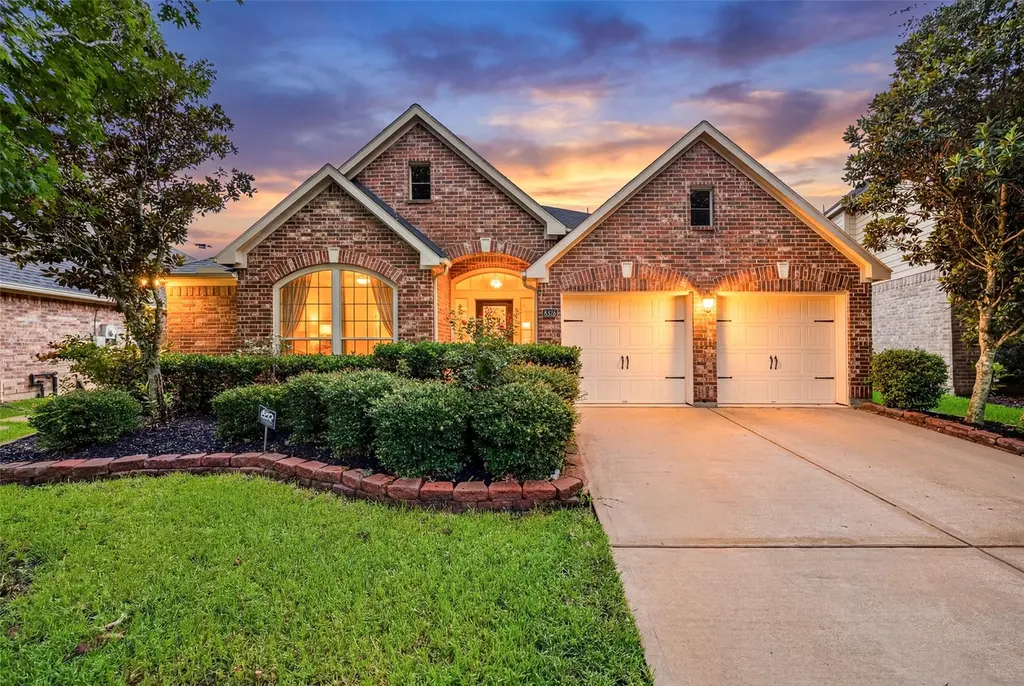
6326 Bear Creek Ct · Fulshear, TX
Flood risk 1/10 · Minimal
- FEMA flood zone
- X (unshaded)
- Chance of flooding over 30 yrs
- 0.0%
- Est. flood insurance / yr
- $507 – $1,088
Fire risk 4/10 · Minor
- Est. fire insurance / yr
- $1,222 – $2,270
Heat risk 9/10 · Severe
- Hot days now (above 110°F)
- 7 days/yr
- Hot days in 30 yrs
- 23 days/yr
Wind risk 9/10 · Severe
- Chance of severe wind over 30 yrs
- 99.0%
Air-quality risk 2/10 · Minimal
- Unhealthy air days now
- 1 days/yr
- Unhealthy air days in 30 yrs
- 1 days/yr
Risk factors via First Street. Map © Google.
Why this score? — see what drove the D- grade
The composite is a weighted blend of 9 inputs, each scored 0–100. Each bar is that input's sub-score; the figure is the points it added to the 100-point composite (weight × sub-score).
- ARV discount +9.9/15.0
- Cash flow +8.0/30.0
- Schools +5.7/10.0
- 1% rule +3.9/10.0
- Livability +3.5/5.0
- Condition / age +2.5/5.0
- Rent growth +2.1/5.0
- DSCR +2.0/10.0
- Appreciation +0.0/10.0
$479,000
🖨 Deal sheet (PDF) 📄 Offer letter ✓ Due diligence
Listing remarks MLS
Welcome to Your Dream Home at Cross Creek Ranch! This meticulously maintained Perry Homes 4-bedroom, 3-bathroom sits on a peaceful cul-de-sac lot, offering privacy with no back neighbors. This spacious backyard with its new Fence is fully plumbed for an outdoor kitchen, featuring a gas hookup, water connection, electricity, and drainage, making it the perfect space for entertaining. Inside, soaring 12-foot ceilings and recessed lighting illuminate the open living spaces featuring hardwood and tile floors. Cozy up by the fireplace in the inviting living room, or retreat to the media room for movie nights. The versatile study can serve as an office/guest quarters, while the mother-in-law suite provides added comfort. The gourmet kitchen boasts granite countertops, & custom tile baths enhance the luxurious feel. This home is designed to be handicap-friendly. Zoned to top-rated schools within a vibrant community offering waterparks, trails, fitness centers, this home is a must-see!
Key facts
- One story haven
- Formal dining room
- Quiet cul-de-sac
Tags
Property features AI
Finance
- HOA & community: Community association (CCMC) with annual fee of $1,500; Curbs in community
Exterior
- Parking: Attached 2-car garage
- Utilities: Public water; Public sewer
- Home design: Residential property; Single-story (entry and main living on first floor)
- Construction: Brick construction; Composition roof; Slab foundation; Built in 2010
- Exterior features: Fully fenced backyard; Back yard fencing; Sprinkler/irrigation system; Storage shed; Tennis court(s); Located on a cul-de-sac in a subdivision; Concrete road surface
Interior
- Kitchen: Dishwasher; Electric oven; Gas cooktop; Disposal; Microwave; Granite counters; Breakfast bar
- Bedrooms: Primary bedroom (first floor) — 18x15; Bedroom (first floor) — 13x11; Bedroom (first floor) — 13x10; Bedroom (first floor) — 13x10; Den (first floor) — 16x11; Office (first floor) — 13x10; Dining room (first floor) — 16x11; Living room (first floor) — 20x18
- Flooring: Tile; Wood
- Bathrooms: 3 full bathrooms; Double vanity; Soaking tub and separate shower
- Heating & cooling: Central heating (gas); Central air conditioning (electric)
- Interior features: Breakfast bar; Crown molding; Double vanity; Entrance foyer; Granite counters; High ceilings; Kitchen/open family room layout; Soaking tub; Separate shower; Wired for sound; Ceiling fans; Gas log fireplace
- Laundry & utility: Washer hookup; Electric dryer hookup; Gas dryer hookup
Neighborhood map
What this means for you Summary
Snapshot
- This is a 4-bed/3.0-bath single-family listed at $479k.
Deal economics
- At list price, monthly cash flow is $-493 ($-6k/yr) — negative.
- To cash-flow at today's rent, offer at most $392k (18.2% below list).
- To meet the 1% rule (rent ≥ 1% of price), the offer needs to be $426k (11.1% below list).
- Recommended offer: $392k (18.2% below list) — sets the bar for cash-flow.
- Cap rate 5.1% vs local median 3.2% in Fulshear — top-decile yield for the area; either an underpriced asset or a hidden risk that comps aren't pricing in. Stress-test before assuming the spread holds.
Location & tenants
- Location reads 69/100 on livability (#430 in TX) — a middle-class / working-renter tenant base. Strengths: crime A+, employment A+, housing A+; Watch: amenities F, commute F, cost of living F.
- Katy ISD (suburban): math 61% / reading 63% proficiency, ranked #29 of 826 in TX (top 4%) — acceptable for families but not a draw, mixed tenant base, ~2y average lease.
- Zoned schools: James E Randolph El (math 79% / reading 73%, grade A, #70 of 4,322 statewide, top 2%, 1,078 students, 8% FRL); Seven Lakes J H (math 84% / reading 80%, grade A+, #7 of 1,662 statewide, top 0%, 1,630 students, 20% FRL); Katy H S (math 62% / reading 74%, grade B, #150 of 1,632 statewide, top 10%, 3,330 students, 38% FRL).
- Zoned-school proficiency averages 75% at this address vs 62% district-wide (+13 pts) — the actual schools serving this property are materially stronger than the Katy ISD average implies; a family-tenant draw the district grade alone would hide.
- Market conditions: Rents soft (-1.6%/yr); 1242 active listings in the ZIP; 4 comparable units currently listed for rent nearby; rentals leasing fast (median 8d on market — plan ~1-2 weeks tenant-placement turnaround); high-income renter base; 12,093 units permitted in Fort Bend County in 2024 (815 in 5+ unit buildings).
Forward outlook
- Local home prices are declining (-3.0%/yr); year-one equity from $3k of loan paydown is wiped out by about $14k of value loss. Plan a longer hold.
- Fort Bend County population projected at +75% by 2050 — long-run rental-demand tailwind backs the buy-and-hold thesis.
Negotiation context
- Only 3 days on market — expect competitive offers; lowballing is unlikely to land.
- 7 sale attempts since 16y ago with the ask held roughly flat each time — persistent listings suggest the price (not the market) is what's stuck; bring a comps-based counter.
Risks & watch-outs
- Watch-outs: property tax is 2.6% of price.
- Climate carrying-cost: severe wind risk, 99% chance of damaging wind over 30y; extreme-heat days projected 7→23/yr by 2055 (HVAC capex compounding) — expect insurance premiums to compound above CPI over the hold.
Questions for the listing agent
- What do current leases actually rent for vs. the listed asking? Can we see a recent rent roll and the last 12 months of T-12 income?
- Property tax is high relative to price — has the assessment been appealed recently, and will the sale trigger a re-assessment?
- What does the HOA fee cover, when was the last increase, and are there any pending special assessments or reserve-fund shortfalls?
- Is there a deadline driving the sale (1031 exchange, divorce, estate, relocation)? That informs how much negotiation room exists.
- Schools are A-rated — typically a magnet for longer-tenancy family renters. What's the average tenant stay here, and is there a school-zone premium baked into asking?
- The area grade is low — what's the realistic commute time and amenity access for the typical tenant pool here? Any planned neighborhood developments (good or bad) we should know about?
- What's the average days-on-market for RENTAL listings here right now (not sales)? A rising rental-DOM trend means longer vacancies and softer asking-rent achievability than the comps imply.
- What's the recent tenant-quality profile in this submarket — average credit score on applications, eviction rate, late-payment / NSF rate, and stable-employment percentage? A property-management company in the area should have these aggregated.
- How much new for-sale + rental construction is in the pipeline within 1–3 miles? Heavy new supply typically softens prices + rents 12–24 months out; constrained supply supports both.
Investment metrics
- 1% rule
- 0.89% ✗
- Cap rate
- 5.06%
- Cash-on-cash
- -4.41%
- DSCR
- 0.80
- GRM
- 9.4
CMA / ARV
- ARV (on-the-fly)
- $506,450
- Comps found
- 12
Show comp detail 12 sales within ~0.75 mi
| Address | Dist | Beds/Ba | Sqft | Sold | Price | $/sf | Match |
|---|---|---|---|---|---|---|---|
| 27902 Brandy Creek Ln | 0.21mi | 4/3.0 | 2,892 (-0%) | 1mo | $565,000 | $195 | 90 |
| 27918 Silverstream Ct | 0.17mi | 5/3.5 (+1) | 2,899 (+0%) | 3mo | $399,900 | $138 | 82 |
| 27919 Brandy Creek Ln | 0.17mi | 4/3.0 | 3,038 (+5%) | 2mo | $497,000 | $164 | 82 |
| 27907 Brandy Creek Ln | 0.17mi | 4/3.0 | 3,038 (+5%) | 8mo | $496,000 | $163 | 77 |
| 28211 Rippling Brook Ln | 0.43mi | 4/2.5 | 2,882 (-0%) | 1mo | $590,000 | $205 | 77 |
| 28015 Silverstream Ct | 0.20mi | 5/3.5 (+1) | 2,882 (-0%) | 8mo | $457,750 | $159 | 76 |
| 27902 Silverstream Ct | 0.15mi | 4/2.0 | 2,623 (-9%) | 2mo | $459,000 | $175 | 72 |
| 27923 Silverstream Ct | 0.16mi | 4/2.0 | 2,545 (-12%) | 1mo | $440,000 | $173 | 68 |
| 5711 Amherst Farms Ln | 0.73mi | 4/3.0 | 2,871 (-1%) | 0mo | $550,000 | $192 | 64 |
| 28218 Ridgecreek Cove Ln | 0.41mi | 4/3.0 | 2,711 (-6%) | 8mo | $450,000 | $166 | 64 |
| 5910 Drake Shadow Ct | 0.54mi | 4/4.5 | 3,237 (+12%) | 1mo | $750,000 | $232 | 48 |
| 139 Lake View Loop | 0.73mi | 3/2.5 (-1) | 3,030 (+5%) | 8mo | $798,000 | $263 | 45 |
Match score weights: distance 35% · size 25% · config 20% · recency 20%. Top-matched comps best support the ARV.
Projected returns pro-forma
-3.0% appreciation · 0.0% rent growth · sell at horizon
- IRR
- -27.7%
- Equity multiple
- 0.10×
- Total profit
- $-121,118
- Equity at exit
- $71,420
- IRR
- -47.0%
- Equity multiple
- -0.44×
- Total profit
- $-192,541
- Equity at exit
- $41,415
Cash invested: $134,120 (down + closing). Projections, not guarantees.
Landlord ↔ Tenant lean methodology
- Overall (STATE)
- 87 Strongly Landlord-Friendly
- State Texas
- 87 Strongly Landlord-Friendly · R+5
- County
- — inherits STATE
- City
- — inherits STATE
ZIP-level market 77441
- Rents YoY
- -1.6%
- Active inventory
- 1242
- Price-to-rent
- 9.4×
Monthly cashflow live
- Estimated rent
- $4,260 medium interval (Pro) →
- Mortgage (P&I)
- −$2,512
- Tax from tax record
- −$1,022 /mo · $12,270/yr
- Insurance
- −$200
- HOA
- −$125
- Vacancy / Maint / Mgmt
- −$895
- Net cashflow
- $-493
Break-even live
Sensitivity live
| Price | -10% $-222 | -5% $-358 | +0% $-493 | +5% $-629 | +10% $-764 |
|---|---|---|---|---|---|
| Rent | -10% $-830 | -5% $-662 | +0% $-493 | +5% $-325 | +10% $-157 |
| Rate | -1.0pp $-252 | -0.5pp $-371 | base $-493 | +0.5pp $-617 | +1.0pp $-744 |
UW: 25.0% down · 7.5% · 30yr · 1.5% tax · 5.0% vac · 8.0% maint · 8.0% mgmt
Financing live
Cash to close
- Down payment
- $119,750
- Closing costs
- $14,370
- Reserves months
- —
- Total cash needed
- —
Loan-product check · same deal, 3 products live
Conventional
25% down · 7.5% · 30yr
- Down + closing
- —
- Monthly P&I
- —
- Monthly cashflow
- —
- DSCR
- —
- Eligible?
- —
Personal DTI + credit; lowest rate.
DSCR
20% down · 8.5% · 30yr
- Down + closing
- —
- Monthly P&I
- —
- Monthly cashflow
- —
- DSCR
- —
- Eligible?
- —
No personal income docs; deal must DSCR.
Hard money
10% down · 12.0% · 12mo
- Down + closing
- —
- Monthly P&I
- —
- Monthly cashflow
- —
- DSCR
- —
- Eligible?
- —
Short-term bridge; refi at stabilization.
Rent comps 4 comps
| Address | Beds | Baths | Sqft | Rent | $/sqft | DOM | Units | Dist |
|---|---|---|---|---|---|---|---|---|
| 6411 Tea Tree Dr Katy, TX | 4.0 | 2.5 | 2168 | $6,900 | $3.18 | 45d | 1 | 0.86mi |
| 6636 Argonne Dr Fulshear, TX | 1.0–4.0 | 1.0–3.0 | 1295 | $2,825 | $2.18 | 0d | 64 | 0.93mi |
| 6106 Carver Pines Dr Katy, TX | 4.0 | 2.0 | 2557 | $2,479 | $0.97 | 7d | 1 | 0.94mi |
| 4623 Cold Stream Ct Fulshear, TX | 3.0 | 3.0 | 2646 | $3,100 | $1.17 | 7d | 1 | 1.48mi |
HOA detail
- Monthly dues
- $125 · $1,500/yr
- Likely covers
- watergaselectricgym
Listing history 3 events
-
2026-06-21days on market $479,000 Active 3 DOM
-
2026-06-18remarks 693-char remark
-
2026-06-18$479,000 Active 1 DOM
ⓘ Source: listings_history table (triggers on properties + properties_extension) + one-shot
backfill from property_details.listing_events for pre-trigger history.
Tax reassessment forecast TX · Resets to sale price
- Current annual tax
- $12,270 · $1,022/mo
- Projected year-2 tax
- $12,270 · $1,022/mo
- Expected delta
- $0/yr ($0/mo · 0.0%)
ⓘ Screening estimate from a state-policy table — verify with the county assessor before closing.
Climate risk First Street
- Flood 1/10 Low FEMA zone X (unshaded) · 0% chance over 30 yrs
- Wildfire 4/10 Moderate
- Heat 9/10 Extreme 7 d/yr ≥110°F today · 23 d/yr by 30 yrs out
- Wind 9/10 Extreme 99% chance of damaging wind over 30 yrs
- Air quality 2/10 Low 1 unhealthy d/yr today · 1 by 30 yrs out
Nearby sold comps map
Loading sold comps map…
Walkable amenities ~0.75 mi
Loading nearby amenities…
Taxation est. · year 1
- Rental income
- $51,125
- − Mortgage interest
- −$26,831
- − Property taxes
- −$12,270
- − Insurance
- −$2,395
- − Repairs & maintenance
- −$4,090
- − Management
- −$4,090
- − HOA
- −$1,500
- − Depreciation
- −$13,935
- Taxable loss
- −$13,986
- Est. tax savings @ 24.0%
- +$3,357
- After-tax cash flow
- $-2,562/yr
For passive investors: Depreciation is non-cash, so a rental often shows a tax loss while cash-flowing — sheltering income. Rental losses are passive: they offset passive income freely, and up to $25,000/yr can offset ordinary (W-2) income if you actively participate and your MAGI is under $100k (phasing out to $0 by $150k); unused losses carry forward. On sale, claimed depreciation is recaptured at up to 25%, and gains may owe capital-gains tax (a 1031 exchange can defer both). Figures are a year-1 estimate at your 24.0% rate — not tax advice; consult a CPA.
Schools (NCES district)
- District
- Katy ISD
- NCES district ID
- 4825170
- Math proficiency
- 61% ▼ -7.00%
- Reading proficiency
- 63% ▼ -3.00%
- Median HH income
- $90,312
- Composite
- 56.59/100
- National rank
- #1146
- State rank
- #29 of 826 in TX
Livability — Fulshear
- Score
- 69/100
- State rank
- #430
- US rank
- #8901
Category grades
Schools grade is shown separately in the Schools card above.
Census & demographics
- Census place
- Fulshear, TX
- County
- Fort Bend County · 836,777 people
- City population
- 41,324
- Metro
- Houston-The Woodlands-Sugar Land, TX
- Population (ZIP)
- 41,324
- Household income
- $184,390
- Rent vs Own
- Severe rent burden
- 301.0
Population outlook (Fort Bend County) Hauer SSP2
- Today (2025)
- 1,004,526 people
- By 2030
- 1,153,104 · +14.8%
- By 2040
- 1,453,718 · +44.7%
- By 2050
- 1,753,781 · +74.6%
- By 2075
- 2,455,772 · +144.5%
- By 2100
- 2,930,528 · +191.7%
Race, ethnicity, and origin ACS 2023
- Neighborhood character
- Diverse neighborhood (Simpson 0.62)
- Race & ethnicity
- White 57% Hispanic / Latino 20% Two or more races 15% Asian 12% Black 6%
- Hispanic origin (detail)
- Mexican 10%
- Common ancestry
- Lithuanian 5% Romanian 2% Italian 1%
- Foreign-born
- 26% · Canada, China, Jamaica
- Languages at home
- 68% English-only · Spanish 17% German/W. Germanic 4% Chinese 4%
Political lean MEDSL · Fort Bend
- 2024 margin
- Toss-up / Even · D 49.5% · R 47.9% · Other 2.6%
- 2008→2024 swing
- +4.0pp toward D · 2008: -2.4pp · 2024: 1.6pp
- All cycles
- 2024: D+1.6 2020: D+10.6 2016: D+6.6 2012: R+6.8 2008: R+2.4
Not yet ingested
- Civics
- —
Market trends
- HPI YoY
- ▼ -154.74%
- Current HPI
- 275.8798
- Rent YoY
- ▼ -1.63%
- Metro
- Houston-The Woodlands-Sugar Land, TX
- State GDP YoY
- ▲ 3.95%
- F500 in state
- 110
Industry mix (Fortune 500 HQ in TX)
| Industry | F500 HQs | Revenue |
|---|---|---|
| Energy | 16 | $1,198B |
|
||
| Technology | 5 | $198B |
|
||
| Engineering / Construction | 4 | $72B |
|
||
| Energy Services | 3 | $60B |
|
||
| Utilities | 3 | $41B |
|
||
| Healthcare | 2 | $330B |
|
||
Price history
+76.2% since first listed21 events — show timeline
- 2026-06-18 Listed $479,000 HARMLS
- 2025-02-03 Rental Removed $2,980 HARMLS
- 2025-01-28 Price Changed $2,980 HARMLS
- 2025-01-17 Listed for Rent $3,100 HARMLS
- 2025-01-14 Sold (Public Records) — Public Records
- 2025-01-13 Sold (MLS) — HARMLS
- 2025-01-09 Pending — HARMLS
- 2025-01-03 Rental Removed $3,200 HARMLS
- 2025-01-03 Pending — HARMLS
- 2024-10-26 Relisted — HARMLS
- 2024-10-24 Pending — HARMLS
- 2024-09-27 Listed $490,000 HARMLS
- 2024-09-25 Listing Removed — HARMLS
- 2024-08-24 Price Changed $499,000 HARMLS
- 2024-08-03 Listed for Rent $3,200 HARMLS
- 2024-08-02 Listed $515,000 HARMLS
- 2024-07-23 Coming Soon — HARMLS
- 2023-07-12 Rental Removed — HARMLS
- 2010-11-18 Sold (MLS) — HARMLS
- 2010-11-03 Listing Removed — HARMLS
- 2010-11-03 Listed $271,900 HARMLS
Property tax history
+15.6%/yrLatest (2025): $12,270 · +10.2% YoY. Source: county tax records.
Cash-flow waterfall
monthlySold comps — $/sqft
last 12 mo · ≤1 miLoading sold comps…