 Duplex
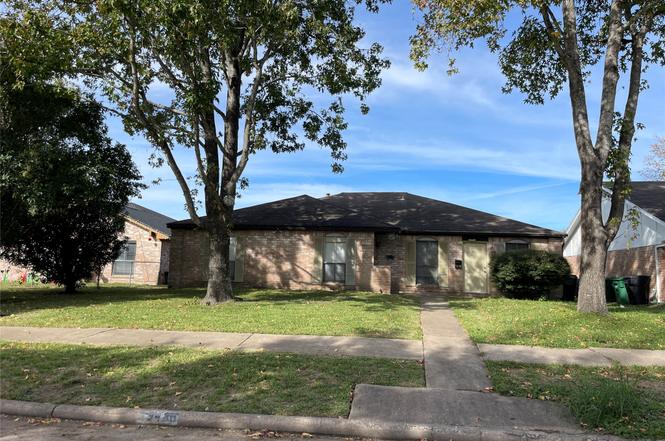
9436 Tooley Dr · Houston, TX
Flood risk 4/10 · Minor
- FEMA flood zone
- X (shaded)
- Chance of flooding over 30 yrs
- 0.22%
- Est. flood insurance / yr
- $507 – $1,088
Fire risk 1/10 · Minimal
- Est. fire insurance / yr
- $1,222 – $2,270
Heat risk 9/10 · Severe
- Hot days now (above 110°F)
- 7 days/yr
- Hot days in 30 yrs
- 21 days/yr
Wind risk 9/10 · Severe
- Chance of severe wind over 30 yrs
- 99.0%
Air-quality risk 2/10 · Minimal
- Unhealthy air days now
- 2 days/yr
- Unhealthy air days in 30 yrs
- 2 days/yr
Risk factors via First Street. Map © Google.
Why this score? — see what drove the D grade
The composite is a weighted blend of 9 inputs, each scored 0–100. Each bar is that input's sub-score; the figure is the points it added to the 100-point composite (weight × sub-score).
- Cash flow +11.5/30.0
- ARV discount +7.5/15.0
- Appreciation +5.2/10.0
- 1% rule +3.9/10.0
- Livability +3.7/5.0
- DSCR +3.4/10.0
- Schools +2.7/10.0
- Rent growth +2.5/5.0
- Condition / age +2.5/5.0
$249,900
🖨 Deal sheet (PDF) 📄 Offer letter ✓ Due diligence
Multi-family units
County records classify this as Multi-Family (2-4 Unit). Listing-text estimate: 2 units. confirmed
Listing remarks MLS
Great investment, Both units are occupied.
Key facts
- Brand new roof
- 7,800 sq ft lot
- Built 1971
Tags
Neighborhood map
What this means for you Summary
Snapshot
- This is a 1×3bd/2.0ba + 1×3bd/1.0ba units multifamily listed at $250k.
Deal economics
- At list price, monthly cash flow is $-82 ($-990/yr) — negative. Per door: $-41/mo.
- To cash-flow at today's rent, offer at most $235k (5.8% below list).
- To meet the 1% rule (rent ≥ 1% of price), the offer needs to be $223k (10.7% below list).
- Recommended offer: $223k (10.7% below list) — sets the bar for 1% rule.
- Cap rate 5.9% vs local median 3.2% in Houston — top-decile yield for the area; either an underpriced asset or a hidden risk that comps aren't pricing in. Stress-test before assuming the spread holds.
Location & tenants
- Location reads 74/100 on livability (#184 in TX, #4,771 nationally) — a middle-class / working-renter tenant base. Strengths: amenities A+, cost of living A+, housing A+; Watch: crime F.
- Houston ISD (urban): math 27% / reading 35% proficiency, ranked #593 of 826 in TX (top 72%) — families likely to look elsewhere, expect single-tenant / working-renter base with shorter leases; 71% free/reduced lunch — lower-income household profile, screen leases tightly.
- Zoned schools: Valley West El (math 27% / reading 37%, grade F, #2,268 of 4,322 statewide, top 55%, 653 students, 93% FRL); Welch Middle (math 11% / reading 21%, grade F, #1,543 of 1,662 statewide, top 94%, 645 students, 97% FRL); Sharpstown H S (math 7% / reading 23%, grade F, #1,507 of 1,632 statewide, top 93%, 1,855 students, 89% FRL) — zoned schools average 93% FRL vs 71% district-wide (22 pts higher); higher-poverty schools than district average — tighter screening recommended.
- Market conditions: 63 active listings in the ZIP; 3 comparable units currently listed for rent nearby; rentals leasing fast (median 9d on market — plan ~1-2 weeks tenant-placement turnaround); 29,883 units permitted in Harris County in 2024 (8,621 in 5+ unit buildings).
Forward outlook
- In year one you build about $3k of equity ($2k loan paydown + $943 appreciation (0.4% local appreciation)).
- Harris County population projected at +47% by 2050 — long-run rental-demand tailwind backs the buy-and-hold thesis.
- By year 10, paydown + projected appreciation supports a ~$32k cash-out refi (75% LTV) — recoverable capital for the next deal without selling this one.
Negotiation context
- It's been on market 51 days — a 3% lower offer ($242k) is reasonable based on typical stale-listing flexibility.
- 4 sale attempts since 19y ago with the ask held roughly flat each time — persistent listings suggest the price (not the market) is what's stuck; bring a comps-based counter.
Risks & watch-outs
- Climate carrying-cost: severe wind risk, 99% chance of damaging wind over 30y; extreme-heat days projected 7→21/yr by 2055 (HVAC capex compounding) — expect insurance premiums to compound above CPI over the hold.
Questions for the listing agent
- What do current leases actually rent for vs. the listed asking? Can we see a recent rent roll and the last 12 months of T-12 income?
- It's been on market 51 days. Have you received any prior offers? Is the seller open to a 11% concession, seller financing, or rate buy-down credit?
- Can we see the unit-by-unit rent roll, current vacancy, and any below-market leases? What's the average tenancy length?
- What capital expenditures (roof, boiler, parking lot, exteriors) have been made in the last 5 years, and what's planned in the next 2?
- Built in 1971 — when were the roof, HVAC, electrical panel, plumbing, and water heater last replaced?
- What does the HOA fee cover, when was the last increase, and are there any pending special assessments or reserve-fund shortfalls?
- Is there a deadline driving the sale (1031 exchange, divorce, estate, relocation)? That informs how much negotiation room exists.
- Schools are D-rated, which usually means shorter tenancies and higher turnover. Who's the typical renter profile here, and what's been the actual vacancy rate?
- Crime grade is F in this area — have there been break-ins, vandalism, or insurance claims at this property in the last 3 years? What carrier currently insures it and at what premium?
- The area grade is low — what's the realistic commute time and amenity access for the typical tenant pool here? Any planned neighborhood developments (good or bad) we should know about?
- What's the average days-on-market for RENTAL listings here right now (not sales)? A rising rental-DOM trend means longer vacancies and softer asking-rent achievability than the comps imply.
- What's the recent tenant-quality profile in this submarket — average credit score on applications, eviction rate, late-payment / NSF rate, and stable-employment percentage? A property-management company in the area should have these aggregated.
- How much new apartment / multifamily construction is in the pipeline within 1–3 miles? Heavy new supply (>2% of stock underway) typically softens rents 12–24 months out; light construction supports rent growth.
Investment metrics
- 1% rule
- 0.89% ✗
- Cap rate
- 5.90%
- Cash-on-cash
- -1.41%
- DSCR
- 0.94
- GRM
- 9.3
CMA / ARV
No comps found within radius.
Projected returns pro-forma
0.38% appreciation · 3.0% rent growth · sell at horizon
- IRR
- -2.4%
- Equity multiple
- 0.89×
- Total profit
- $-7,991
- Equity at exit
- $77,316
- IRR
- 3.1%
- Equity multiple
- 1.35×
- Total profit
- $24,624
- Equity at exit
- $96,820
Cash invested: $69,972 (down + closing). Projections, not guarantees.
Landlord ↔ Tenant lean methodology
- Overall (STATE)
- 87 Strongly Landlord-Friendly
- State Texas
- 87 Strongly Landlord-Friendly · R+5
- County
- — inherits STATE
- City
- — inherits STATE
ZIP-level market 77031
- Home prices YoY
- 0.2%
- Active inventory
- 63
- Price-to-rent
- 18.7×
Monthly cashflow live
- Estimated rent
- $2,232 high interval (Pro) →
- Mortgage (P&I)
- −$1,311
- Tax from tax record
- −$358 /mo · $4,298/yr
- Insurance
- −$104
- HOA
- −$73
- Vacancy / Maint / Mgmt
- −$469
- Net cashflow
- $-82
Break-even live
Sensitivity live
| Price | -10% $59 | -5% $-12 | +0% $-82 | +5% $-153 | +10% $-224 |
|---|---|---|---|---|---|
| Rent | -10% $-259 | -5% $-171 | +0% $-82 | +5% $6 | +10% $94 |
| Rate | -1.0pp $43 | -0.5pp $-19 | base $-82 | +0.5pp $-147 | +1.0pp $-213 |
2-unit breakdown (identical units grouped — click to expand)
| Units | Beds | Baths | Est. rent |
|---|---|---|---|
| 1× unit | 3 | 2 | $1,116 |
| 1× unit | 3 | 1 | $1,116 |
| Total (2 units) | $2,232 | ||
UW: 25.0% down · 7.5% · 30yr · 1.5% tax · 5.0% vac · 8.0% maint · 8.0% mgmt
Financing live
Cash to close
- Down payment
- $62,475
- Closing costs
- $7,497
- Reserves months
- —
- Total cash needed
- —
Loan-product check · same deal, 3 products live
Conventional
25% down · 7.5% · 30yr
- Down + closing
- —
- Monthly P&I
- —
- Monthly cashflow
- —
- DSCR
- —
- Eligible?
- —
Personal DTI + credit; lowest rate.
DSCR
20% down · 8.5% · 30yr
- Down + closing
- —
- Monthly P&I
- —
- Monthly cashflow
- —
- DSCR
- —
- Eligible?
- —
No personal income docs; deal must DSCR.
Hard money
10% down · 12.0% · 12mo
- Down + closing
- —
- Monthly P&I
- —
- Monthly cashflow
- —
- DSCR
- —
- Eligible?
- —
Short-term bridge; refi at stabilization.
Rent comps 3 comps
| Address | Beds | Baths | Sqft | Rent | $/sqft | DOM | Units | Dist |
|---|---|---|---|---|---|---|---|---|
| 9343 Starfire Ln Houston, TX | 4.0 | 2.0 | 2520 | $2,150 | $0.85 | 9d | 1 | 1.29mi |
| 8115 Braesview Ln Houston, TX | 4.0 | 2.0 | 2272 | $2,500 | $1.10 | 45d | 1 | 1.39mi |
| 8978 Dawnridge Dr Houston, TX | 4.0 | 3.0 | 2160 | $2,100 | $0.97 | 0d | 1 | 1.40mi |
HOA detail
- Monthly dues
- $73 · $876/yr
Listing history 11 events
-
2026-05-02status Pending
-
2026-04-21status Pending
-
2026-03-12$249,900 Active
-
2010-09-08soldstatus 42-char remark
Show marketing remark (42 chars)
Great investment, Both units are occupied.
-
2010-07-27historical 42-char remark
Show marketing remark (42 chars)
Great investment, Both units are occupied.
-
2010-02-04$118,900 42-char remark
Show marketing remark (42 chars)
Great investment, Both units are occupied.
-
2008-08-17historical
-
2008-02-11$135,200
-
2007-11-09historical
-
2007-05-20$129,900
-
1996-12-20soldstatus
ⓘ Source: listings_history table (triggers on properties + properties_extension) + one-shot
backfill from property_details.listing_events for pre-trigger history.
Tax reassessment forecast TX · Resets to sale price
- Current annual tax
- $4,298 · $358/mo
- Projected year-2 tax
- $4,573 · $381/mo
- Expected delta
- +$275/yr (+$23/mo · 6.4%)
ⓘ Screening estimate from a state-policy table — verify with the county assessor before closing.
Climate risk First Street
- Flood 4/10 Moderate FEMA zone X (shaded) · 22% chance over 30 yrs
- Wildfire 1/10 Low
- Heat 9/10 Extreme 7 d/yr ≥110°F today · 21 d/yr by 30 yrs out
- Wind 9/10 Extreme 99% chance of damaging wind over 30 yrs
- Air quality 2/10 Low 2 unhealthy d/yr today · 2 by 30 yrs out
Nearby sold comps map
Loading sold comps map…
Walkable amenities ~0.75 mi
Loading nearby amenities…
Taxation est. · year 1
- Rental income
- $26,784
- − Mortgage interest
- −$13,998
- − Property taxes
- −$4,298
- − Insurance
- −$1,250
- − Repairs & maintenance
- −$2,143
- − Management
- −$2,143
- − HOA
- −$876
- − Depreciation
- −$7,270
- Taxable loss
- −$5,193
- Est. tax savings @ 24.0%
- +$1,246
- After-tax cash flow
- $256/yr
For passive investors: Depreciation is non-cash, so a rental often shows a tax loss while cash-flowing — sheltering income. Rental losses are passive: they offset passive income freely, and up to $25,000/yr can offset ordinary (W-2) income if you actively participate and your MAGI is under $100k (phasing out to $0 by $150k); unused losses carry forward. On sale, claimed depreciation is recaptured at up to 25%, and gains may owe capital-gains tax (a 1031 exchange can defer both). Figures are a year-1 estimate at your 24.0% rate — not tax advice; consult a CPA.
Schools (NCES district)
- District
- Houston ISD
- NCES district ID
- 4823640
- Math proficiency
- 27% ▼ -18.00%
- Reading proficiency
- 35% ▼ -6.00%
- Median HH income
- $46,054
- Composite
- 26.63/100
- National rank
- #7173
- State rank
- #593 of 826 in TX
Livability — Houston
- Score
- 74/100
- State rank
- #184
- US rank
- #4771
Category grades
Schools grade is shown separately in the Schools card above.
Census & demographics
- Census place
- Houston, TX
- City population
- 3,226,434
- Population (ZIP)
- 15,740
Population outlook (Harris County) Hauer SSP2
- Today (2025)
- 5,571,493 people
- By 2030
- 6,089,821 · +9.3%
- By 2040
- 7,142,806 · +28.2%
- By 2050
- 8,185,864 · +46.9%
- By 2075
- 10,574,329 · +89.8%
- By 2100
- 12,109,958 · +117.4%
Race, ethnicity, and origin ACS 2023
- Neighborhood character
- Diverse neighborhood (Simpson 0.61)
- Race & ethnicity
- Hispanic / Latino 57% Two or more races 25% Black 20% White 14% Asian 7%
- Hispanic origin (detail)
- Mexican 27%
- Common ancestry
- Italian 1% Lithuanian 1%
- Foreign-born
- 42% · Canada, Jamaica, Vietnam
- Languages at home
- 42% English-only · Spanish 48% Vietnamese 2% Other Indo-European 2%
Political lean MEDSL · Harris
- 2024 margin
- Lean D (+5.5) · D 52.0% · R 46.4% · Other 1.6%
- 2008→2024 swing
- +3.9pp toward D · 2008: 1.6pp · 2024: 5.5pp
- All cycles
- 2024: D+5.5 2020: D+13.3 2016: D+12.4 2012: D+0.1 2008: D+1.6
Not yet ingested
- Civics
- —
Market trends
- HPI YoY
- ▲ 0.38%
- Current HPI
- 235.9144
- Rent YoY
- —
- Metro
- —
- State GDP YoY
- ▲ 3.95%
- F500 in state
- 110
Industry mix (Fortune 500 HQ in TX)
| Industry | F500 HQs | Revenue |
|---|---|---|
| Energy | 16 | $1,198B |
|
||
| Technology | 5 | $198B |
|
||
| Engineering / Construction | 4 | $72B |
|
||
| Energy Services | 3 | $60B |
|
||
| Utilities | 3 | $41B |
|
||
| Healthcare | 2 | $330B |
|
||
Price history
+92.4% since first listed11 events — show timeline
- 2026-05-02 Pending — HARMLS
- 2026-04-21 Pending — HARMLS
- 2026-03-12 Listed $249,900 HARMLS
- 2010-09-08 Sold (MLS) — HARMLS
- 2010-07-27 Listing Removed — HARMLS
- 2010-02-04 Listed $118,900 HARMLS
- 2008-08-17 Listing Removed — HARMLS
- 2008-02-11 Listed $135,200 HARMLS
- 2007-11-09 Listing Removed — HARMLS
- 2007-05-20 Listed $129,900 HARMLS
- 1996-12-20 Sold (Public Records) — Public Records
Property tax history
+3.3%/yrLatest (2025): $4,298 · +13.9% YoY. Source: county tax records.
Cash-flow waterfall
monthlySold comps — $/sqft
last 12 mo · ≤1 miLoading sold comps…