930 Campers Ln · Concord, VT
Flood risk 6/10 · Moderate
- FEMA flood zone
- X
- Chance of flooding over 30 yrs
- 0.74%
- Est. flood insurance / yr
- $507 – $1,088
Fire risk 3/10 · Minor
- Est. fire insurance / yr
- $480 – $892
Heat risk 1/10 · Minimal
- Hot days now (above 90°F)
- 8 days/yr
- Hot days in 30 yrs
- 18 days/yr
Wind risk 2/10 · Minimal
- Chance of severe wind over 30 yrs
- 2.0%
Air-quality risk 2/10 · Minimal
- Unhealthy air days now
- 1 days/yr
- Unhealthy air days in 30 yrs
- 1 days/yr
Risk factors via First Street. Map © Google.
Why this score? — see what drove the D grade
The composite is a weighted blend of 9 inputs, each scored 0–100. Each bar is that input's sub-score; the figure is the points it added to the 100-point composite (weight × sub-score).
- ARV discount +15.0/15.0
- Appreciation +8.1/10.0
- Schools +5.0/10.0
- Cash flow +4.4/30.0
- Livability +3.1/5.0
- Rent growth +2.5/5.0
- Condition / age +2.5/5.0
- 1% rule +0.4/10.0
- DSCR +0.0/10.0
$154,000
🖨 Deal sheet 📄 Offer letter ✓ Due diligence
Listing remarks
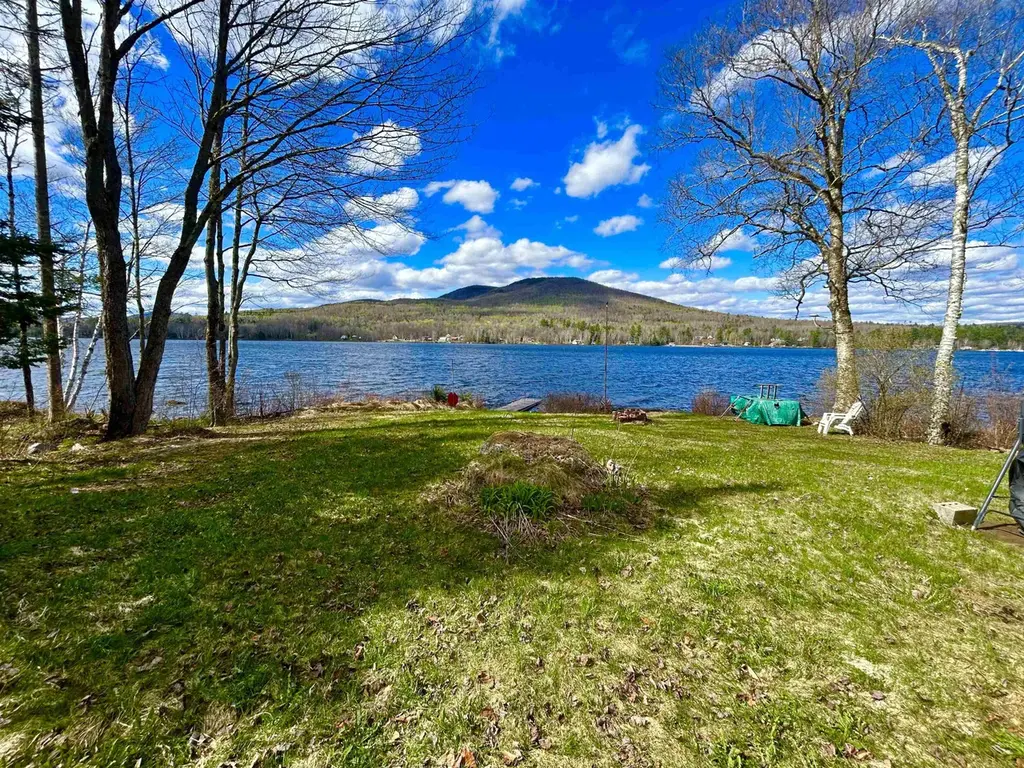
Escape to nature and claim your own slice of adventure on beautiful Miles Pond. This well-loved seasonal camp offers tranquility, privacy, and a front-row seat to the outdoors. With 100 feet of water frontage and nearby Fish & Wildlife access, Miles Pond is a dream setting for the nature enthusiast. Spend your days kayaking, paddling, water-skiing, fishing, birdwatching, or simply relaxing in the sun or under the stars. Nestled among the trees, the camp enjoys a majestic water view, unforgettable sunsets, and brilliant spring, summer, and fall colors. Despite its peaceful seclusion, you’re only 20–30 minutes from Kingdom Trails for world-class mountain biking and hiking, a
Key facts
- Water frontage
- Majestic water view
- 0.27 acre lot
Tags
Property features AI
Finance
- Other: Sale includes furnishings; Deed and survey available
Exterior
- Utilities: Electric on-site; Sewer: unknown; Water source: unknown; Water frontage length approximately 100 feet; Internet: unknown; No additional listed utilities
- Home design: Manufactured home (Mobile/Manuf); White exterior; Metal roof; Built in 1960; Single-story (all primary rooms on main level)
- Construction: Aluminum siding; Manufactured home construction
- Exterior features: Pond frontage with water view; Waterfront with shared waterfront rights; Directly adjoining water access to Miles Pond; Easements present; Dirt driveway
Interior
- Kitchen: Microwave; Refrigerator; Electric stove
- Bedrooms: Bedroom on main level
- Flooring: Carpet; Vinyl
- Bathrooms: One 3/4 bathroom
- Heating & cooling: Propane heat
- Interior features: Five total rooms; Seasonal use
Neighborhood map
What this means for you Summary
Snapshot
- This is a 1-bed/1.0-bath single-family listed at $154k.
Deal economics
- At list price, monthly cash flow is $-405 ($-5k/yr) — negative.
- To cash-flow at today's rent, offer at most $95k (38.0% below list).
- To meet the 1% rule (rent ≥ 1% of price), the offer needs to be $83k (45.8% below list).
- Recommended offer: $83k (45.8% below list) — sets the bar for 1% rule.
Location & tenants
- Location reads 61/100 on livability (#86 in VT) — a middle-class / working-renter tenant base. Strengths: cost of living A+, housing A+; Watch: employment C-, schools F, amenities F.
- Market conditions: 20 active listings in the ZIP; 11 units permitted in Essex County in 2024 (0 in 5+ unit buildings).
Forward outlook
- In year one you build about $11k of equity ($1k loan paydown + $10k appreciation (6.2% local appreciation)).
- Essex County population projected at -30% by 2050 — secular population decline; favor cash flow + early exit over multi-decade hold.
- By year 4, paydown + projected appreciation supports a ~$36k cash-out refi (75% LTV) — recoverable capital for the next deal without selling this one.
Negotiation context
- Only 5 days on market — expect competitive offers; lowballing is unlikely to land.
Risks & watch-outs
- Climate carrying-cost: major flood risk — expect insurance premiums to compound above CPI over the hold.
Questions for the listing agent
- What do current leases actually rent for vs. the listed asking? Can we see a recent rent roll and the last 12 months of T-12 income?
- Built in 1960 — when were the roof, HVAC, electrical panel, plumbing, and water heater last replaced?
- Is there a deadline driving the sale (1031 exchange, divorce, estate, relocation)? That informs how much negotiation room exists.
- Schools are F-rated, which usually means shorter tenancies and higher turnover. Who's the typical renter profile here, and what's been the actual vacancy rate?
- The area grade is low — what's the realistic commute time and amenity access for the typical tenant pool here? Any planned neighborhood developments (good or bad) we should know about?
- What's the average days-on-market for RENTAL listings here right now (not sales)? A rising rental-DOM trend means longer vacancies and softer asking-rent achievability than the comps imply.
- What's the recent tenant-quality profile in this submarket — average credit score on applications, eviction rate, late-payment / NSF rate, and stable-employment percentage? A property-management company in the area should have these aggregated.
- How much new for-sale + rental construction is in the pipeline within 1–3 miles? Heavy new supply typically softens prices + rents 12–24 months out; constrained supply supports both.
Investment metrics
- 1% rule
- 0.54% ✗
- Cap rate
- 3.14%
- Cash-on-cash
- -11.27%
- DSCR
- 0.50
- GRM
- 15.4
CMA / ARV
- ARV (median comp)
- $188,075
- List price
- $154,000
- Delta
- -18.12%
- Verdict
- UNDERPRICED
- Comps
- 3 within 1.0 mi
Show comp detail 1 sale within ~0.75 mi
| Address | Dist | Beds/Ba | Sqft | Sold | Price | $/sf | Match |
|---|---|---|---|---|---|---|---|
| 106 Nana's Ln | 0.50mi | 2/1.0 (+1) | 528 (+9%) | 11mo | $230,000 | $436 | 47 |
Match score weights: distance 35% · size 25% · config 20% · recency 20%. Top-matched comps best support the ARV.
Projected returns pro-forma
6.18% appreciation · 3.0% rent growth · sell at horizon
- IRR
- 6.8%
- Equity multiple
- 1.47×
- Total profit
- $20,325
- Equity at exit
- $98,547
- IRR
- 8.8%
- Equity multiple
- 2.85×
- Total profit
- $79,579
- Equity at exit
- $180,227
Cash invested: $43,120 (down + closing). Projections, not guarantees.
Landlord ↔ Tenant lean methodology
- Overall (STATE)
- 41 Moderately Tenant-Leaning
- State Vermont
- 41 Moderately Tenant-Leaning · D+15
- County
- — inherits STATE
- City
- — inherits STATE
ZIP-level market 05824
- Home prices YoY
- 3.7%
- Active inventory
- 20
- Price-to-rent
- 15.4×
Monthly cashflow live
- Estimated rent
- $835 medium interval (Pro) →
- Mortgage (P&I)
- −$808
- Tax est. 1.5%
- −$192 /mo · $2,310/yr
- Insurance
- −$64
- HOA
- −$0
- Vacancy / Maint / Mgmt
- −$175
- Net cashflow
- $-405
Break-even live
UW: 25.0% down · 7.5% · 30yr · 1.5% tax · 5.0% vac · 8.0% maint · 8.0% mgmt
Financing live
Cash to close
- Down payment
- $38,500
- Closing costs
- $4,620
- Reserves months
- —
- Total cash needed
- —
Loan-product check · same deal, 3 products live
Conventional
25% down · 7.5% · 30yr
- Down + closing
- —
- Monthly P&I
- —
- Monthly cashflow
- —
- DSCR
- —
- Eligible?
- —
Personal DTI + credit; lowest rate.
DSCR
20% down · 8.5% · 30yr
- Down + closing
- —
- Monthly P&I
- —
- Monthly cashflow
- —
- DSCR
- —
- Eligible?
- —
No personal income docs; deal must DSCR.
Hard money
10% down · 12.0% · 12mo
- Down + closing
- —
- Monthly P&I
- —
- Monthly cashflow
- —
- DSCR
- —
- Eligible?
- —
Short-term bridge; refi at stabilization.
Listing history 2 events
-
2026-05-16status Pending 966-char remark
-
2026-05-11$154,000 Active 966-char remark
ⓘ Source: listings_history table (triggers on properties + properties_extension) + one-shot
backfill from property_details.listing_events for pre-trigger history.
Climate risk First Street
- Flood 6/10 Major FEMA zone X · 74% chance over 30 yrs
- Wildfire 3/10 Moderate
- Heat 1/10 Low 8 d/yr ≥90°F today · 18 d/yr by 30 yrs out
- Wind 2/10 Low 2% chance of damaging wind over 30 yrs
- Air quality 2/10 Low 1 unhealthy d/yr today · 1 by 30 yrs out
Nearby sold comps map
Loading sold comps map…
Walkable amenities ~0.75 mi
Loading nearby amenities…
Taxation est. · year 1
- Rental income
- $10,017
- − Mortgage interest
- −$8,626
- − Property taxes
- −$2,310
- − Insurance
- −$770
- − Repairs & maintenance
- −$801
- − Management
- −$801
- − Depreciation
- −$4,480
- Taxable loss
- −$7,772
- Est. tax savings @ 24.0%
- +$1,865
- After-tax cash flow
- $-2,992/yr
For passive investors: Depreciation is non-cash, so a rental often shows a tax loss while cash-flowing — sheltering income. Rental losses are passive: they offset passive income freely, and up to $25,000/yr can offset ordinary (W-2) income if you actively participate and your MAGI is under $100k (phasing out to $0 by $150k); unused losses carry forward. On sale, claimed depreciation is recaptured at up to 25%, and gains may owe capital-gains tax (a 1031 exchange can defer both). Figures are a year-1 estimate at your 24.0% rate — not tax advice; consult a CPA.
Schools (NCES district)
No district data.
Livability — Concord
- Score
- 61/100
- State rank
- #86
- US rank
- #18119
Category grades
Schools grade is shown separately in the Schools card above.
Census & demographics
- Population (ZIP)
- 1,163
Population outlook (Essex County) Hauer SSP2
- Today (2025)
- 5,715 people
- By 2030
- 5,396 · -5.6%
- By 2040
- 4,680 · -18.1%
- By 2050
- 4,025 · -29.6%
- By 2075
- 3,104 · -45.7%
- By 2100
- 2,590 · -54.7%
Race, ethnicity, and origin ACS 2023
- Neighborhood character
- Predominantly White (91%)
- Race & ethnicity
- White 91% Two or more races 3% Native American 3% Hispanic / Latino 2%
- Common ancestry
- Lithuanian 10% Slovak 6% Serbian 3%
- Foreign-born
- 3% · Canada
- Languages at home
- 98% English-only · Spanish 1% Other Asian/Pacific 1%
Political lean MEDSL · Essex
- 2024 margin
- R (+16.0) · D 39.4% · R 55.4% · Other 5.2%
- 2008→2024 swing
- -30.5pp toward R · 2008: 14.5pp · 2024: -16.0pp
- All cycles
- 2024: R+16.0 2020: R+11.2 2016: R+18.0 2012: D+13.4 2008: D+14.5
Not yet ingested
- Civics
- —
Market trends
- HPI YoY
- ▲ 6.18%
- Current HPI
- 174.4178
- Rent YoY
- —
- Metro
- —
- State GDP YoY
- —
- F500 in state
- 0
Price history
2 events — show timeline
- 2026-05-16 Pending — PrimeMLS
- 2026-05-11 Listed $154,000 PrimeMLS
Cash-flow waterfall
monthlySold comps — $/sqft
last 12 mo · ≤1 miLoading sold comps…