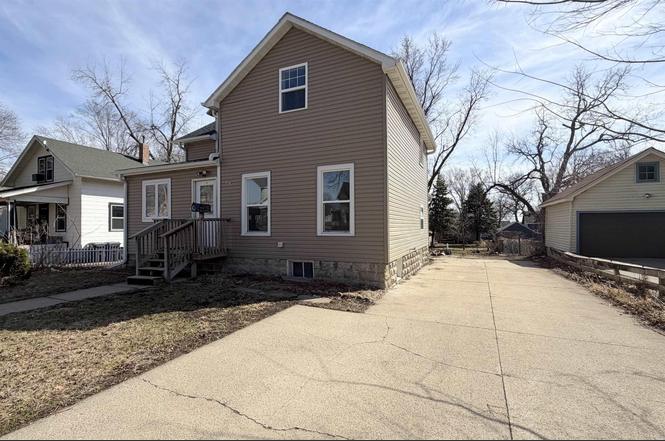
718 E 1st St · Storm Lake, IA
Flood risk 1/10 · Minimal
- FEMA flood zone
- X (unshaded)
- Chance of flooding over 30 yrs
- 0.0%
- Est. flood insurance / yr
- $473 – $860
Fire risk 1/10 · Minimal
- Est. fire insurance / yr
- $902 – $1,676
Heat risk 2/10 · Minimal
- Hot days now (above 99°F)
- 7 days/yr
- Hot days in 30 yrs
- 15 days/yr
Wind risk 2/10 · Minimal
- Chance of severe wind over 30 yrs
- —
Air-quality risk 1/10 · Minimal
- Unhealthy air days now
- 0 days/yr
- Unhealthy air days in 30 yrs
- 0 days/yr
Risk factors via First Street. Map © Google.
Why this score? — see what drove the C- grade
The composite is a weighted blend of 9 inputs, each scored 0–100. Each bar is that input's sub-score; the figure is the points it added to the 100-point composite (weight × sub-score).
- ARV discount +15.0/15.0
- Cash flow +14.8/30.0
- DSCR +4.5/10.0
- Schools +4.3/10.0
- 1% rule +4.1/10.0
- Livability +3.8/5.0
- Rent growth +2.5/5.0
- Condition / age +2.5/5.0
- Appreciation +0.0/10.0
$135,000
🖨 Deal sheet (PDF) 📄 Offer letter ✓ Due diligence
Listing remarks
3 bed 1.75 bath, with main floor laundry. 1.5 story home that has new carpeting (2026) in living room, owner has also had most of siding & windows done. Roof redone in 2020. Central air was refurbished in 2025. New gutters in 2023. Decent sized backyard with area for a firepit. There two apple trees and one peach tree! NEW Water Heater installed March 2026! Seller will give up to $5,000 for buyer's closing cost. Kitchen was replaced about 8yrs ago.
Key facts
- 8,700 sq ft lot
- Built 1900
- Listed 68 days
Neighborhood map
What this means for you Summary
Snapshot
- This is a 3-bed/1.0-bath single-family listed at $135k.
Deal economics
- At list price, monthly cash flow is $37 ($449/yr) — positive.
- The deal already cash-flows at list — no discount required.
- To meet the 1% rule (rent ≥ 1% of price), the offer needs to be $123k (8.7% below list).
- Recommended offer: $123k (8.7% below list) — sets the bar for 1% rule.
- Cap rate 6.6% vs local median 2.9% in Storm Lake — top-decile yield for the area; either an underpriced asset or a hidden risk that comps aren't pricing in. Stress-test before assuming the spread holds.
Location & tenants
- Location reads 76/100 on livability (#190 in IA, #3,480 nationally) — a middle-class / working-renter tenant base. Strengths: cost of living A+, housing A+, health & safety A+; Watch: amenities F, commute F, employment D-.
- Storm Lake Community School District (town): math 47% / reading 54% proficiency, ranked #280 of 289 in IA (top 97%) — acceptable for families but not a draw, mixed tenant base, ~2y average lease; 63% free/reduced lunch — lower-income household profile, screen leases tightly.
- Zoned schools: Storm Lake Elementary (math 48% / reading 45%, grade D-, #546 of 616 statewide, top 89%, 814 students, 76% FRL); Storm Lake Middle School (math 48% / reading 54%, grade C, #210 of 246 statewide, top 87%, 787 students, 69% FRL); Storm Lake High School (math 45% / reading 61%, grade C-, #296 of 336 statewide, top 88%, 793 students, 62% FRL).
- Market conditions: 85 active listings in the ZIP; 164 units permitted in Buena Vista County in 2024 (71 in 5+ unit buildings).
Forward outlook
- Local home prices are declining (-3.0%/yr); year-one equity from $933 of loan paydown is wiped out by about $4k of value loss. Plan a longer hold.
- Buena Vista County population projected at +12% by 2050 — modest demand growth; plan on rents tracking national, not racing it.
Negotiation context
- It's been on market 68 days — a 6% lower offer ($127k) is reasonable based on typical stale-listing flexibility.
- 2 sale attempts; this cycle's ask has dropped $14k (9%) from the opening price — seller is motivated, your offer sets the floor, not the list.
Risks & watch-outs
- Watch-outs: built in 1900 — expect roof / HVAC / electrical / plumbing capex.
Questions for the listing agent
- It's been on market 68 days. Have you received any prior offers? Is the seller open to a 9% concession, seller financing, or rate buy-down credit?
- Built in 1900 — when were the roof, HVAC, electrical panel, plumbing, and water heater last replaced?
- Why hasn't it sold? Are there any deal-killer items the seller is aware of (foundation, flood, title, zoning, code violations)?
- Is there a deadline driving the sale (1031 exchange, divorce, estate, relocation)? That informs how much negotiation room exists.
- What's the average days-on-market for RENTAL listings here right now (not sales)? A rising rental-DOM trend means longer vacancies and softer asking-rent achievability than the comps imply.
- What's the recent tenant-quality profile in this submarket — average credit score on applications, eviction rate, late-payment / NSF rate, and stable-employment percentage? A property-management company in the area should have these aggregated.
- How much new for-sale + rental construction is in the pipeline within 1–3 miles? Heavy new supply typically softens prices + rents 12–24 months out; constrained supply supports both.
Investment metrics
- 1% rule
- 0.91% ✗
- Cap rate
- 6.63%
- Cash-on-cash
- 1.19%
- DSCR
- 1.05
- GRM
- 9.1
CMA / ARV
- ARV (on-the-fly)
- $164,964
- Comps found
- 10
Show comp detail 10 sales within ~0.75 mi
| Address | Dist | Beds/Ba | Sqft | Sold | Price | $/sf | Match |
|---|---|---|---|---|---|---|---|
| 718 E 1st St | 0.00mi | 3/2.0 | 1,398 (0%) | 1mo | $135,000 | $97 | 95 |
| 1104 E 4th St | 0.40mi | 3/1.0 | 1,462 (+5%) | 11mo | $168,500 | $115 | 64 |
| 309 Michigan St | 0.56mi | 2/2.0 (-1) | 1,356 (-3%) | 4mo | $154,000 | $114 | 57 |
| 415 Hudson St | 0.32mi | 3/2.0 | 1,332 (-5%) | 21mo | $105,000 | $79 | 56 |
| 221 Superior St | 0.09mi | 3/2.0 | 1,238 (-11%) | 24mo | $165,000 | $133 | 53 |
| 725 Superior St | 0.63mi | 3/1.5 | 1,440 (+3%) | 16mo | $170,000 | $118 | 50 |
| 1305 Park St | 0.34mi | 3/2.0 | 1,250 (-11%) | 18mo | $153,000 | $122 | 47 |
| 616 Russell St | 0.54mi | 3/1.0 | 1,587 (+14%) | 17mo | $166,000 | $105 | 38 |
| 1311 E 7th St | 0.74mi | 3/1.5 | 1,212 (-13%) | 8mo | $182,000 | $150 | 35 |
| 317 Geneseo St | 0.61mi | 2/2.0 (-1) | 1,566 (+12%) | 22mo | $189,000 | $121 | 24 |
Match score weights: distance 35% · size 25% · config 20% · recency 20%. Top-matched comps best support the ARV.
Projected returns pro-forma
-3.0% appreciation · 3.0% rent growth · sell at horizon
- IRR
- -14.4%
- Equity multiple
- 0.48×
- Total profit
- $-19,471
- Equity at exit
- $20,129
- IRR
- -5.6%
- Equity multiple
- 0.63×
- Total profit
- $-13,801
- Equity at exit
- $11,672
Cash invested: $37,800 (down + closing). Projections, not guarantees.
Landlord ↔ Tenant lean methodology
- Overall (STATE)
- 83 Strongly Landlord-Friendly
- State Iowa
- 83 Strongly Landlord-Friendly · R+6
- County
- — inherits STATE
- City
- — inherits STATE
ZIP-level market 50588
- Home prices YoY
- -13.3%
- Active inventory
- 85
- Price-to-rent
- 9.1×
Monthly cashflow live
- Estimated rent
- $1,232 medium interval (Pro) →
- Mortgage (P&I)
- −$708
- Tax from tax record
- −$172 /mo · $2,060/yr
- Insurance
- −$56
- HOA
- −$0
- Vacancy / Maint / Mgmt
- −$259
- Net cashflow
- $37
Break-even live
Sensitivity live
| Price | -10% $114 | -5% $76 | +0% $37 | +5% $-1 | +10% $-39 |
|---|---|---|---|---|---|
| Rent | -10% $-60 | -5% $-11 | +0% $37 | +5% $86 | +10% $135 |
| Rate | -1.0pp $105 | -0.5pp $72 | base $37 | +0.5pp $2 | +1.0pp $-33 |
UW: 25.0% down · 7.5% · 30yr · 1.5% tax · 5.0% vac · 8.0% maint · 8.0% mgmt
Financing live
Cash to close
- Down payment
- $33,750
- Closing costs
- $4,050
- Reserves months
- —
- Total cash needed
- —
Loan-product check · same deal, 3 products live
Conventional
25% down · 7.5% · 30yr
- Down + closing
- —
- Monthly P&I
- —
- Monthly cashflow
- —
- DSCR
- —
- Eligible?
- —
Personal DTI + credit; lowest rate.
DSCR
20% down · 8.5% · 30yr
- Down + closing
- —
- Monthly P&I
- —
- Monthly cashflow
- —
- DSCR
- —
- Eligible?
- —
No personal income docs; deal must DSCR.
Hard money
10% down · 12.0% · 12mo
- Down + closing
- —
- Monthly P&I
- —
- Monthly cashflow
- —
- DSCR
- —
- Eligible?
- —
Short-term bridge; refi at stabilization.
Listing history 6 events
-
2026-03-30status Pending
-
2026-03-02price $135,000
-
2026-01-20$149,000 Active
-
2025-09-25price $150,000
-
2025-07-24price $164,000
-
2025-06-07$170,000 Active
ⓘ Source: listings_history table (triggers on properties + properties_extension) + one-shot
backfill from property_details.listing_events for pre-trigger history.
Tax reassessment forecast IA · Partial reset (capped growth)
- Current annual tax
- $2,060 · $172/mo
- Projected year-2 tax
- $2,090 · $174/mo
- Expected delta
- +$30/yr (+$2/mo · 1.4%)
ⓘ Screening estimate from a state-policy table — verify with the county assessor before closing.
Climate risk First Street
- Flood 1/10 Low FEMA zone X (unshaded) · 0% chance over 30 yrs
- Wildfire 1/10 Low
- Heat 2/10 Low 7 d/yr ≥99°F today · 15 d/yr by 30 yrs out
- Wind 2/10 Low
- Air quality 1/10 Low 0 unhealthy d/yr today · 0 by 30 yrs out
Nearby sold comps map
Loading sold comps map…
Walkable amenities ~0.75 mi
Loading nearby amenities…
Taxation est. · year 1
- Rental income
- $14,784
- − Mortgage interest
- −$7,562
- − Property taxes
- −$2,060
- − Insurance
- −$675
- − Repairs & maintenance
- −$1,183
- − Management
- −$1,183
- − Depreciation
- −$3,927
- Taxable loss
- −$1,805
- Est. tax savings @ 24.0%
- +$433
- After-tax cash flow
- $883/yr
For passive investors: Depreciation is non-cash, so a rental often shows a tax loss while cash-flowing — sheltering income. Rental losses are passive: they offset passive income freely, and up to $25,000/yr can offset ordinary (W-2) income if you actively participate and your MAGI is under $100k (phasing out to $0 by $150k); unused losses carry forward. On sale, claimed depreciation is recaptured at up to 25%, and gains may owe capital-gains tax (a 1031 exchange can defer both). Figures are a year-1 estimate at your 24.0% rate — not tax advice; consult a CPA.
Schools (NCES district)
- District
- Storm Lake Community School District
- NCES district ID
- 1927390
- Math proficiency
- 47% ▼ -9.00%
- Reading proficiency
- 54% ▲ 1.00%
- Median HH income
- $45,998
- Composite
- 42.79/100
- National rank
- #3145
- State rank
- #280 of 289 in IA
Livability — Storm Lake
- Score
- 76/100
- State rank
- #190
- US rank
- #3480
Category grades
Schools grade is shown separately in the Schools card above.
Census & demographics
- Census place
- Storm Lake, IA
- Population (ZIP)
- 13,346
Population outlook (Buena Vista County) Hauer SSP2
- Today (2025)
- 20,775 people
- By 2030
- 21,101 · +1.6%
- By 2040
- 21,955 · +5.7%
- By 2050
- 23,202 · +11.7%
- By 2075
- 27,159 · +30.7%
- By 2100
- 29,578 · +42.4%
Race, ethnicity, and origin ACS 2023
- Neighborhood character
- Diverse neighborhood (Simpson 0.67)
- Race & ethnicity
- White 42% Hispanic / Latino 37% Asian 13% Two or more races 11% Pacific Islander 3% Black 3%
- Hispanic origin (detail)
- Mexican 27% Cuban 3%
- Common ancestry
- Portuguese 2% Iranian 1% Slovak 1%
- Foreign-born
- 28% · Canada, Philippines, South Korea
- Languages at home
- 54% English-only · Spanish 31% Other Asian/Pacific 13%
Political lean MEDSL · Buena Vista
- 2024 margin
- Solid R (+33.3) · D 32.8% · R 66.0% · Other 1.2%
- 2008→2024 swing
- -31.5pp toward R · 2008: -1.8pp · 2024: -33.3pp
- All cycles
- 2024: R+33.3 2020: R+25.6 2016: R+25.0 2012: R+10.4 2008: R+1.8
Not yet ingested
- Civics
- —
Market trends
- HPI YoY
- ▼ -38.05%
- Current HPI
- 248.8806
- Rent YoY
- —
- Metro
- —
- State GDP YoY
- ▲ 2.48%
- F500 in state
- 4
Industry mix (Fortune 500 HQ in IA)
| Industry | F500 HQs | Revenue |
|---|---|---|
| Financial Services | 1 | $16B |
|
||
| Retail / Convenience | 1 | $15B |
|
||
Price history
-20.6% since first listed6 events — show timeline
- 2026-03-30 Pending — NWIA
- 2026-03-02 Price Changed $135,000 NWIA
- 2026-01-20 Listed $149,000 NWIA
- 2025-09-25 Price Changed $150,000 NWIA
- 2025-07-24 Price Changed $164,000 NWIA
- 2025-06-07 Listed $170,000 NWIA
Property tax history
+7.4%/yrLatest (2025): $2,060 · +9.2% YoY. Source: county tax records.
Cash-flow waterfall
monthlySold comps — $/sqft
last 12 mo · ≤1 miLoading sold comps…