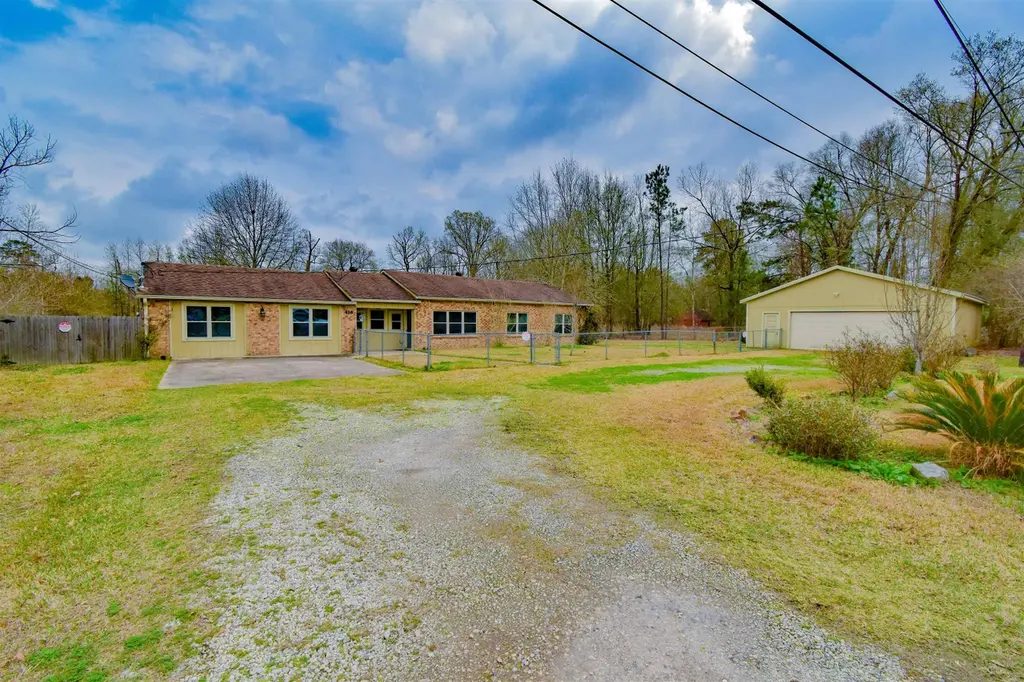
416 Craft Ln · Orange, TX
Flood risk 8/10 · Major
- FEMA flood zone
- A
- Chance of flooding over 30 yrs
- 0.99%
- Est. flood insurance / yr
- $1,009 – $1,996
Fire risk 6/10 · Moderate
- Est. fire insurance / yr
- $1,222 – $2,270
Heat risk 9/10 · Severe
- Hot days now (above 108°F)
- 7 days/yr
- Hot days in 30 yrs
- 24 days/yr
Wind risk 9/10 · Severe
- Chance of severe wind over 30 yrs
- 99.0%
Air-quality risk 2/10 · Minimal
- Unhealthy air days now
- 1 days/yr
- Unhealthy air days in 30 yrs
- 1 days/yr
Risk factors via First Street. Map © Google.
Why this score? — see what drove the D grade
The composite is a weighted blend of 9 inputs, each scored 0–100. Each bar is that input's sub-score; the figure is the points it added to the 100-point composite (weight × sub-score).
- ARV discount +15.0/15.0
- Cash flow +6.2/30.0
- Appreciation +5.5/10.0
- Schools +4.1/10.0
- Rent growth +3.9/5.0
- Livability +3.6/5.0
- Condition / age +2.5/5.0
- 1% rule +1.8/10.0
- DSCR +0.5/10.0
$240,000
🖨 Deal sheet 📄 Offer letter ✓ Due diligence
Listing remarks MLS
Opportunity awaits in Orange-field! This 2,254 sq ft home sits on a spacious . 88 acre lot and offers incredible potential for the right buyer. It features a big primary bedroom and a great sized backyard. While the home does need TLC, the space, layout, and large lot make it a great investment or renovation project. Schedule your showing today!
Key facts
- Spacious lot
- Great sized backyard
- 2 garage spots
Tags
Neighborhood map
What this means for you Summary
Snapshot
- This is a 4-bed/3.0-bath single-family listed at $240k.
Deal economics
- At list price, monthly cash flow is $-567 ($-7k/yr) — negative.
- To cash-flow at today's rent, offer at most $140k (41.7% below list).
- To meet the 1% rule (rent ≥ 1% of price), the offer needs to be $164k (31.8% below list).
- Recommended offer: $140k (41.7% below list) — sets the bar for cash-flow.
Location & tenants
- Location reads 71/100 on livability (#286 in TX) — a middle-class / working-renter tenant base. Strengths: cost of living A+, housing A+, health & safety A+; Watch: crime D+, employment D+, schools D-.
- Orangefield ISD (rural): math 44% / reading 48% proficiency, ranked #217 of 826 in TX (top 26%) — families likely to look elsewhere, expect single-tenant / working-renter base with shorter leases.
- Market conditions: Rents rising fast (+5.7%/yr); 337 active listings in the ZIP; 235 units permitted in Orange County in 2024 (50 in 5+ unit buildings).
- This rent runs 31% of the median local income ($64k/yr) — at the standard rent-burdened threshold; future hikes will face affordability resistance.
Forward outlook
- In year one you build about $4k of equity ($2k loan paydown + $2k appreciation (1.0% local appreciation)).
- Orange County population projected at +6% by 2050 — modest demand growth; plan on rents tracking national, not racing it.
- By year 8, paydown + projected appreciation supports a ~$33k cash-out refi (75% LTV) — recoverable capital for the next deal without selling this one.
Negotiation context
- It's been on market 87 days — a 6% lower offer ($226k) is reasonable based on typical stale-listing flexibility.
- 3 sale attempts since 9y ago; this cycle's ask has dropped $40k (14%) from the opening price — seller is motivated, your offer sets the floor, not the list.
Risks & watch-outs
- Watch-outs: flood insurance adds $125/mo.
- Climate carrying-cost: in FEMA flood zone A (mandatory federal flood insurance); severe wind risk, 99% chance of damaging wind over 30y; major wildfire risk; extreme-heat days projected 7→24/yr by 2055 (HVAC capex compounding) — expect insurance premiums to compound above CPI over the hold.
Questions for the listing agent
- What do current leases actually rent for vs. the listed asking? Can we see a recent rent roll and the last 12 months of T-12 income?
- It's been on market 87 days. Have you received any prior offers? Is the seller open to a 42% concession, seller financing, or rate buy-down credit?
- Built in 1966 — when were the roof, HVAC, electrical panel, plumbing, and water heater last replaced?
- What's the actual annual flood-insurance premium (NFIP or private), and is the property in a SFHA with mandatory coverage?
- Why hasn't it sold? Are there any deal-killer items the seller is aware of (foundation, flood, title, zoning, code violations)?
- Is there a deadline driving the sale (1031 exchange, divorce, estate, relocation)? That informs how much negotiation room exists.
- Schools are D-rated, which usually means shorter tenancies and higher turnover. Who's the typical renter profile here, and what's been the actual vacancy rate?
- Crime grade is D in this area — have there been break-ins, vandalism, or insurance claims at this property in the last 3 years? What carrier currently insures it and at what premium?
- The area grade is low — what's the realistic commute time and amenity access for the typical tenant pool here? Any planned neighborhood developments (good or bad) we should know about?
- What's the average days-on-market for RENTAL listings here right now (not sales)? A rising rental-DOM trend means longer vacancies and softer asking-rent achievability than the comps imply.
- What's the recent tenant-quality profile in this submarket — average credit score on applications, eviction rate, late-payment / NSF rate, and stable-employment percentage? A property-management company in the area should have these aggregated.
- How much new for-sale + rental construction is in the pipeline within 1–3 miles? Heavy new supply typically softens prices + rents 12–24 months out; constrained supply supports both.
Investment metrics
- 1% rule
- 0.68% ✗
- Cap rate
- 4.08%
- Cash-on-cash
- -7.89%
- DSCR
- 0.65
- GRM
- 12.2
CMA / ARV
- ARV (median comp)
- $289,532
- List price
- $240,000
- Delta
- -17.11%
- Verdict
- UNDERPRICED
- Comps
- 6 within 1.0 mi
Show comp detail 3 sales within ~0.75 mi
| Address | Dist | Beds/Ba | Sqft | Sold | Price | $/sf | Match |
|---|---|---|---|---|---|---|---|
| 8718 S Dana | 0.57mi | 3/2.5 (-1) | 2,272 (+1%) | 8mo | $289,900 | $128 | 59 |
| 1464 N Lewis Dr | 0.59mi | 3/2.0 (-1) | 2,100 (-7%) | 5mo | $219,900 | $105 | 48 |
| 8890 Interstate 10 W | 0.66mi | 3/2.0 (-1) | 2,328 (+3%) | 12mo | $299,900 | $129 | 45 |
Match score weights: distance 35% · size 25% · config 20% · recency 20%. Top-matched comps best support the ARV.
Projected returns pro-forma
1.01% appreciation · 5.71% rent growth · sell at horizon
- IRR
- -7.8%
- Equity multiple
- 0.60×
- Total profit
- $-26,764
- Equity at exit
- $82,056
- IRR
- -0.5%
- Equity multiple
- 0.94×
- Total profit
- $-4,088
- Equity at exit
- $109,141
Cash invested: $67,200 (down + closing). Projections, not guarantees.
Landlord ↔ Tenant lean methodology
- Overall (STATE)
- 87 Strongly Landlord-Friendly
- State Texas
- 87 Strongly Landlord-Friendly · R+5
- County
- — inherits STATE
- City
- — inherits STATE
ZIP-level market 77630
- Home prices YoY
- 0.4%
- Rents YoY
- 5.7%
- Active inventory
- 337
- Price-to-rent
- 12.2×
Monthly cashflow live
- Estimated rent
- $1,637 medium interval (Pro) →
- Mortgage (P&I)
- −$1,259
- Tax from tax record
- −$376 /mo · $4,516/yr
- Insurance
- −$100
- Flood insurance flood zone
- −$125 /mo · $1,502/yr
- HOA
- −$0
- Vacancy / Maint / Mgmt
- −$344
- Net cashflow
- $-567
Break-even live
UW: 25.0% down · 7.5% · 30yr · 1.5% tax · 5.0% vac · 8.0% maint · 8.0% mgmt
Financing live
Cash to close
- Down payment
- $60,000
- Closing costs
- $7,200
- Reserves months
- —
- Total cash needed
- —
Loan-product check · same deal, 3 products live
Conventional
25% down · 7.5% · 30yr
- Down + closing
- —
- Monthly P&I
- —
- Monthly cashflow
- —
- DSCR
- —
- Eligible?
- —
Personal DTI + credit; lowest rate.
DSCR
20% down · 8.5% · 30yr
- Down + closing
- —
- Monthly P&I
- —
- Monthly cashflow
- —
- DSCR
- —
- Eligible?
- —
No personal income docs; deal must DSCR.
Hard money
10% down · 12.0% · 12mo
- Down + closing
- —
- Monthly P&I
- —
- Monthly cashflow
- —
- DSCR
- —
- Eligible?
- —
Short-term bridge; refi at stabilization.
Listing history 14 events
-
2026-06-03days on market $240,000 Active 87 DOM
-
2026-06-02days on market $240,000 Active 86 DOM
-
2026-06-01days on market $240,000 Active 85 DOM
-
2026-05-31days on market $240,000 Active 84 DOM
-
2026-05-30days on market $240,000 Active 83 DOM
-
2026-04-13price $240,000 347-char remark
Show marketing remark (347 chars)
Opportunity awaits in Orange-field! This 2,254 sq ft home sits on a spacious . 88 acre lot and offers incredible potential for the right buyer. It features a big primary bedroom and a great sized backyard. While the home does need TLC, the space, layout, and large lot make it a great investment or renovation project. Schedule your showing today!
-
2026-03-09$280,000 Active 347-char remark
Show marketing remark (347 chars)
Opportunity awaits in Orange-field! This 2,254 sq ft home sits on a spacious . 88 acre lot and offers incredible potential for the right buyer. It features a big primary bedroom and a great sized backyard. While the home does need TLC, the space, layout, and large lot make it a great investment or renovation project. Schedule your showing today!
-
2019-06-14soldstatus
-
2019-06-13soldstatus 587-char remark
Show marketing remark (587 chars)
Nestled on Orangefield's desirable neighborhood on Craft Lane this home has so much to offer. The kitchen has granite countertops, island work space, built in microwave, glassed tile backsplash & patio access. This home features 4 bedrooms 2 full bathrooms with an office. The master bedroom is large in size with a large walk in closet. The back yard patio was just put in, the sunroom is perfect for that morning coffee. The property has a 30 X 30 shop. This home has so much natural light. This home has been totally renovated from top to bottom!!! Make your appointment today.
-
2019-05-09$255,000 587-char remark
Show marketing remark (587 chars)
Nestled on Orangefield's desirable neighborhood on Craft Lane this home has so much to offer. The kitchen has granite countertops, island work space, built in microwave, glassed tile backsplash & patio access. This home features 4 bedrooms 2 full bathrooms with an office. The master bedroom is large in size with a large walk in closet. The back yard patio was just put in, the sunroom is perfect for that morning coffee. The property has a 30 X 30 shop. This home has so much natural light. This home has been totally renovated from top to bottom!!! Make your appointment today.
-
2018-02-02soldstatus
-
2018-01-29soldstatus
-
2017-11-13$69,500
-
2009-01-07soldstatus
ⓘ Source: listings_history table (triggers on properties + properties_extension) + one-shot
backfill from property_details.listing_events for pre-trigger history.
Tax reassessment forecast TX · Resets to sale price
- Current annual tax
- $4,516 · $376/mo
- Projected year-2 tax
- $4,516 · $376/mo
- Expected delta
- $0/yr ($0/mo · 0.0%)
ⓘ Screening estimate from a state-policy table — verify with the county assessor before closing.
Climate risk First Street
- Flood 8/10 Severe FEMA zone A · 99% chance over 30 yrs
- Wildfire 6/10 Major
- Heat 9/10 Extreme 7 d/yr ≥108°F today · 24 d/yr by 30 yrs out
- Wind 9/10 Extreme 99% chance of damaging wind over 30 yrs
- Air quality 2/10 Low 1 unhealthy d/yr today · 1 by 30 yrs out
Nearby sold comps map
Loading sold comps map…
Walkable amenities ~0.75 mi
Loading nearby amenities…
Taxation est. · year 1
- Rental income
- $19,645
- − Mortgage interest
- −$13,444
- − Property taxes
- −$4,516
- − Insurance
- −$2,702
- − Repairs & maintenance
- −$1,572
- − Management
- −$1,572
- − Depreciation
- −$6,982
- Taxable loss
- −$11,142
- Est. tax savings @ 24.0%
- +$2,674
- After-tax cash flow
- $-4,128/yr
For passive investors: Depreciation is non-cash, so a rental often shows a tax loss while cash-flowing — sheltering income. Rental losses are passive: they offset passive income freely, and up to $25,000/yr can offset ordinary (W-2) income if you actively participate and your MAGI is under $100k (phasing out to $0 by $150k); unused losses carry forward. On sale, claimed depreciation is recaptured at up to 25%, and gains may owe capital-gains tax (a 1031 exchange can defer both). Figures are a year-1 estimate at your 24.0% rate — not tax advice; consult a CPA.
Schools (NCES district)
- District
- Orangefield ISD
- NCES district ID
- 4833780
- Math proficiency
- 44% ▬ 0.00%
- Reading proficiency
- 48% ▬ 0.00%
- Median HH income
- $63,682
- Composite
- 40.77/100
- National rank
- #3647
- State rank
- #217 of 826 in TX
Livability — Orange
- Score
- 71/100
- State rank
- #286
- US rank
- #6456
Category grades
Schools grade is shown separately in the Schools card above.
Census & demographics
- County
- Orange County · 87,112 people
- City population
- 22,976
- Metro
- Beaumont-Port Arthur, TX
- Population (ZIP)
- 28,983
- Household income
- $64,373
- Rent vs Own
- Severe rent burden
- 1018.0
Population outlook (Orange County) Hauer SSP2
- Today (2025)
- 88,065 people
- By 2030
- 89,591 · +1.7%
- By 2040
- 91,982 · +4.4%
- By 2050
- 93,023 · +5.6%
- By 2075
- 94,871 · +7.7%
- By 2100
- 88,155 · +0.1%
Race, ethnicity, and origin ACS 2023
- Neighborhood character
- Majority White (64%)
- Race & ethnicity
- White 64% Black 21% Hispanic / Latino 11% Two or more races 9%
- Hispanic origin (detail)
- Mexican 7%
- Common ancestry
- Lithuanian 13% Italian 1% Slovak 1%
- Foreign-born
- 5% · Canada
- Languages at home
- 91% English-only · Spanish 7% French/Haitian/Cajun 1% Other Asian/Pacific 1%
Political lean MEDSL · Orange
- 2024 margin
- Solid R (+66.8) · D 16.4% · R 83.1%
- 2008→2024 swing
- -19.6pp toward R · 2008: -47.1pp · 2024: -66.8pp
- All cycles
- 2024: R+66.8 2020: R+63.4 2016: R+61.9 2012: R+54.3 2008: R+47.1
Not yet ingested
- Civics
- —
Market trends
- HPI YoY
- ▲ 1.01%
- Current HPI
- 264.14
- Rent YoY
- ▲ 5.71%
- Metro
- Beaumont-Port Arthur, TX
- State GDP YoY
- ▲ 3.95%
- F500 in state
- 110
Industry mix (Fortune 500 HQ in TX)
| Industry | F500 HQs | Revenue |
|---|---|---|
| Energy | 16 | $1,198B |
|
||
| Technology | 5 | $198B |
|
||
| Engineering / Construction | 4 | $72B |
|
||
| Energy Services | 3 | $60B |
|
||
| Utilities | 3 | $41B |
|
||
| Healthcare | 2 | $330B |
|
||
Price history
+245.3% since first listed9 events — show timeline
- 2026-04-13 Price Changed $240,000 BBOR
- 2026-03-09 Listed $280,000 BBOR
- 2019-06-14 Sold (Public Records) — Public Records
- 2019-06-13 Sold (MLS) — BBOR
- 2019-05-09 Listed $255,000 BBOR
- 2018-02-02 Sold (Public Records) — Public Records
- 2018-01-29 Sold (MLS) — BBOR
- 2017-11-13 Listed $69,500 BBOR
- 2009-01-07 Sold (Public Records) — Public Records
Property tax history
+26.6%/yrLatest (2025): $4,516 · -2.7% YoY. Source: county tax records.
Cash-flow waterfall
monthlySold comps — $/sqft
last 12 mo · ≤1 miLoading sold comps…