429 E Mulberry · Rogers, AR
Flood risk 1/10 · Minimal
- FEMA flood zone
- X (unshaded)
- Chance of flooding over 30 yrs
- 0.0%
- Est. flood insurance / yr
- $507 – $1,088
Fire risk 4/10 · Minor
- Est. fire insurance / yr
- $1,499 – $2,785
Heat risk 5/10 · Moderate
- Hot days now (above 104°F)
- 7 days/yr
- Hot days in 30 yrs
- 22 days/yr
Wind risk 2/10 · Minimal
- Chance of severe wind over 30 yrs
- 2.0%
Air-quality risk 2/10 · Minimal
- Unhealthy air days now
- 1 days/yr
- Unhealthy air days in 30 yrs
- 1 days/yr
Risk factors via First Street. Map © Google.
Why this score? — see what drove the D- grade
The composite is a weighted blend of 9 inputs, each scored 0–100. Each bar is that input's sub-score; the figure is the points it added to the 100-point composite (weight × sub-score).
- ARV discount +10.7/15.0
- Cash flow +8.3/30.0
- Rent growth +5.0/5.0
- Livability +4.5/5.0
- Schools +3.9/10.0
- 1% rule +2.6/10.0
- Condition / age +2.5/5.0
- DSCR +2.3/10.0
- Appreciation +0.0/10.0
$198,000
🖨 Deal sheet (PDF) 📄 Offer letter ✓ Due diligence
Listing remarks MLS
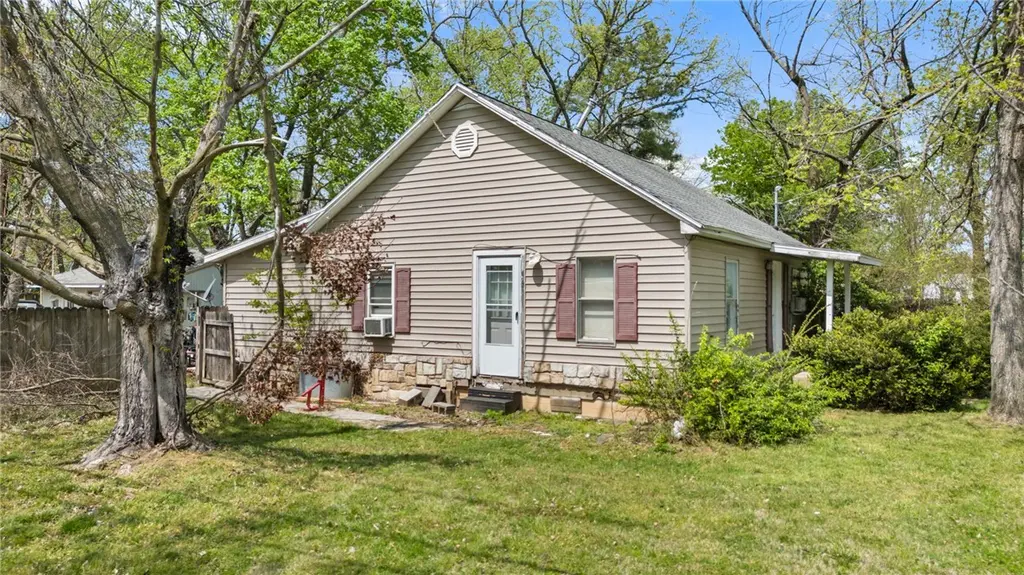
Cute home in Rogers on a large corner lot. Features include 3 bed 1.5 bath, tile and carpet floors, covered patio, large backyard and side yard, shaded with mature trees, detached garage with inlaw quarters. Inlaw quarters include 1 bath, 1 bed, and living area with kitchenette. Don't miss this quaint home before it's gone!
Key facts
- Gutted kitchen
- New roof
- 0.33 acre lot
Tags
Property features AI
Finance
- HOA & community: Monthly association fee; Community features include biking, trails/paths, park, near fire station and hospital, near schools
Exterior
- Parking: Carport; RV access/parking; 2 covered spaces
- Security: Security system
- Utilities: Cable available; Public water; Sewer available (public sewer and septic tank options); Septic available
- Home design: Single-story home; Faces east; Crawlspace foundation; Age listed as unknown; Has home warranty
- Construction: Vinyl siding; Architectural shingle roof
- Exterior features: Gravel driveway; Partial fencing; Corner lot; Cleared and level lot; Near park; Open lot; Subdivision location; Central business district nearby; Public paved road frontage (shared)
Interior
- Kitchen: Gas cooktop; Tile counters
- Bedrooms: Bedrooms located on the main level
- Flooring: Vinyl
- Bathrooms: 1 full bathroom; 1 half bathroom
- Heating & cooling: Electric heating; Gas heating; Heat pump; Window unit heating; Electric cooling; Gas cooling; Window unit cooling
- Interior features: Attic; Ceiling fan(s); Split bedrooms; Storage; Tile countertops; Walk-in closet(s); Fixer condition noted
- Laundry & utility: Washer hookup; Dryer hookup; Tankless water heater
Neighborhood map
What this means for you Summary
Snapshot
- This is a 3-bed/1.0-bath single-family listed at $198k.
Deal economics
- At list price, monthly cash flow is $-181 ($-2k/yr) — negative.
- To cash-flow at today's rent, offer at most $172k (13.2% below list).
- To meet the 1% rule (rent ≥ 1% of price), the offer needs to be $150k (24.1% below list).
- Recommended offer: $150k (24.1% below list) — sets the bar for 1% rule.
- Cap rate 5.2% vs local median 2.5% in Rogers — top-decile yield for the area; either an underpriced asset or a hidden risk that comps aren't pricing in. Stress-test before assuming the spread holds.
Location & tenants
- Location reads 90/100 on livability (#1 in AR, #98 nationally) — a professional / high-income tenant draw. Strengths: amenities A+, commute A+, cost of living A+.
- Rogers School District (urban): math 45% / reading 45% proficiency, ranked #31 of 238 in AR (top 13%) — families likely to look elsewhere, expect single-tenant / working-renter base with shorter leases.
- Zoned schools: Eastside Elementary School (math 60% / reading 48%, grade C, #72 of 454 statewide, top 16%, 488 students, 61% FRL); Lingle Middle School (math 45% / reading 48%, grade D+, #49 of 201 statewide, top 26%, 766 students, 56% FRL); Rogers Heritage High School (math 25% / reading 35%, grade F, #138 of 292 statewide, top 48%, 2,080 students, 48% FRL) — zoned schools at 55% FRL track the district average.
- Market conditions: Rents rising fast (+10.0%/yr); 529 active listings in the ZIP; 6 comparable units currently listed for rent nearby; rentals at typical pace (median 25d on market — plan ~3-4 weeks tenant-placement turnaround); 4,359 units permitted in Benton County in 2024 (402 in 5+ unit buildings).
Forward outlook
- Local home prices are declining (-3.0%/yr); year-one equity from $1k of loan paydown is wiped out by about $6k of value loss. Plan a longer hold.
- Benton County population projected at +56% by 2050 — long-run rental-demand tailwind backs the buy-and-hold thesis.
Negotiation context
- It's been on market 61 days — a 6% lower offer ($186k) is reasonable based on typical stale-listing flexibility.
- 2 sale attempts since 10y ago with the ask held roughly flat each time — persistent listings suggest the price (not the market) is what's stuck; bring a comps-based counter.
- Current owner paid $85k; list at $198k implies a 133% gain — meaningful room to come down on a strong offer.
Risks & watch-outs
- Climate carrying-cost: extreme-heat days projected 7→22/yr by 2055 (HVAC capex compounding) — expect insurance premiums to compound above CPI over the hold.
Questions for the listing agent
- What do current leases actually rent for vs. the listed asking? Can we see a recent rent roll and the last 12 months of T-12 income?
- It's been on market 61 days. Have you received any prior offers? Is the seller open to a 24% concession, seller financing, or rate buy-down credit?
- Why hasn't it sold? Are there any deal-killer items the seller is aware of (foundation, flood, title, zoning, code violations)?
- Is there a deadline driving the sale (1031 exchange, divorce, estate, relocation)? That informs how much negotiation room exists.
- Schools are B-rated — typically a magnet for longer-tenancy family renters. What's the average tenant stay here, and is there a school-zone premium baked into asking?
- The area grade is low — what's the realistic commute time and amenity access for the typical tenant pool here? Any planned neighborhood developments (good or bad) we should know about?
- What's the average days-on-market for RENTAL listings here right now (not sales)? A rising rental-DOM trend means longer vacancies and softer asking-rent achievability than the comps imply.
- What's the recent tenant-quality profile in this submarket — average credit score on applications, eviction rate, late-payment / NSF rate, and stable-employment percentage? A property-management company in the area should have these aggregated.
- How much new for-sale + rental construction is in the pipeline within 1–3 miles? Heavy new supply typically softens prices + rents 12–24 months out; constrained supply supports both.
Investment metrics
- 1% rule
- 0.76% ✗
- Cap rate
- 5.20%
- Cash-on-cash
- -3.92%
- DSCR
- 0.83
- GRM
- 11.0
CMA / ARV
- ARV (on-the-fly)
- $213,044
- Comps found
- 12
Show comp detail 12 sales within ~0.75 mi
| Address | Dist | Beds/Ba | Sqft | Sold | Price | $/sf | Match |
|---|---|---|---|---|---|---|---|
| 429 E Mulberry | 0.00mi | 3/1.5 | 1,000 (+4%) | 0mo | $172,000 | $172 | 92 |
| 1021 S B St | 0.11mi | 3/2.0 | 990 (+3%) | 5mo | $255,000 | $258 | 82 |
| 1419 Arkansas St | 0.30mi | 3/1.5 | 1,040 (+8%) | 2mo | $250,000 | $240 | 69 |
| 207 E Gum St | 0.24mi | 2/1.0 (-1) | 923 (-4%) | 14mo | $230,000 | $249 | 65 |
| 415 E Oak St | 0.17mi | 2/1.0 (-1) | 1,020 (+6%) | 15mo | $225,000 | $221 | 65 |
| 922 S B St | 0.14mi | 2/1.0 (-1) | 1,100 (+14%) | 7mo | $165,000 | $150 | 59 |
| 324 E Glenwood Ave | 0.28mi | 2/1.0 (-1) | 1,064 (+10%) | 7mo | $182,000 | $171 | 59 |
| 614 S Cresent St | 0.65mi | 2/1.0 (-1) | 996 (+3%) | 6mo | $218,000 | $219 | 54 |
| 519 B St | 0.33mi | 2/1.0 (-1) | 840 (-13%) | 7mo | $165,000 | $196 | 52 |
| 709 E Mimosa Pl | 0.58mi | 2/1.5 (-1) | 1,052 (+9%) | 6mo | $235,000 | $223 | 46 |
| 1820 S E St | 0.75mi | 3/2.0 | 1,057 (+10%) | 16mo | $227,000 | $215 | 32 |
| 107 C St | 0.71mi | 3/2.0 | 1,104 (+14%) | 16mo | $255,000 | $231 | 26 |
Match score weights: distance 35% · size 25% · config 20% · recency 20%. Top-matched comps best support the ARV.
Projected returns pro-forma
-3.0% appreciation · 8.0% rent growth · sell at horizon
- IRR
- -17.5%
- Equity multiple
- 0.36×
- Total profit
- $-35,656
- Equity at exit
- $29,522
- IRR
- -2.1%
- Equity multiple
- 0.83×
- Total profit
- $-9,663
- Equity at exit
- $17,119
Cash invested: $55,440 (down + closing). Projections, not guarantees.
Landlord ↔ Tenant lean methodology
- Overall (STATE)
- 92 Strongly Landlord-Friendly
- State Arkansas
- 92 Strongly Landlord-Friendly · R+14
- County
- — inherits STATE
- City
- — inherits STATE
ZIP-level market 72756
- Home prices YoY
- -18.4%
- Rents YoY
- 10.0%
- Active inventory
- 529
- Price-to-rent
- 11.0×
Monthly cashflow live
- Estimated rent
- $1,503 high interval (Pro) →
- Mortgage (P&I)
- −$1,038
- Tax est. 1.5%
- −$248 /mo · $2,970/yr
- Insurance
- −$82
- HOA
- −$0
- Vacancy / Maint / Mgmt
- −$316
- Net cashflow
- $-181
Break-even live
Sensitivity live
| Price | -10% $-44 | -5% $-113 | +0% $-181 | +5% $-250 | +10% $-318 |
|---|---|---|---|---|---|
| Rent | -10% $-300 | -5% $-240 | +0% $-181 | +5% $-122 | +10% $-62 |
| Rate | -1.0pp $-81 | -0.5pp $-131 | base $-181 | +0.5pp $-232 | +1.0pp $-285 |
UW: 25.0% down · 7.5% · 30yr · 1.5% tax · 5.0% vac · 8.0% maint · 8.0% mgmt
Financing live
Cash to close
- Down payment
- $49,500
- Closing costs
- $5,940
- Reserves months
- —
- Total cash needed
- —
Loan-product check · same deal, 3 products live
Conventional
25% down · 7.5% · 30yr
- Down + closing
- —
- Monthly P&I
- —
- Monthly cashflow
- —
- DSCR
- —
- Eligible?
- —
Personal DTI + credit; lowest rate.
DSCR
20% down · 8.5% · 30yr
- Down + closing
- —
- Monthly P&I
- —
- Monthly cashflow
- —
- DSCR
- —
- Eligible?
- —
No personal income docs; deal must DSCR.
Hard money
10% down · 12.0% · 12mo
- Down + closing
- —
- Monthly P&I
- —
- Monthly cashflow
- —
- DSCR
- —
- Eligible?
- —
Short-term bridge; refi at stabilization.
Rent comps 6 comps
| Address | Beds | Baths | Sqft | Rent | $/sqft | DOM | Units | Dist |
|---|---|---|---|---|---|---|---|---|
| 400 W Poplar St Unit D Rogers, AR | 2.0 | 1.0 | 800 | $1,330 | $1.66 | 25d | 1 | 0.73mi |
| 104 W Chestnut St Rogers, AR | 2.0 | 1.0–2.0 | 769 | $1,799 | $2.34 | 16d | 22 | 0.79mi |
| 401 N 1st St Rogers, AR | 2.0 | 1.0–2.0 | 758 | $1,795 | $2.37 | 16d | 29 | 0.96mi |
| 623 N 7th St Rogers, AR | 2.0 | 1.5 | 1000 | $1,350 | $1.35 | 25d | 1 | 1.27mi |
| 1918 S 9th St Unit 215 Rogers, AR | 2.0 | 1.0 | 875 | $935 | $1.07 | 25d | 1 | 1.31mi |
| 1918 S 9th St Unit 236 Rogers, AR | 2.0 | 1.0 | 875 | $935 | $1.07 | 16d | 1 | 1.31mi |
Listing history 16 events
-
2026-06-13days on market $198,000 Active 61 DOM
-
2026-06-10days on market $198,000 Active 59 DOM
-
2026-06-09days on market $198,000 Active 58 DOM
-
2026-06-08days on market $198,000 Active 57 DOM
-
2026-06-07days on market $198,000 Active 56 DOM
-
2026-06-05days on market $198,000 Active 53 DOM
-
2026-06-03days on market $198,000 Active 52 DOM
-
2026-06-02days on market $198,000 Active 51 DOM
-
2026-06-01days on market $198,000 Active 50 DOM
-
2026-05-31days on market $198,000 Active 49 DOM
-
2026-05-31days on market $198,000 Active 48 DOM
-
2026-04-12$198,000 Active
-
2016-11-01soldstatus $85,000
-
2016-10-28soldstatus $85,000 325-char remark
Show marketing remark (325 chars)
Cute home in Rogers on a large corner lot. Features include 3 bed 1.5 bath, tile and carpet floors, covered patio, large backyard and side yard, shaded with mature trees, detached garage with inlaw quarters. Inlaw quarters include 1 bath, 1 bed, and living area with kitchenette. Don't miss this quaint home before it's gone!
-
2016-07-28$85,000 325-char remark
Show marketing remark (325 chars)
Cute home in Rogers on a large corner lot. Features include 3 bed 1.5 bath, tile and carpet floors, covered patio, large backyard and side yard, shaded with mature trees, detached garage with inlaw quarters. Inlaw quarters include 1 bath, 1 bed, and living area with kitchenette. Don't miss this quaint home before it's gone!
-
1999-02-02soldstatus $49,000
ⓘ Source: listings_history table (triggers on properties + properties_extension) + one-shot
backfill from property_details.listing_events for pre-trigger history.
Climate risk First Street
- Flood 1/10 Low FEMA zone X (unshaded) · 0% chance over 30 yrs
- Wildfire 4/10 Moderate
- Heat 5/10 Major 7 d/yr ≥104°F today · 22 d/yr by 30 yrs out
- Wind 2/10 Low 2% chance of damaging wind over 30 yrs
- Air quality 2/10 Low 1 unhealthy d/yr today · 1 by 30 yrs out
Nearby sold comps map
Loading sold comps map…
Walkable amenities ~0.75 mi
Loading nearby amenities…
Taxation est. · year 1
- Rental income
- $18,034
- − Mortgage interest
- −$11,091
- − Property taxes
- −$2,970
- − Insurance
- −$990
- − Repairs & maintenance
- −$1,443
- − Management
- −$1,443
- − Depreciation
- −$5,760
- Taxable loss
- −$5,663
- Est. tax savings @ 24.0%
- +$1,359
- After-tax cash flow
- $-814/yr
For passive investors: Depreciation is non-cash, so a rental often shows a tax loss while cash-flowing — sheltering income. Rental losses are passive: they offset passive income freely, and up to $25,000/yr can offset ordinary (W-2) income if you actively participate and your MAGI is under $100k (phasing out to $0 by $150k); unused losses carry forward. On sale, claimed depreciation is recaptured at up to 25%, and gains may owe capital-gains tax (a 1031 exchange can defer both). Figures are a year-1 estimate at your 24.0% rate — not tax advice; consult a CPA.
Schools (NCES district)
- District
- Rogers School District
- NCES district ID
- 0511970
- Math proficiency
- 45% ▼ -9.00%
- Reading proficiency
- 45% ▼ -9.00%
- Median HH income
- $51,712
- Composite
- 38.81/100
- National rank
- #4113
- State rank
- #31 of 238 in AR
Livability — Rogers
- Score
- 90/100
- State rank
- #1
- US rank
- #98
Category grades
Schools grade is shown separately in the Schools card above.
Census & demographics
- Census place
- Rogers, AR
- County
- Benton County · 259,241 people
- City population
- 90,024
- Metro
- Fayetteville-Springdale-Rogers, AR
- Population (ZIP)
- 41,791
- Household income
- $72,230
- Rent vs Own
- Severe rent burden
- 981.0
Population outlook (Benton County) Hauer SSP2
- Today (2025)
- 318,683 people
- By 2030
- 353,481 · +10.9%
- By 2040
- 425,280 · +33.4%
- By 2050
- 497,239 · +56.0%
- By 2075
- 662,114 · +107.8%
- By 2100
- 776,431 · +143.6%
Race, ethnicity, and origin ACS 2023
- Neighborhood character
- Diverse neighborhood (Simpson 0.63)
- Race & ethnicity
- White 49% Hispanic / Latino 36% Two or more races 30% Native American 2% Asian 1%
- Hispanic origin (detail)
- Mexican 25%
- Common ancestry
- Lithuanian 2% Slovak 2% Italian 1%
- Foreign-born
- 19% · Canada
- Languages at home
- 74% English-only · Spanish 25% Other Asian/Pacific 1%
Political lean MEDSL · Benton
- 2024 margin
- Strong R (+27.0) · D 35.2% · R 62.1% · Other 2.7%
- 2008→2024 swing
- +9.6pp toward D · 2008: -36.5pp · 2024: -27.0pp
- All cycles
- 2024: R+27.0 2020: R+26.4 2016: R+34.9 2012: R+40.4 2008: R+36.5
Not yet ingested
- Civics
- —
Market trends
- HPI YoY
- ▼ -82.57%
- Current HPI
- 366.432
- Rent YoY
- ▲ 10.01%
- Metro
- Fayetteville-Springdale-Rogers, AR
- State GDP YoY
- ▲ 3.80%
- F500 in state
- 10
Industry mix (Fortune 500 HQ in AR)
| Industry | F500 HQs | Revenue |
|---|---|---|
| Retail | 1 | $681B |
|
||
| Food / Agriculture | 1 | $53B |
|
||
| Retail / Energy | 1 | $22B |
|
||
| Transportation / Logistics | 1 | $12B |
|
||
| Energy | 1 | $4B |
|
||
Price history
+304.1% since first listed5 events — show timeline
- 2026-04-12 Listed $198,000 NWARMLS
- 2016-11-01 Sold (Public Records) $85,000 Public Records
- 2016-10-28 Sold (MLS) $85,000 NWARMLS
- 2016-07-28 Listed $85,000 NWARMLS
- 1999-02-02 Sold (Public Records) $49,000 Public Records
Property tax history
-0.7%/yrLatest (2025): $238 · -19.1% YoY. Source: county tax records.
Cash-flow waterfall
monthlySold comps — $/sqft
last 12 mo · ≤1 miLoading sold comps…