 🏗️ New Construction
31204 Peach Leaf Dr · Winchester, CA
Flood risk No data
- FEMA flood zone
- —
- Chance of flooding over 30 yrs
- —
- Est. flood insurance / yr
- —
Fire risk No data
- Est. fire insurance / yr
- —
Heat risk No data
- Hot days now (above threshold)
- —
- Hot days in 30 yrs
- —
Wind risk No data
- Chance of severe wind over 30 yrs
- —
Air-quality risk No data
- Unhealthy air days now
- —
- Unhealthy air days in 30 yrs
- —
Risk factors via First Street. Map © Google.
Why this score? — see what drove the D- grade
The composite is a weighted blend of 9 inputs, each scored 0–100. Each bar is that input's sub-score; the figure is the points it added to the 100-point composite (weight × sub-score).
- Appreciation +10.0/10.0
- ARV discount +7.5/15.0
- Cash flow +7.3/30.0
- Schools +4.5/10.0
- Livability +2.6/5.0
- Condition / age +2.5/5.0
- Rent growth +2.3/5.0
- DSCR +1.5/10.0
- 1% rule +0.9/10.0
$608,990
🖨 Deal sheet 📄 Offer letter ✓ Due diligence
Listing remarks MLS
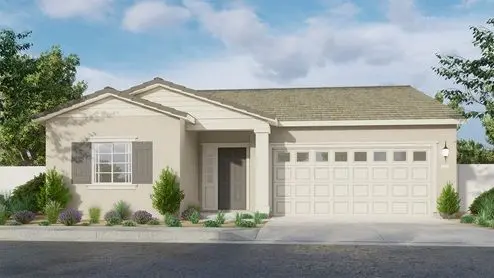
Discover the Residence 1576, designed with efficient, yet comfortable space planning in mind. This home is single-story with 1,576 square feet, 3 bedrooms and 2 bathrooms, an island kitchen with pantry closet, interior laundry room, and a 2-car garage pre-plumbed for an electric car. Among the features and finishes, homeowners will appreciate the unparalleled peace of mind of owning America's Smart Home-a whole-home network of Wi-Fi enabled smart home devices by brands you trust, all conveniently controlled from your smartphone, or the sleek touch screen panel mounted near the entry of each new home.
Key facts
- Quartz counters
- Island kitchen
- Recessed lighting
Tags
Property features AI
Finance
- Other: Located in the Juniper subdivision; Builder name: DR Horton
- Financial info: Subject to special assessments and Mello-Roos
- HOA & community: No homeowners association; Community features include curbs, street lighting, and sidewalks; Community of 188 units
Exterior
- Parking: Attached 2-car garage; Driveway (concrete); 2 uncovered parking spaces; Total of 4 parking spaces
- Security: Smoke and carbon monoxide detectors
- Utilities: Public/district water; Public sewer; Natural gas connected; Electricity connected; Underground utilities
- Home design: House; One story; Front entry; Faces west; Under construction
- Construction: Built by DR Horton (builder source); Model 1576
- Exterior features: Tile roof; Stucco exterior with drywall interior walls; Block wall and vinyl fencing; Landscaped front yard with sprinklers (front and drip system); Sprinklers present; No pool
Interior
- Kitchen: Kitchen open to family room; Kitchen island; Quartz counters; Breakfast counter/bar; Energy Star appliances; Built-in range; Gas range; Microwave; Dishwasher; Garbage disposal; Gas water heater; Tankless water heater
- Bedrooms: 3 bedrooms on the main level; Primary suite
- Flooring: See remarks
- Bathrooms: 2 full baths; Double sinks in primary bath; Walk-in shower in primary bath; Shower-over-tub in at least one bath; Privacy toilet door; Bathtub; Low-flow toilets and low-flow shower
- Heating & cooling: Forced air heating; Solar heating; Central high-efficiency cooling
- Interior features: Unfurnished; Home automation system; Recessed lighting; Open floor plan; Front entry; One level; Double pane windows with low-e glass and screens; Carbon monoxide and smoke detectors
- Laundry & utility: Individual laundry room; Washer hookup; Gas dryer hookup
Neighborhood map
What this means for you Summary
Snapshot
- This is a 3-bed/2.0-bath land listed at $609k.
Deal economics
- At list price, monthly cash flow is $-809 ($-10k/yr) — negative.
- To cash-flow at today's rent, offer at most $466k (23.5% below list).
- To meet the 1% rule (rent ≥ 1% of price), the offer needs to be $358k (41.3% below list).
- Recommended offer: $358k (41.3% below list) — sets the bar for 1% rule.
- Cap rate 4.7% vs local median 3.8% in Winchester — meaningfully above typical; check what's discounted (condition, days-on-market, listing class) to confirm the premium yield is real.
Location & tenants
- Location reads 52/100 on livability (#992 in CA) — a working-class tenant base; expect higher turnover. Strengths: crime B; Watch: schools D, amenities F, commute F.
- Menifee Union Elementary (suburban): math 43% / reading 56% proficiency, ranked #434 of 1,400 in CA (top 31%) — families likely to look elsewhere, expect single-tenant / working-renter base with shorter leases.
- Market conditions: Rents soft (-0.8%/yr); 355 active listings in the ZIP; 3 comparable units currently listed for rent nearby; rentals leasing fast (median 3d on market — plan ~1-2 weeks tenant-placement turnaround); high-income renter base; 9,195 units permitted in Riverside County in 2024 (1,512 in 5+ unit buildings).
- This rent runs 32% of the median local income ($133k/yr) — at the standard rent-burdened threshold; future hikes will face affordability resistance.
Forward outlook
- In year one you build about $65k of equity ($4k loan paydown + $61k appreciation (10.0% local appreciation)).
- Riverside County population projected at +22% by 2050 — long-run rental-demand tailwind backs the buy-and-hold thesis.
- By year 2, paydown + projected appreciation supports a ~$105k cash-out refi (75% LTV) — recoverable capital for the next deal without selling this one.
Negotiation context
- It's been on market 29 days — a 2% lower offer ($600k) is reasonable based on typical stale-listing flexibility.
- 2 sale attempts with the ask held roughly flat each time — persistent listings suggest the price (not the market) is what's stuck; bring a comps-based counter.
Questions for the listing agent
- What do current leases actually rent for vs. the listed asking? Can we see a recent rent roll and the last 12 months of T-12 income?
- Is there a deadline driving the sale (1031 exchange, divorce, estate, relocation)? That informs how much negotiation room exists.
- Schools are D-rated, which usually means shorter tenancies and higher turnover. Who's the typical renter profile here, and what's been the actual vacancy rate?
- The area grade is low — what's the realistic commute time and amenity access for the typical tenant pool here? Any planned neighborhood developments (good or bad) we should know about?
- What's the average days-on-market for RENTAL listings here right now (not sales)? A rising rental-DOM trend means longer vacancies and softer asking-rent achievability than the comps imply.
- What's the recent tenant-quality profile in this submarket — average credit score on applications, eviction rate, late-payment / NSF rate, and stable-employment percentage? A property-management company in the area should have these aggregated.
- How much new for-sale + rental construction is in the pipeline within 1–3 miles? Heavy new supply typically softens prices + rents 12–24 months out; constrained supply supports both.
Investment metrics
- 1% rule
- 0.59% ✗
- Cap rate
- 4.70%
- Cash-on-cash
- -5.69%
- DSCR
- 0.75
- GRM
- 14.2
CMA / ARV
No comps found within radius.
Projected returns pro-forma
10.0% appreciation · 0.0% rent growth · sell at horizon
- IRR
- 19.6%
- Equity multiple
- 2.58×
- Total profit
- $269,390
- Equity at exit
- $548,626
- IRR
- 17.5%
- Equity multiple
- 5.78×
- Total profit
- $814,445
- Equity at exit
- $1,183,134
Cash invested: $170,517 (down + closing). Projections, not guarantees.
Landlord ↔ Tenant lean methodology
- Overall (STATE)
- 18 Strongly Tenant-Friendly
- State California
- 18 Strongly Tenant-Friendly · D+13
- County
- — inherits STATE
- City
- — inherits STATE
ZIP-level market 92596
- Home prices YoY
- 3.9%
- Rents YoY
- -0.8%
- Active inventory
- 355
- Price-to-rent
- 14.2×
Monthly cashflow live
- Estimated rent
- $3,577 medium interval (Pro) →
- Mortgage (P&I)
- −$3,194
- Tax from tax record
- −$187 /mo · $2,246/yr
- Insurance
- −$254
- HOA
- −$0
- Vacancy / Maint / Mgmt
- −$751
- Net cashflow
- $-809
Break-even live
UW: 25.0% down · 7.5% · 30yr · 1.5% tax · 5.0% vac · 8.0% maint · 8.0% mgmt
Financing live
Cash to close
- Down payment
- $152,248
- Closing costs
- $18,270
- Reserves months
- —
- Total cash needed
- —
Loan-product check · same deal, 3 products live
Conventional
25% down · 7.5% · 30yr
- Down + closing
- —
- Monthly P&I
- —
- Monthly cashflow
- —
- DSCR
- —
- Eligible?
- —
Personal DTI + credit; lowest rate.
DSCR
20% down · 8.5% · 30yr
- Down + closing
- —
- Monthly P&I
- —
- Monthly cashflow
- —
- DSCR
- —
- Eligible?
- —
No personal income docs; deal must DSCR.
Hard money
10% down · 12.0% · 12mo
- Down + closing
- —
- Monthly P&I
- —
- Monthly cashflow
- —
- DSCR
- —
- Eligible?
- —
Short-term bridge; refi at stabilization.
Rent comps 3 comps
| Address | Beds | Baths | Sqft | Rent | $/sqft | DOM | Units | Dist |
|---|---|---|---|---|---|---|---|---|
| Autumn Blaze Dr , CA | 3.0 | 2.0 | 1576 | $3,075 | $1.95 | 2d | 1 | 0.15mi |
| 31319 Autumn Blaze Dr Winchester, CA | 3.0 | 2.0 | 1576 | $3,350 | $2.13 | 1d | 1 | 0.21mi |
| 31058 Water Beech Dr Winchester, CA | 3.0 | 2.5 | 1705 | $3,900 | $2.29 | 2d | 1 | 0.42mi |
Listing history 16 events
-
2026-06-18days on market $608,990 Active 29 DOM
-
2026-06-17days on market $608,990 Active 28 DOM
-
2026-06-16days on market $608,990 Active 27 DOM
-
2026-06-15days on market $608,990 Active 26 DOM
-
2026-06-13days on market $608,990 Active 24 DOM
-
2026-06-09days on market $608,990 Active 20 DOM
-
2026-06-08days on market $608,990 Active 19 DOM
-
2026-06-07days on market $608,990 Active 18 DOM
-
2026-06-04days on market $608,990 Active 15 DOM
-
2026-06-03days on market $608,990 Active 14 DOM
-
2026-06-02days on market $608,990 Active 13 DOM
-
2026-06-01days on market $608,990 Active 12 DOM
-
2026-05-31days on market $608,990 Active 11 DOM
-
2026-05-21$608,990 Active 607-char remark
Show marketing remark (607 chars)
Discover the Residence 1576, designed with efficient, yet comfortable space planning in mind. This home is single-story with 1,576 square feet, 3 bedrooms and 2 bathrooms, an island kitchen with pantry closet, interior laundry room, and a 2-car garage pre-plumbed for an electric car. Among the features and finishes, homeowners will appreciate the unparalleled peace of mind of owning America's Smart Home-a whole-home network of Wi-Fi enabled smart home devices by brands you trust, all conveniently controlled from your smartphone, or the sleek touch screen panel mounted near the entry of each new home.
-
2026-05-20$608,990 Active
-
2025-12-30soldstatus $10,000,000
ⓘ Source: listings_history table (triggers on properties + properties_extension) + one-shot
backfill from property_details.listing_events for pre-trigger history.
Tax reassessment forecast CA · Resets to sale price
- Current annual tax
- $2,246 · $187/mo
- Projected year-2 tax
- $4,628 · $386/mo
- Expected delta
- +$2,382/yr (+$199/mo · 106.1%)
ⓘ Screening estimate from a state-policy table — verify with the county assessor before closing.
Nearby sold comps map
Loading sold comps map…
Walkable amenities ~0.75 mi
Loading nearby amenities…
Taxation est. · year 1
- Rental income
- $42,925
- − Mortgage interest
- −$34,113
- − Property taxes
- −$2,246
- − Insurance
- −$3,045
- − Repairs & maintenance
- −$3,434
- − Management
- −$3,434
- − Depreciation
- −$17,716
- Taxable loss
- −$21,063
- Est. tax savings @ 24.0%
- +$5,055
- After-tax cash flow
- $-4,648/yr
For passive investors: Depreciation is non-cash, so a rental often shows a tax loss while cash-flowing — sheltering income. Rental losses are passive: they offset passive income freely, and up to $25,000/yr can offset ordinary (W-2) income if you actively participate and your MAGI is under $100k (phasing out to $0 by $150k); unused losses carry forward. On sale, claimed depreciation is recaptured at up to 25%, and gains may owe capital-gains tax (a 1031 exchange can defer both). Figures are a year-1 estimate at your 24.0% rate — not tax advice; consult a CPA.
Schools (NCES district)
- District
- Menifee Union Elementary
- NCES district ID
- 0624540
- Math proficiency
- 43% ▬ 0.00%
- Reading proficiency
- 56% ▲ 3.00%
- Median HH income
- $58,228
- Composite
- 45.17/100
- National rank
- #5790
- State rank
- #434 of 1400 in CA
Livability — Winchester
- Score
- 52/100
- State rank
- #992
- US rank
- #24750
Category grades
Schools grade is shown separately in the Schools card above.
Census & demographics
- County
- Riverside County · 2,287,001 people
- City population
- 38,981
- Metro
- Riverside-San Bernardino-Ontario, CA
- Population (ZIP)
- 38,981
- Household income
- $132,538
- Rent vs Own
- Severe rent burden
- 591.0
Population outlook (Riverside County) Hauer SSP2
- Today (2025)
- 2,664,475 people
- By 2030
- 2,802,692 · +5.2%
- By 2040
- 3,050,904 · +14.5%
- By 2050
- 3,256,783 · +22.2%
- By 2075
- 3,655,058 · +37.2%
- By 2100
- 3,766,594 · +41.4%
Race, ethnicity, and origin ACS 2023
- Neighborhood character
- Highly diverse neighborhood (Simpson 0.72)
- Race & ethnicity
- White 38% Hispanic / Latino 34% Two or more races 16% Asian 12% Black 6% Pacific Islander 2%
- Hispanic origin (detail)
- Mexican 29%
- Common ancestry
- Slovak 3% Italian 2% Portuguese 1%
- Foreign-born
- 14% · Canada, Vietnam
- Languages at home
- 76% English-only · Spanish 16% Tagalog/Filipino 4% Vietnamese 1%
Political lean MEDSL · Riverside
- 2024 margin
- Toss-up / Even · D 48.0% · R 49.3% · Other 2.6%
- 2008→2024 swing
- -3.6pp toward R · 2008: 2.3pp · 2024: -1.3pp
- All cycles
- 2024: R+1.3 2020: D+8.0 2016: D+4.3 2012: R+0.4 2008: D+2.3
Not yet ingested
- Civics
- —
Market trends
- HPI YoY
- ▲ 12.43%
- Current HPI
- 332.169
- Rent YoY
- ▼ -0.79%
- Metro
- Riverside-San Bernardino-Ontario, CA
- State GDP YoY
- ▲ 3.21%
- F500 in state
- 116
Industry mix (Fortune 500 HQ in CA)
| Industry | F500 HQs | Revenue |
|---|---|---|
| Technology | 27 | $1,492B |
|
||
| Financial Services | 3 | $174B |
|
||
| Retail | 3 | $44B |
|
||
| Insurance | 3 | $26B |
|
||
| Media / Entertainment | 2 | $115B |
|
||
| Pharmaceuticals / Biotech | 2 | $62B |
|
||
Price history
-93.9% since first listed3 events — show timeline
- 2026-05-21 Listed $608,990 Zillow
- 2026-05-20 Listed $608,990 CRMLS
- 2025-12-30 Sold (Public Records) $10,000,000 Public Records
Property tax history
+935.3%/yrLatest (2025): $2,246 · +935.3% YoY. Source: county tax records.
Cash-flow waterfall
monthlySold comps — $/sqft
last 12 mo · ≤1 miLoading sold comps…