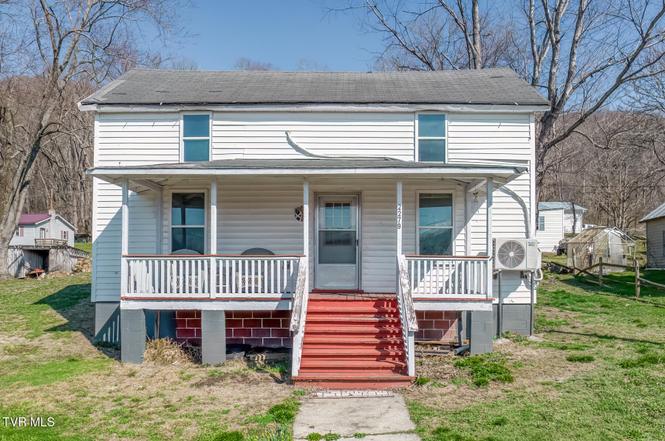
2279 Saltville Hwy · Saltville, VA
Flood risk 1/10 · Minimal
- FEMA flood zone
- X (unshaded)
- Chance of flooding over 30 yrs
- 0.0%
- Est. flood insurance / yr
- $507 – $1,088
Fire risk 5/10 · Moderate
- Est. fire insurance / yr
- $666 – $1,236
Heat risk 3/10 · Minor
- Hot days now (above 95°F)
- 9 days/yr
- Hot days in 30 yrs
- 26 days/yr
Wind risk 2/10 · Minimal
- Chance of severe wind over 30 yrs
- —
Air-quality risk 1/10 · Minimal
- Unhealthy air days now
- 0 days/yr
- Unhealthy air days in 30 yrs
- 0 days/yr
Risk factors via First Street. Map © Google.
Why this score? — see what drove the A- grade
The composite is a weighted blend of 9 inputs, each scored 0–100. Each bar is that input's sub-score; the figure is the points it added to the 100-point composite (weight × sub-score).
- Cash flow +29.3/30.0
- ARV discount +15.0/15.0
- DSCR +10.0/10.0
- 1% rule +8.2/10.0
- Appreciation +5.1/10.0
- Schools +4.5/10.0
- Livability +3.6/5.0
- Rent growth +2.5/5.0
- Condition / age +2.5/5.0
$79,900
🖨 Deal sheet 📄 Offer letter ✓ Due diligence
Listing remarks
Are you looking for a great deal in 2026? CASH only buyers. This is it under $100k for the year. When you can't even find a singlewide in good shape on a piece of land for under $100k now here's a home with 3 Bedrooms and 2 Baths, with a nice lot that needs a little TLC to make it your own! Are you looking for an addition to your rental portfolio? You can rent it out right now for $950-1,000 a month. At full price for a landlord you can have almost 15% ROI on your rental! Buyers and buyers' agents please verify all info taken from third party sources. Seller selling as-is no repairs will be done.
Key facts
- 0.24 acre lot
- Built 1933
- Listed 101 days
Property features AI
Exterior
- Parking: RV access/parking; Gravel parking
- Utilities: Public water; Sewer connected; Electricity connected; Septic tank
- Home design: Single family residence; House with two levels; Residential property in fixer condition; Zoning: R
- Construction: Block and vinyl siding construction; Block foundation; Built as a house
- Exterior features: Garden; Covered front porch; Storm door(s); Shingle roof; Cleared topography
Interior
- Kitchen: Electric range
- Bedrooms: Total rooms: 6
- Flooring: Carpet; Vinyl
- Bathrooms: 2 full bathrooms
- Heating & cooling: Central heating (electric); Central air conditioning
- Interior features: Electric range; Fireplace in the living room with stone surround; Crawl space foundation
- Laundry & utility: Washer hookup; Electric dryer hookup
Neighborhood map
What this means for you Summary
Snapshot
- This is a 3-bed/2.0-bath single-family listed at $80k.
Deal economics
- At list price, monthly cash flow is $282 ($3k/yr) — positive.
- The deal already cash-flows at list — no discount required.
- Meets the 1% rule at list price ($1k rent vs $80k).
- Recommended offer: $73k (9.0% below list) — sets the bar for market timing.
Location & tenants
- Location reads 72/100 on livability (#206 in VA) — a middle-class / working-renter tenant base. Strengths: crime A+, cost of living A+, housing A+; Watch: amenities F, commute F, employment F.
- Smyth County Public School District (rural): math 46% / reading 63% proficiency, ranked #89 of 131 in VA (top 68%) — acceptable for families but not a draw, mixed tenant base, ~2y average lease.
- Zoned schools: Rich Valley Elementary (math 47% / reading 57%, grade C-, #696 of 1,108 statewide, top 66%, 130 students, 92% FRL); Northwood Middle (math 42% / reading 67%, grade B-, #194 of 342 statewide, top 60%, 151 students, 86% FRL); Northwood High (math 62% / reading 77%, grade B, #159 of 319 statewide, top 53%, 240 students, 87% FRL) — zoned schools average 88% FRL vs 54% district-wide (34 pts higher); higher-poverty schools than district average — tighter screening recommended.
- Market conditions: 31 active listings in the ZIP; 38 units permitted in Smyth County in 2024 (0 in 5+ unit buildings).
Forward outlook
- In year one you build about $786 of equity ($552 loan paydown + $234 appreciation (0.3% local appreciation)).
- Smyth County population projected at -20% by 2050 — secular population decline; favor cash flow + early exit over multi-decade hold.
- At projected returns (0.3% appreciation + 3.0% rent growth), your $22k cash investment doubles in ~5 years — after that, you're playing with house money.
Negotiation context
- It's been on market 101 days — a 9% lower offer ($73k) is reasonable based on typical stale-listing flexibility.
- 2 sale attempts since 5y ago with the ask held roughly flat each time — persistent listings suggest the price (not the market) is what's stuck; bring a comps-based counter.
Risks & watch-outs
- Watch-outs: built in 1933 — expect roof / HVAC / electrical / plumbing capex.
- Climate carrying-cost: moderate wildfire risk — expect insurance premiums to compound above CPI over the hold.
Questions for the listing agent
- It's been on market 101 days. Have you received any prior offers? Is the seller open to a 9% concession, seller financing, or rate buy-down credit?
- Built in 1933 — when were the roof, HVAC, electrical panel, plumbing, and water heater last replaced?
- Why hasn't it sold? Are there any deal-killer items the seller is aware of (foundation, flood, title, zoning, code violations)?
- Is there a deadline driving the sale (1031 exchange, divorce, estate, relocation)? That informs how much negotiation room exists.
- Schools are A-rated — typically a magnet for longer-tenancy family renters. What's the average tenant stay here, and is there a school-zone premium baked into asking?
- What's the average days-on-market for RENTAL listings here right now (not sales)? A rising rental-DOM trend means longer vacancies and softer asking-rent achievability than the comps imply.
- What's the recent tenant-quality profile in this submarket — average credit score on applications, eviction rate, late-payment / NSF rate, and stable-employment percentage? A property-management company in the area should have these aggregated.
- How much new for-sale + rental construction is in the pipeline within 1–3 miles? Heavy new supply typically softens prices + rents 12–24 months out; constrained supply supports both.
Investment metrics
- 1% rule
- 1.32% ✓
- Cap rate
- 10.53%
- Cash-on-cash
- 15.12%
- DSCR
- 1.67
- GRM
- 6.3
CMA / ARV
- ARV (on-the-fly)
- $125,070
- Comps found
- 2
Show comp detail 2 sales within ~0.75 mi
| Address | Dist | Beds/Ba | Sqft | Sold | Price | $/sf | Match |
|---|---|---|---|---|---|---|---|
| 2218 Saltville Hwy | 0.15mi | 3/1.0 | 1,167 (+3%) | 2mo | $124,900 | $107 | 82 |
| 2384 Saltville Hwy | 0.25mi | 3/1.5 | 1,205 (+6%) | 11mo | $132,500 | $110 | 67 |
Match score weights: distance 35% · size 25% · config 20% · recency 20%. Top-matched comps best support the ARV.
Projected returns pro-forma
0.29% appreciation · 3.0% rent growth · sell at horizon
- IRR
- 15.3%
- Equity multiple
- 1.75×
- Total profit
- $16,732
- Equity at exit
- $24,375
- IRR
- 19.5%
- Equity multiple
- 3.21×
- Total profit
- $49,493
- Equity at exit
- $30,255
Cash invested: $22,372 (down + closing). Projections, not guarantees.
Landlord ↔ Tenant lean methodology
- Overall (STATE)
- 55 Moderately Landlord-Leaning
- State Virginia
- 55 Moderately Landlord-Leaning · D+2
- County
- — inherits STATE
- City
- — inherits STATE
ZIP-level market 24370
- Home prices YoY
- 0.1%
- Active inventory
- 31
- Price-to-rent
- 6.3×
Monthly cashflow live
- Estimated rent
- $1,056 medium interval (Pro) →
- Mortgage (P&I)
- −$419
- Tax est. 1.5%
- −$100 /mo · $1,198/yr
- Insurance
- −$33
- HOA
- −$0
- Vacancy / Maint / Mgmt
- −$222
- Net cashflow
- $282
Break-even live
UW: 25.0% down · 7.5% · 30yr · 1.5% tax · 5.0% vac · 8.0% maint · 8.0% mgmt
Financing live
Cash to close
- Down payment
- $19,975
- Closing costs
- $2,397
- Reserves months
- —
- Total cash needed
- —
Loan-product check · same deal, 3 products live
Conventional
25% down · 7.5% · 30yr
- Down + closing
- —
- Monthly P&I
- —
- Monthly cashflow
- —
- DSCR
- —
- Eligible?
- —
Personal DTI + credit; lowest rate.
DSCR
20% down · 8.5% · 30yr
- Down + closing
- —
- Monthly P&I
- —
- Monthly cashflow
- —
- DSCR
- —
- Eligible?
- —
No personal income docs; deal must DSCR.
Hard money
10% down · 12.0% · 12mo
- Down + closing
- —
- Monthly P&I
- —
- Monthly cashflow
- —
- DSCR
- —
- Eligible?
- —
Short-term bridge; refi at stabilization.
Listing history 19 events
-
2026-06-18days on market $79,900 Active 101 DOM
-
2026-06-17days on market $79,900 Active 100 DOM
-
2026-06-16days on market $79,900 Active 99 DOM
-
2026-06-15days on market $79,900 Active 98 DOM
-
2026-06-15days on market $79,900 Active 97 DOM
-
2026-06-13days on market $79,900 Active 96 DOM
-
2026-06-12days on market $79,900 Active 95 DOM
-
2026-06-09days on market $79,900 Active 92 DOM
-
2026-06-08days on market $79,900 Active 91 DOM
-
2026-06-08days on market $79,900 Active 90 DOM
-
2026-06-07remarks 608-char remark
-
2026-06-07statusdays on market $79,900 Active 89 DOM
-
2026-06-03days on market $79,900 Active Under Contract 86 DOM
-
2026-06-02days on market $79,900 Active Under Contract 85 DOM
-
2026-06-01days on market $79,900 Active Under Contract 84 DOM
-
2026-05-31days on market $79,900 Active Under Contract 83 DOM
-
2026-03-25historical Active Under Contract
-
2026-03-09$79,900 Active
-
2021-04-27$41,900
ⓘ Source: listings_history table (triggers on properties + properties_extension) + one-shot
backfill from property_details.listing_events for pre-trigger history.
Climate risk First Street
- Flood 1/10 Low FEMA zone X (unshaded) · 0% chance over 30 yrs
- Wildfire 5/10 Major
- Heat 3/10 Moderate 9 d/yr ≥95°F today · 26 d/yr by 30 yrs out
- Wind 2/10 Low
- Air quality 1/10 Low 0 unhealthy d/yr today · 0 by 30 yrs out
Nearby sold comps map
Loading sold comps map…
Walkable amenities ~0.75 mi
Loading nearby amenities…
Taxation est. · year 1
- Rental income
- $12,668
- − Mortgage interest
- −$4,476
- − Property taxes
- −$1,198
- − Insurance
- −$400
- − Repairs & maintenance
- −$1,013
- − Management
- −$1,013
- − Depreciation
- −$2,324
- Taxable income
- $2,243
- Est. tax owed @ 24.0%
- −$538
- After-tax cash flow
- $2,843/yr
For passive investors: Depreciation is non-cash, so a rental often shows a tax loss while cash-flowing — sheltering income. Rental losses are passive: they offset passive income freely, and up to $25,000/yr can offset ordinary (W-2) income if you actively participate and your MAGI is under $100k (phasing out to $0 by $150k); unused losses carry forward. On sale, claimed depreciation is recaptured at up to 25%, and gains may owe capital-gains tax (a 1031 exchange can defer both). Figures are a year-1 estimate at your 24.0% rate — not tax advice; consult a CPA.
Schools (NCES district)
- District
- Smyth County Public School District
- NCES district ID
- 5103520
- Math proficiency
- 46% ▼ -38.00%
- Reading proficiency
- 63% ▼ -14.00%
- Median HH income
- $36,901
- Composite
- 45.2/100
- National rank
- #2672
- State rank
- #89 of 131 in VA
Livability — Saltville
- Score
- 72/100
- State rank
- #206
- US rank
- #6370
Category grades
Schools grade is shown separately in the Schools card above.
Census & demographics
- Population (ZIP)
- 5,740
Population outlook (Smyth County) Hauer SSP2
- Today (2025)
- 29,740 people
- By 2030
- 28,593 · -3.9%
- By 2040
- 26,091 · -12.3%
- By 2050
- 23,629 · -20.5%
- By 2075
- 18,365 · -38.2%
- By 2100
- 13,697 · -53.9%
Race, ethnicity, and origin ACS 2023
- Neighborhood character
- Predominantly White (98%)
- Race & ethnicity
- White 98% Hispanic / Latino 2%
- Common ancestry
- Serbian 2% Slovak 2% Italian 1%
- Foreign-born
- 1% · Canada
- Languages at home
- 99% English-only · Spanish 1%
Political lean MEDSL · Smyth
- 2024 margin
- Solid R (+60.5) · D 19.4% · R 79.9%
- 2008→2024 swing
- -31.4pp toward R · 2008: -29.1pp · 2024: -60.5pp
- All cycles
- 2024: R+60.5 2020: R+56.3 2016: R+55.2 2012: R+33.0 2008: R+29.1
Not yet ingested
- Civics
- —
Market trends
- HPI YoY
- ▲ 0.29%
- Current HPI
- 218.7537
- Rent YoY
- —
- Metro
- —
- State GDP YoY
- ▲ 2.40%
- F500 in state
- 50
Industry mix (Fortune 500 HQ in VA)
| Industry | F500 HQs | Revenue |
|---|---|---|
| Aerospace / Defense | 4 | $236B |
|
||
| Technology / Defense | 3 | $32B |
|
||
| Financial Services | 2 | $176B |
|
||
| Utilities | 2 | $27B |
|
||
| Insurance | 2 | $25B |
|
||
| Technology | 2 | $15B |
|
||
Price history
+90.7% since first listed3 events — show timeline
- 2026-03-25 Contingent — TVRMLS
- 2026-03-09 Listed $79,900 TVRMLS
- 2021-04-27 Listed $41,900 SWVAR
Cash-flow waterfall
monthlySold comps — $/sqft
last 12 mo · ≤1 miLoading sold comps…