 18-Plex
15430--15436 Meyer Rd · California City, CA
Flood risk 1/10 · Minimal
- FEMA flood zone
- X (unshaded)
- Chance of flooding over 30 yrs
- 0.0%
- Est. flood insurance / yr
- $507 – $1,088
Fire risk 4/10 · Minor
- Est. fire insurance / yr
- $659 – $1,223
Heat risk 7/10 · Major
- Hot days now (above 100°F)
- 8 days/yr
- Hot days in 30 yrs
- 23 days/yr
Wind risk 1/10 · Minimal
- Chance of severe wind over 30 yrs
- —
Air-quality risk 8/10 · Major
- Unhealthy air days now
- 17 days/yr
- Unhealthy air days in 30 yrs
- 19 days/yr
Risk factors via First Street. Map © Google.
Why this score? — see what drove the B grade
The composite is a weighted blend of 9 inputs, each scored 0–100. Each bar is that input's sub-score; the figure is the points it added to the 100-point composite (weight × sub-score).
- Cash flow +29.9/30.0
- DSCR +10.0/10.0
- 1% rule +8.1/10.0
- ARV discount +7.5/15.0
- Appreciation +5.7/10.0
- Rent growth +2.5/5.0
- Condition / age +2.5/5.0
- Livability +2.2/5.0
- Schools +2.1/10.0
$1,950,000
🖨 Deal sheet 📄 Offer letter ✓ Due diligence
Multi-family units
County records classify this as Multi-Family (5+ Unit). Listing-text estimate: 18 units. confirmed
5+ unit building — per-unit beds/baths from public records are typically unavailable; the breakdown below (if shown) is an estimate from the listing text.
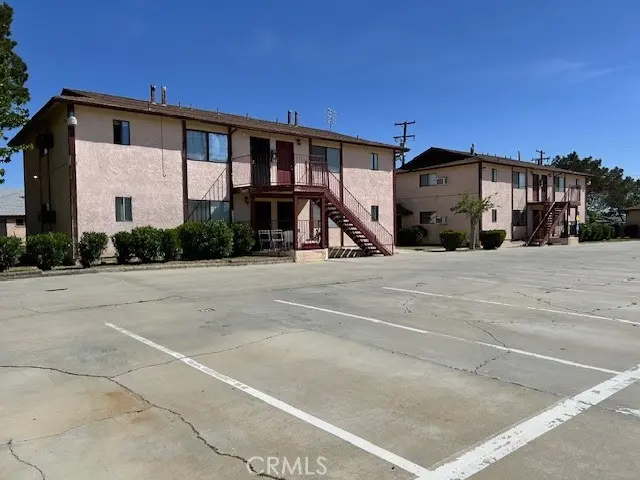
Listing remarks MLS
This well-maintained 18-unit multifamily property presents an exceptional investment opportunity with strong income potential and long-term upside. The property features a diverse unit mix complemented by additional on-site storage units, offering multiple revenue streams for investors. The expansive parking area provides ample space for tenants and guests, enhancing convenience and overall tenant satisfaction. Whether you're looking to expand your portfolio or secure a turnkey investment, this property delivers a compelling combination of functionality, income potential, and future growth.
Key facts
- 1.03 acre lot
- 18 parking spots
- Built 1981
Neighborhood map
What this means for you Summary
Snapshot
- This is a 18 × 26-bed/18.0-bath units multifamily listed at $1.95M.
Deal economics
- At list price, monthly cash flow is $7k ($87k/yr) — positive. Per door: $403/mo.
- The deal already cash-flows at list — no discount required.
- Meets the 1% rule at list price ($25k rent vs $1.95M).
- Recommended offer: $1.83M (6.0% below list) — sets the bar for market timing.
- Cap rate 10.8% vs local median 5.2% in California City — top-decile yield for the area; either an underpriced asset or a hidden risk that comps aren't pricing in. Stress-test before assuming the spread holds.
Location & tenants
- Location reads 44/100 on livability (#1,329 in CA) — a working-class tenant base; expect higher turnover. Strengths: housing A+; Watch: schools F, crime F, amenities F.
- Mojave Unified (town): math 25% / reading 25% proficiency, ranked #411 of 517 in CA (top 80%) — low school quality limits family demand, transient renter base, plan for 1-2y turnover; 76% free/reduced lunch — lower-income household profile, screen leases tightly.
- Market conditions: 278 active listings in the ZIP; 3,244 units permitted in Kern County in 2024 (73 in 5+ unit buildings).
Forward outlook
- In year one you build about $39k of equity ($13k loan paydown + $26k appreciation (1.3% local appreciation)).
- Kern County population projected at +17% by 2050 — long-run rental-demand tailwind backs the buy-and-hold thesis.
- At projected returns (1.3% appreciation + 3.0% rent growth), your $546k cash investment doubles in ~4 years — after that, you're playing with house money.
- By year 4, paydown + projected appreciation supports a ~$140k cash-out refi (75% LTV) — recoverable capital for the next deal without selling this one.
Negotiation context
- It's been on market 69 days — a 6% lower offer ($1.83M) is reasonable based on typical stale-listing flexibility.
- 5 sale attempts since 15y ago with the ask held roughly flat each time — persistent listings suggest the price (not the market) is what's stuck; bring a comps-based counter.
- Current owner paid $1.65M; 18% above their basis — modest negotiation headroom, anchor on the comps not their cost.
Risks & watch-outs
- Climate carrying-cost: extreme-heat days projected 8→23/yr by 2055 (HVAC capex compounding) — expect insurance premiums to compound above CPI over the hold.
Questions for the listing agent
- It's been on market 69 days. Have you received any prior offers? Is the seller open to a 6% concession, seller financing, or rate buy-down credit?
- Can we see the unit-by-unit rent roll, current vacancy, and any below-market leases? What's the average tenancy length?
- What capital expenditures (roof, boiler, parking lot, exteriors) have been made in the last 5 years, and what's planned in the next 2?
- Why hasn't it sold? Are there any deal-killer items the seller is aware of (foundation, flood, title, zoning, code violations)?
- Is there a deadline driving the sale (1031 exchange, divorce, estate, relocation)? That informs how much negotiation room exists.
- Schools are F-rated, which usually means shorter tenancies and higher turnover. Who's the typical renter profile here, and what's been the actual vacancy rate?
- Crime grade is F in this area — have there been break-ins, vandalism, or insurance claims at this property in the last 3 years? What carrier currently insures it and at what premium?
- What's the average days-on-market for RENTAL listings here right now (not sales)? A rising rental-DOM trend means longer vacancies and softer asking-rent achievability than the comps imply.
- What's the recent tenant-quality profile in this submarket — average credit score on applications, eviction rate, late-payment / NSF rate, and stable-employment percentage? A property-management company in the area should have these aggregated.
- How much new apartment / multifamily construction is in the pipeline within 1–3 miles? Heavy new supply (>2% of stock underway) typically softens rents 12–24 months out; light construction supports rent growth.
Investment metrics
- 1% rule
- 1.31% ✓
- Cap rate
- 10.75%
- Cash-on-cash
- 15.93%
- DSCR
- 1.71
- GRM
- 6.4
CMA / ARV
No comps found within radius.
Projected returns pro-forma
1.33% appreciation · 3.0% rent growth · sell at horizon
- IRR
- 18.7%
- Equity multiple
- 1.97×
- Total profit
- $529,377
- Equity at exit
- $698,969
- IRR
- 21.5%
- Equity multiple
- 3.68×
- Total profit
- $1,460,659
- Equity at exit
- $955,159
Cash invested: $546,000 (down + closing). Projections, not guarantees.
Landlord ↔ Tenant lean methodology
- Overall (STATE)
- 18 Strongly Tenant-Friendly
- State California
- 18 Strongly Tenant-Friendly · D+13
- County
- — inherits STATE
- City
- — inherits STATE
ZIP-level market 93501
- Home prices YoY
- 0.2%
- Active inventory
- 278
- Price-to-rent
- 114.9×
Monthly cashflow live
- Estimated rent
- $25,466 medium interval (Pro) →
- Mortgage (P&I)
- −$10,226
- Tax from tax record
- −$1,832 /mo · $21,980/yr
- Insurance
- −$812
- HOA
- −$0
- Vacancy / Maint / Mgmt
- −$5,348
- Net cashflow
- $7,248
Break-even live
18-unit breakdown (identical units grouped — click to expand)
| Units | Beds | Baths | Est. rent |
|---|---|---|---|
| 18× units | 26 | 18 | $25,470 |
| #1 | 26 | 18 | $1,415 |
| #2 | 26 | 18 | $1,415 |
| #3 | 26 | 18 | $1,415 |
| #4 | 26 | 18 | $1,415 |
| #5 | 26 | 18 | $1,415 |
| #6 | 26 | 18 | $1,415 |
| #7 | 26 | 18 | $1,415 |
| #8 | 26 | 18 | $1,415 |
| #9 | 26 | 18 | $1,415 |
| #10 | 26 | 18 | $1,415 |
| #11 | 26 | 18 | $1,415 |
| #12 | 26 | 18 | $1,415 |
| #13 | 26 | 18 | $1,415 |
| #14 | 26 | 18 | $1,415 |
| #15 | 26 | 18 | $1,415 |
| #16 | 26 | 18 | $1,415 |
| #17 | 26 | 18 | $1,415 |
| #18 | 26 | 18 | $1,415 |
| Total (18 units) | $25,466 | ||
UW: 25.0% down · 7.5% · 30yr · 1.5% tax · 5.0% vac · 8.0% maint · 8.0% mgmt
Financing live
Cash to close
- Down payment
- $487,500
- Closing costs
- $58,500
- Reserves months
- —
- Total cash needed
- —
Loan-product check · same deal, 3 products live
Conventional
25% down · 7.5% · 30yr
- Down + closing
- —
- Monthly P&I
- —
- Monthly cashflow
- —
- DSCR
- —
- Eligible?
- —
Personal DTI + credit; lowest rate.
DSCR
20% down · 8.5% · 30yr
- Down + closing
- —
- Monthly P&I
- —
- Monthly cashflow
- —
- DSCR
- —
- Eligible?
- —
No personal income docs; deal must DSCR.
Hard money
10% down · 12.0% · 12mo
- Down + closing
- —
- Monthly P&I
- —
- Monthly cashflow
- —
- DSCR
- —
- Eligible?
- —
Short-term bridge; refi at stabilization.
Listing history 25 events
-
2026-06-18days on market $1,950,000 Active 69 DOM
-
2026-06-17days on market $1,950,000 Active 68 DOM
-
2026-06-16days on market $1,950,000 Active 67 DOM
-
2026-06-15days on market $1,950,000 Active 66 DOM
-
2026-06-14days on market $1,950,000 Active 64 DOM
-
2026-06-13days on market $1,950,000 Active 63 DOM
-
2026-06-10days on market $1,950,000 Active 61 DOM
-
2026-06-09days on market $1,950,000 Active 60 DOM
-
2026-06-08days on market $1,950,000 Active 59 DOM
-
2026-06-07days on market $1,950,000 Active 58 DOM
-
2026-06-05days on market $1,950,000 Active 55 DOM
-
2026-06-03days on market $1,950,000 Active 54 DOM
-
2026-06-03days on market $1,950,000 Active 53 DOM
-
2026-06-01days on market $1,950,000 Active 52 DOM
-
2026-05-31days on market $1,950,000 Active 51 DOM
-
2026-04-11$1,950,000 Active 597-char remark
Show marketing remark (597 chars)
This well-maintained 18-unit multifamily property presents an exceptional investment opportunity with strong income potential and long-term upside. The property features a diverse unit mix complemented by additional on-site storage units, offering multiple revenue streams for investors. The expansive parking area provides ample space for tenants and guests, enhancing convenience and overall tenant satisfaction. Whether you're looking to expand your portfolio or secure a turnkey investment, this property delivers a compelling combination of functionality, income potential, and future growth.
-
2026-04-10$1,950,000 Active 601-char remark
Show marketing remark (601 chars)
This well-maintained 18-unit multifamily property presents an exceptional investment opportunity with strong income potential and long-term upside. The property features a diverse unit mix complemented by additional on-site storage units, offering multiple revenue streams for investors. The expansive parking area provides ample space for tenants and guests, enhancing convenience and overall tenant satisfaction. Whether you're looking to expand your portfolio or secure a turnkey investment, this property delivers a compelling combination of functionality, income potential, and future growth.
-
2022-04-05soldstatus $1,650,000
-
2015-04-03historical
-
2015-03-17historical
-
2013-08-05$559,000
-
2013-05-07$689,000
-
2012-06-04historical
-
2011-11-02$299,900
-
2004-02-02soldstatus $490,000
ⓘ Source: listings_history table (triggers on properties + properties_extension) + one-shot
backfill from property_details.listing_events for pre-trigger history.
Tax reassessment forecast CA · Resets to sale price
- Current annual tax
- $21,980 · $1,832/mo
- Projected year-2 tax
- $21,980 · $1,832/mo
- Expected delta
- $0/yr ($0/mo · 0.0%)
ⓘ Screening estimate from a state-policy table — verify with the county assessor before closing.
Climate risk First Street
- Flood 1/10 Low FEMA zone X (unshaded) · 0% chance over 30 yrs
- Wildfire 4/10 Moderate
- Heat 7/10 Severe 8 d/yr ≥100°F today · 23 d/yr by 30 yrs out
- Wind 1/10 Low
- Air quality 8/10 Severe 17 unhealthy d/yr today · 19 by 30 yrs out
Nearby sold comps map
Loading sold comps map…
Walkable amenities ~0.75 mi
Loading nearby amenities…
Taxation est. · year 1
- Rental income
- $305,592
- − Mortgage interest
- −$109,230
- − Property taxes
- −$21,980
- − Insurance
- −$9,750
- − Repairs & maintenance
- −$24,447
- − Management
- −$24,447
- − Depreciation
- −$56,727
- Taxable income
- $59,009
- Est. tax owed @ 24.0%
- −$14,162
- After-tax cash flow
- $72,813/yr
For passive investors: Depreciation is non-cash, so a rental often shows a tax loss while cash-flowing — sheltering income. Rental losses are passive: they offset passive income freely, and up to $25,000/yr can offset ordinary (W-2) income if you actively participate and your MAGI is under $100k (phasing out to $0 by $150k); unused losses carry forward. On sale, claimed depreciation is recaptured at up to 25%, and gains may owe capital-gains tax (a 1031 exchange can defer both). Figures are a year-1 estimate at your 24.0% rate — not tax advice; consult a CPA.
Schools (NCES district)
- District
- Mojave Unified
- NCES district ID
- 0625230
- Math proficiency
- 25% ▲ 11.00%
- Reading proficiency
- 25% ▼ -1.00%
- Median HH income
- $43,017
- Composite
- 21.4/100
- National rank
- #8350
- State rank
- #411 of 517 in CA
Livability — California City
- Score
- 44/100
- State rank
- #1329
- US rank
- #26753
Category grades
Schools grade is shown separately in the Schools card above.
Census & demographics
- Census place
- California City, CA
- City population
- 14,353
- Population (ZIP)
- 5,944
Population outlook (Kern County) Hauer SSP2
- Today (2025)
- 947,286 people
- By 2030
- 978,984 · +3.3%
- By 2040
- 1,045,018 · +10.3%
- By 2050
- 1,105,232 · +16.7%
- By 2075
- 1,229,538 · +29.8%
- By 2100
- 1,238,059 · +30.7%
Race, ethnicity, and origin ACS 2023
- Neighborhood character
- Diverse neighborhood (Simpson 0.66)
- Race & ethnicity
- Hispanic / Latino 47% White 26% Black 21% Two or more races 18% Asian 1%
- Hispanic origin (detail)
- Mexican 41%
- Common ancestry
- Slovak 4% Lithuanian 2% Serbian 1%
- Foreign-born
- 13% · Canada, Vietnam
- Languages at home
- 70% English-only · Spanish 28%
Political lean MEDSL · Kern
- 2024 margin
- Strong R (+21.1) · D 38.2% · R 59.3% · Other 2.5%
- 2008→2024 swing
- -3.3pp toward R · 2008: -17.8pp · 2024: -21.1pp
- All cycles
- 2024: R+21.1 2020: R+10.2 2016: R+15.0 2012: R+20.9 2008: R+17.8
Not yet ingested
- Civics
- —
Market trends
- HPI YoY
- ▲ 1.33%
- Current HPI
- 595.661
- Rent YoY
- —
- Metro
- —
- State GDP YoY
- ▲ 3.21%
- F500 in state
- 116
Industry mix (Fortune 500 HQ in CA)
| Industry | F500 HQs | Revenue |
|---|---|---|
| Technology | 27 | $1,492B |
|
||
| Financial Services | 3 | $174B |
|
||
| Retail | 3 | $44B |
|
||
| Insurance | 3 | $26B |
|
||
| Media / Entertainment | 2 | $115B |
|
||
| Pharmaceuticals / Biotech | 2 | $62B |
|
||
Price history
+298.0% since first listed10 events — show timeline
- 2026-04-11 Listed $1,950,000 GEMLS
- 2026-04-10 Listed $1,950,000 CRMLS
- 2022-04-05 Sold (Public Records) $1,650,000 Public Records
- 2015-04-03 Listing Removed — AVMLS
- 2015-03-17 Listing Removed — AVMLS
- 2013-08-05 Listed $559,000 AVMLS
- 2013-05-07 Listed $689,000 AVMLS
- 2012-06-04 Listing Removed — AVMLS
- 2011-11-02 Listed $299,900 AVMLS
- 2004-02-02 Sold (Public Records) $490,000 Public Records
Property tax history
+16.4%/yrLatest (2025): $21,980 · +1.1% YoY. Source: county tax records.
Cash-flow waterfall
monthlySold comps — $/sqft
last 12 mo · ≤1 miLoading sold comps…