 Fourplex
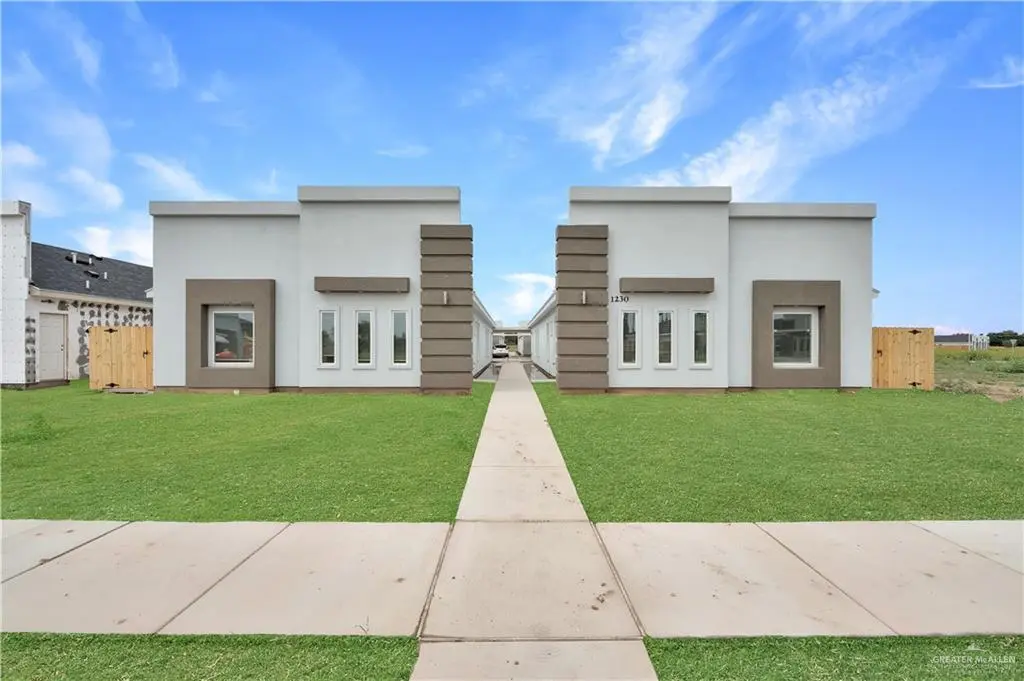
1230 Valle Vista St · North Alamo, TX
Flood risk 1/10 · Minimal
- FEMA flood zone
- —
- Chance of flooding over 30 yrs
- 0.0%
- Est. flood insurance / yr
- —
Fire risk 8/10 · Major
- Est. fire insurance / yr
- $1,222 – $2,270
Heat risk 9/10 · Severe
- Hot days now (above 111°F)
- 7 days/yr
- Hot days in 30 yrs
- 23 days/yr
Wind risk 8/10 · Major
- Chance of severe wind over 30 yrs
- 99.0%
Air-quality risk 1/10 · Minimal
- Unhealthy air days now
- 0 days/yr
- Unhealthy air days in 30 yrs
- 0 days/yr
Risk factors via First Street. Map © Google.
Why this score? — see what drove the C- grade
The composite is a weighted blend of 9 inputs, each scored 0–100. Each bar is that input's sub-score; the figure is the points it added to the 100-point composite (weight × sub-score).
- Cash flow +18.1/30.0
- ARV discount +8.7/15.0
- DSCR +5.7/10.0
- 1% rule +5.0/10.0
- Condition / age +5.0/5.0
- Livability +3.1/5.0
- Rent growth +2.5/5.0
- Schools +2.0/10.0
- Appreciation +0.0/10.0
$490,000
🖨 Deal sheet 📄 Offer letter ✓ Due diligence
Multi-family units
County records classify this as Multi-Family (2-4 Unit). Listing-text estimate: 4 units. confirmed
Listing remarks MLS
Incredible investment opportunity in Alamo, TX! This brand new incomplete construction 4-Plex is perfectly located just minutes from the expressway, offering convenience, modern design, and strong rental potential. The building features a total of four units: two 3-bedroom, 2-bathroom units and two 2-bedroom, 2-bathroom units — all thoughtfully designed for comfortable living. Each unit offers a bright open-concept layout with modern finishes, including granite countertops, custom cabinetry, stainless steel appliances, and wood-look tile flooring throughout. Decorative tray ceilings, stylish lighting, and spacious floor plans create a high-end living experience. Don’t miss this opportunity to own a newly built income-producing property in a growing area. Schedule a tour today!
Key facts
- Custom cabinetry
- Modern finishes
- Granite countertops
Tags
Neighborhood map
What this means for you Summary
Snapshot
- This is a 2×3bd/2ba + 2×2bd/2ba units multifamily listed at $490k. Condition is rated excellent.
Deal economics
- At list price, monthly cash flow is $429 ($5k/yr) — positive. Per door: $107/mo.
- The deal already cash-flows at list — no discount required.
- To meet the 1% rule (rent ≥ 1% of price), the offer needs to be $489k (0.1% below list).
- Recommended offer: $431k (12.0% below list) — sets the bar for market timing.
Location & tenants
- Location reads 62/100 on livability (#941 in TX) — a middle-class / working-renter tenant base. Strengths: cost of living A+, housing A+; Watch: employment C-, schools F, amenities F.
- Pharr-San Juan-Alamo ISD (suburban): math 18% / reading 30% proficiency, ranked #740 of 826 in TX (top 90%) — low school quality limits family demand, transient renter base, plan for 1-2y turnover; 72% free/reduced lunch — lower-income household profile, screen leases tightly.
- Market conditions: 362 active listings in the ZIP; 2 comparable units currently listed for rent nearby; 7,378 units permitted in Hidalgo County in 2024 (641 in 5+ unit buildings).
Forward outlook
- Local home prices are declining (-3.0%/yr); year-one equity from $3k of loan paydown is wiped out by about $15k of value loss. Plan a longer hold.
- Hidalgo County population projected at +28% by 2050 — long-run rental-demand tailwind backs the buy-and-hold thesis.
Negotiation context
- It's been on market 287 days — a 12% lower offer ($431k) is reasonable based on typical stale-listing flexibility.
- 3 sale attempts with the ask held roughly flat each time — persistent listings suggest the price (not the market) is what's stuck; bring a comps-based counter.
Risks & watch-outs
- Climate carrying-cost: severe wind risk, 99% chance of damaging wind over 30y; severe wildfire risk; extreme-heat days projected 7→23/yr by 2055 (HVAC capex compounding) — expect insurance premiums to compound above CPI over the hold.
Questions for the listing agent
- It's been on market 287 days. Have you received any prior offers? Is the seller open to a 12% concession, seller financing, or rate buy-down credit?
- Can we see the unit-by-unit rent roll, current vacancy, and any below-market leases? What's the average tenancy length?
- What capital expenditures (roof, boiler, parking lot, exteriors) have been made in the last 5 years, and what's planned in the next 2?
- What does the HOA fee cover, when was the last increase, and are there any pending special assessments or reserve-fund shortfalls?
- Why hasn't it sold? Are there any deal-killer items the seller is aware of (foundation, flood, title, zoning, code violations)?
- Is there a deadline driving the sale (1031 exchange, divorce, estate, relocation)? That informs how much negotiation room exists.
- Schools are F-rated, which usually means shorter tenancies and higher turnover. Who's the typical renter profile here, and what's been the actual vacancy rate?
- What's the average days-on-market for RENTAL listings here right now (not sales)? A rising rental-DOM trend means longer vacancies and softer asking-rent achievability than the comps imply.
- What's the recent tenant-quality profile in this submarket — average credit score on applications, eviction rate, late-payment / NSF rate, and stable-employment percentage? A property-management company in the area should have these aggregated.
- How much new apartment / multifamily construction is in the pipeline within 1–3 miles? Heavy new supply (>2% of stock underway) typically softens rents 12–24 months out; light construction supports rent growth.
Investment metrics
- 1% rule
- 1.00% ✗
- Cap rate
- 7.34%
- Cash-on-cash
- 3.75%
- DSCR
- 1.17
- GRM
- 8.3
CMA / ARV
- ARV (median comp)
- $503,866
- List price
- $490,000
- Delta
- -2.75%
- Verdict
- FAIR
- Comps
- 8 within 1.0 mi
Show comp detail 5 sales within ~0.75 mi
| Address | Dist | Beds/Ba | Sqft | Sold | Price | $/sf | Match |
|---|---|---|---|---|---|---|---|
| 1309 Valle Vista St | 0.04mi | —/— | 4,200 (+5%) | 18mo | $520,000 | $124 | 74 |
| 1225 Valle Vista St | 0.05mi | —/— | 4,200 (+5%) | 18mo | $520,000 | $124 | 74 |
| 1305 Valle Vista St | 0.04mi | —/— | 4,200 (+5%) | 18mo | $520,000 | $124 | 74 |
| 905 Deluxe St | 0.67mi | —/— | 3,776 (-5%) | 6mo | $485,000 | $128 | 55 |
| 844 Deluxe St | 0.67mi | —/— | 3,746 (-6%) | 13mo | $490,000 | $131 | 48 |
Match score weights: distance 35% · size 25% · config 20% · recency 20%. Top-matched comps best support the ARV.
Projected returns pro-forma
-3.0% appreciation · 3.0% rent growth · sell at horizon
- IRR
- -10.4%
- Equity multiple
- 0.62×
- Total profit
- $-51,961
- Equity at exit
- $73,061
- IRR
- -1.0%
- Equity multiple
- 0.93×
- Total profit
- $-9,623
- Equity at exit
- $42,366
Cash invested: $137,200 (down + closing). Projections, not guarantees.
Landlord ↔ Tenant lean methodology
- Overall (STATE)
- 87 Strongly Landlord-Friendly
- State Texas
- 87 Strongly Landlord-Friendly · R+5
- County
- — inherits STATE
- City
- — inherits STATE
ZIP-level market 78589
- Home prices YoY
- -12.1%
- Active inventory
- 362
- Price-to-rent
- 33.4×
Monthly cashflow live
- Estimated rent
- $4,893 high interval (Pro) →
- Mortgage (P&I)
- −$2,570
- Tax est. 1.5%
- −$612 /mo · $7,350/yr
- Insurance
- −$204
- HOA
- −$50
- Vacancy / Maint / Mgmt
- −$1,028
- Net cashflow
- $429
Break-even live
4-unit breakdown (identical units grouped — click to expand)
| Units | Beds | Baths | Est. rent |
|---|---|---|---|
| 2× units | 3 | 2 | $2,446 |
| #1 | 3 | 2 | $1,223 |
| #2 | 3 | 2 | $1,223 |
| 2× units | 2 | 2 | $2,446 |
| #3 | 2 | 2 | $1,223 |
| #4 | 2 | 2 | $1,223 |
| Total (4 units) | $4,893 | ||
UW: 25.0% down · 7.5% · 30yr · 1.5% tax · 5.0% vac · 8.0% maint · 8.0% mgmt
Financing live
Cash to close
- Down payment
- $122,500
- Closing costs
- $14,700
- Reserves months
- —
- Total cash needed
- —
Loan-product check · same deal, 3 products live
Conventional
25% down · 7.5% · 30yr
- Down + closing
- —
- Monthly P&I
- —
- Monthly cashflow
- —
- DSCR
- —
- Eligible?
- —
Personal DTI + credit; lowest rate.
DSCR
20% down · 8.5% · 30yr
- Down + closing
- —
- Monthly P&I
- —
- Monthly cashflow
- —
- DSCR
- —
- Eligible?
- —
No personal income docs; deal must DSCR.
Hard money
10% down · 12.0% · 12mo
- Down + closing
- —
- Monthly P&I
- —
- Monthly cashflow
- —
- DSCR
- —
- Eligible?
- —
Short-term bridge; refi at stabilization.
Rent comps 2 comps
| Address | Beds | Baths | Sqft | Rent | $/sqft | DOM | Units | Dist |
|---|---|---|---|---|---|---|---|---|
| 209 Rafael Dr Unit 2 San Juan, TX | 3.0 | 2.0 | 4212 | $1,250 | $0.30 | 43d | 1 | 1.45mi |
| 209 Rafael Dr Unit 4 San Juan, TX | 2.0 | 2.0 | 4212 | $1,150 | $0.27 | 43d | 1 | 1.45mi |
HOA detail
- Monthly dues
- $50 · $600/yr
Listing history 18 events
-
2026-06-18days on market $490,000 Active 287 DOM
-
2026-06-17days on market $490,000 Active 286 DOM
-
2026-06-16days on market $490,000 Active 285 DOM
-
2026-06-15days on market $490,000 Active 284 DOM
-
2026-06-14days on market $490,000 Active 282 DOM
-
2026-06-13days on market $490,000 Active 281 DOM
-
2026-06-10days on market $490,000 Active 279 DOM
-
2026-06-09days on market $490,000 Active 278 DOM
-
2026-06-08days on market $490,000 Active 277 DOM
-
2026-06-07days on market $490,000 Active 276 DOM
-
2026-06-03days on market $490,000 Active 272 DOM
-
2026-06-02days on market $490,000 Active 271 DOM
-
2026-06-01days on market $490,000 Active 270 DOM
-
2026-05-31days on market $490,000 Active 269 DOM
-
2026-05-31days on market $490,000 Active 268 DOM
-
2025-09-04$490,000 Active 799-char remark
Show marketing remark (799 chars)
Incredible investment opportunity in Alamo, TX! This brand new incomplete construction 4-Plex is perfectly located just minutes from the expressway, offering convenience, modern design, and strong rental potential. The building features a total of four units: two 3-bedroom, 2-bathroom units and two 2-bedroom, 2-bathroom units — all thoughtfully designed for comfortable living. Each unit offers a bright open-concept layout with modern finishes, including granite countertops, custom cabinetry, stainless steel appliances, and wood-look tile flooring throughout. Decorative tray ceilings, stylish lighting, and spacious floor plans create a high-end living experience. Don’t miss this opportunity to own a newly built income-producing property in a growing area. Schedule a tour today!
-
2025-06-24$490,000 Active
-
2025-04-22$490,000 Active
ⓘ Source: listings_history table (triggers on properties + properties_extension) + one-shot
backfill from property_details.listing_events for pre-trigger history.
Climate risk First Street
- Flood 1/10 Low 0% chance over 30 yrs
- Wildfire 8/10 Severe
- Heat 9/10 Extreme 7 d/yr ≥111°F today · 23 d/yr by 30 yrs out
- Wind 8/10 Severe 99% chance of damaging wind over 30 yrs
- Air quality 1/10 Low 0 unhealthy d/yr today · 0 by 30 yrs out
Nearby sold comps map
Loading sold comps map…
Walkable amenities ~0.75 mi
Loading nearby amenities…
Taxation est. · year 1
- Rental income
- $58,716
- − Mortgage interest
- −$27,448
- − Property taxes
- −$7,350
- − Insurance
- −$2,450
- − Repairs & maintenance
- −$4,697
- − Management
- −$4,697
- − HOA
- −$600
- − Depreciation
- −$14,255
- Taxable loss
- −$2,781
- Est. tax savings @ 24.0%
- +$667
- After-tax cash flow
- $5,818/yr
For passive investors: Depreciation is non-cash, so a rental often shows a tax loss while cash-flowing — sheltering income. Rental losses are passive: they offset passive income freely, and up to $25,000/yr can offset ordinary (W-2) income if you actively participate and your MAGI is under $100k (phasing out to $0 by $150k); unused losses carry forward. On sale, claimed depreciation is recaptured at up to 25%, and gains may owe capital-gains tax (a 1031 exchange can defer both). Figures are a year-1 estimate at your 24.0% rate — not tax advice; consult a CPA.
Condition & rehab AI · 12 photos
This brand new 4-unit multi-family property is move-in ready with modern finishes and a high-end living experience. It offers a great investment opportunity with strong rental potential.
Value-add opportunities
- Both Landscaping and curb appeal improvements — Enhances the home's curb appeal and can attract more potential buyers or renters.
- Both Add a smart home system — Improves convenience and can be a selling point for potential buyers or renters.
- Both Install smart locks — Enhances security and can be a selling point for potential buyers or renters.
- Both Add a smart thermostat — Improves energy efficiency and can be a selling point for potential buyers or renters.
Renovation cost estimate screening
Value-add ROI direction
- Both Landscaping and curb appeal improvements — Enhances the home's curb appeal and can attract more potential buyers or renters. ↑
- Both Add a smart home system — Improves convenience and can be a selling point for potential buyers or renters. ↑
- Both Install smart locks — Enhances security and can be a selling point for potential buyers or renters. ↑
- Both Add a smart thermostat — Improves energy efficiency and can be a selling point for potential buyers or renters. ↑
ⓘ Cost ranges are severity-bucket heuristics (US national rule-of-thumb). Get contractor quotes + a written scope before underwriting a rehab budget.
Schools (NCES district)
- District
- Pharr-San Juan-Alamo ISD
- NCES district ID
- 4834860
- Math proficiency
- 18% ▼ -34.00%
- Reading proficiency
- 30% ▼ -11.00%
- Median HH income
- $33,757
- Composite
- 19.63/100
- National rank
- #8744
- State rank
- #740 of 826 in TX
Livability — North Alamo
- Score
- 62/100
- State rank
- #941
- US rank
- #16730
Category grades
Schools grade is shown separately in the Schools card above.
Census & demographics
- Census place
- North Alamo, TX
- Population (ZIP)
- 39,958
Population outlook (Hidalgo County) Hauer SSP2
- Today (2025)
- 955,232 people
- By 2030
- 1,009,774 · +5.7%
- By 2040
- 1,120,332 · +17.3%
- By 2050
- 1,225,036 · +28.2%
- By 2075
- 1,439,189 · +50.7%
- By 2100
- 1,533,429 · +60.5%
Race, ethnicity, and origin ACS 2023
- Neighborhood character
- Predominantly Hispanic (97%)
- Race & ethnicity
- Hispanic / Latino 97% Two or more races 43% White 3%
- Hispanic origin (detail)
- Mexican 94%
- Foreign-born
- 26% · Canada
- Languages at home
- 18% English-only · Spanish 82%
Political lean MEDSL · Hidalgo
- 2024 margin
- Toss-up / Even · D 48.1% · R 51.0%
- 2008→2024 swing
- -41.6pp toward R · 2008: 38.7pp · 2024: -2.9pp
- All cycles
- 2024: R+2.9 2020: D+17.1 2016: D+40.5 2012: D+41.8 2008: D+38.7
Not yet ingested
- Civics
- —
Market trends
- HPI YoY
- ▼ -32.82%
- Current HPI
- 239.3829
- Rent YoY
- —
- Metro
- —
- State GDP YoY
- ▲ 3.95%
- F500 in state
- 110
Industry mix (Fortune 500 HQ in TX)
| Industry | F500 HQs | Revenue |
|---|---|---|
| Energy | 16 | $1,198B |
|
||
| Technology | 5 | $198B |
|
||
| Engineering / Construction | 4 | $72B |
|
||
| Energy Services | 3 | $60B |
|
||
| Utilities | 3 | $41B |
|
||
| Healthcare | 2 | $330B |
|
||
Price history
+0.0% since first listed3 events — show timeline
- 2025-09-04 Listed $490,000 MCALLENMLS
- 2025-06-24 Listed $490,000 MCALLENMLS
- 2025-04-22 Listed $490,000 MCALLENMLS
Cash-flow waterfall
monthlySold comps — $/sqft
last 12 mo · ≤1 miLoading sold comps…