57 NW Hemlock Dr · Fort Walton Beach, FL
Flood risk 1/10 · Minimal
- FEMA flood zone
- X (unshaded)
- Chance of flooding over 30 yrs
- 0.0%
- Est. flood insurance / yr
- $507 – $1,088
Fire risk 1/10 · Minimal
- Est. fire insurance / yr
- $947 – $1,759
Heat risk 10/10 · Severe
- Hot days now (above 104°F)
- 7 days/yr
- Hot days in 30 yrs
- 22 days/yr
Wind risk 9/10 · Severe
- Chance of severe wind over 30 yrs
- 99.0%
Air-quality risk 2/10 · Minimal
- Unhealthy air days now
- 1 days/yr
- Unhealthy air days in 30 yrs
- 2 days/yr
Risk factors via First Street. Map © Google.
Why this score? — see what drove the D grade
The composite is a weighted blend of 9 inputs, each scored 0–100. Each bar is that input's sub-score; the figure is the points it added to the 100-point composite (weight × sub-score).
- ARV discount +14.7/15.0
- Cash flow +9.6/30.0
- Schools +5.2/10.0
- Livability +4.0/5.0
- Rent growth +2.8/5.0
- DSCR +2.7/10.0
- Condition / age +2.5/5.0
- 1% rule +2.3/10.0
- Appreciation +0.0/10.0
$305,000
🖨 Deal sheet 📄 Offer letter ✓ Due diligence
Listing remarks MLS
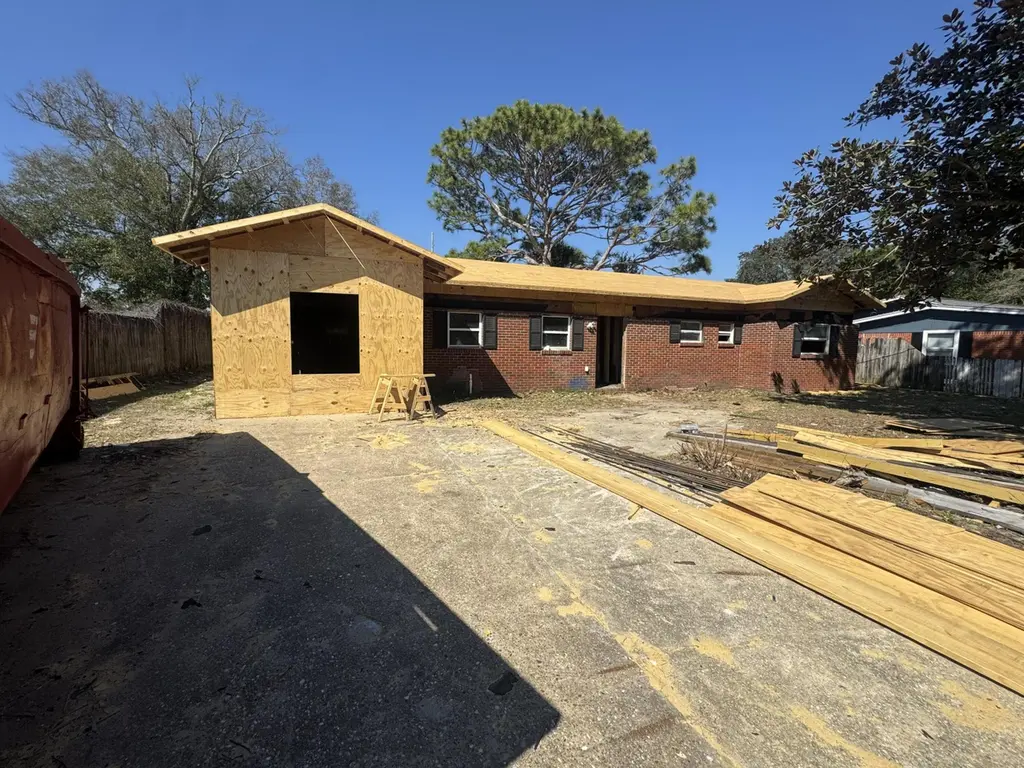
Partially Completed Home with Expanded Master Suite
Key facts
- 9,583 sq ft lot
- Built 1961
- Listed 61 days
Tags
Neighborhood map
What this means for you Summary
Snapshot
- This is a 4-bed/3.0-bath single-family listed at $305k.
Deal economics
- At list price, monthly cash flow is $-205 ($-2k/yr) — negative.
- To cash-flow at today's rent, offer at most $269k (11.9% below list).
- To meet the 1% rule (rent ≥ 1% of price), the offer needs to be $224k (26.6% below list).
- Recommended offer: $224k (26.6% below list) — sets the bar for 1% rule.
- Cap rate 5.5% vs local median 0.9% in Fort Walton Beach — top-decile yield for the area; either an underpriced asset or a hidden risk that comps aren't pricing in. Stress-test before assuming the spread holds.
Location & tenants
- Location reads 80/100 on livability (#111 in FL, #1,628 nationally) — a professional / high-income tenant draw. Strengths: commute A+, housing A+, health & safety A+; Watch: schools C-, amenities F.
- Okaloosa (other): math 60% / reading 60% proficiency, ranked #12 of 73 in FL (top 16%) — acceptable for families but not a draw, mixed tenant base, ~2y average lease.
- Market conditions: Rents rising (+1.3%/yr); 341 active listings in the ZIP; 10 comparable units currently listed for rent nearby; rentals at typical pace (median 22d on market — plan ~3-4 weeks tenant-placement turnaround); 40% of comp listings sitting > 30 days — soft ceiling on asking rent; 1,268 units permitted in Okaloosa County in 2024 (175 in 5+ unit buildings).
- This rent runs 41% of the median local income ($65k/yr) — at the standard rent-burdened threshold; future hikes will face affordability resistance.
Forward outlook
- Local home prices are declining (-3.0%/yr); year-one equity from $2k of loan paydown is wiped out by about $9k of value loss. Plan a longer hold.
- Okaloosa County population projected at +37% by 2050 — long-run rental-demand tailwind backs the buy-and-hold thesis.
Negotiation context
- It's been on market 61 days — a 6% lower offer ($287k) is reasonable based on typical stale-listing flexibility.
- 4 sale attempts since 3y ago with the ask held roughly flat each time — persistent listings suggest the price (not the market) is what's stuck; bring a comps-based counter.
- Current owner paid $155k; list at $305k implies a 97% gain — meaningful room to come down on a strong offer.
Risks & watch-outs
- Climate carrying-cost: severe wind risk, 99% chance of damaging wind over 30y; extreme-heat days projected 7→22/yr by 2055 (HVAC capex compounding) — expect insurance premiums to compound above CPI over the hold.
Questions for the listing agent
- What do current leases actually rent for vs. the listed asking? Can we see a recent rent roll and the last 12 months of T-12 income?
- It's been on market 61 days. Have you received any prior offers? Is the seller open to a 27% concession, seller financing, or rate buy-down credit?
- Built in 1961 — when were the roof, HVAC, electrical panel, plumbing, and water heater last replaced?
- Why hasn't it sold? Are there any deal-killer items the seller is aware of (foundation, flood, title, zoning, code violations)?
- Is there a deadline driving the sale (1031 exchange, divorce, estate, relocation)? That informs how much negotiation room exists.
- The area grade is low — what's the realistic commute time and amenity access for the typical tenant pool here? Any planned neighborhood developments (good or bad) we should know about?
- What's the average days-on-market for RENTAL listings here right now (not sales)? A rising rental-DOM trend means longer vacancies and softer asking-rent achievability than the comps imply.
- What's the recent tenant-quality profile in this submarket — average credit score on applications, eviction rate, late-payment / NSF rate, and stable-employment percentage? A property-management company in the area should have these aggregated.
- How much new for-sale + rental construction is in the pipeline within 1–3 miles? Heavy new supply typically softens prices + rents 12–24 months out; constrained supply supports both.
Investment metrics
- 1% rule
- 0.73% ✗
- Cap rate
- 5.49%
- Cash-on-cash
- -2.88%
- DSCR
- 0.87
- GRM
- 11.3
CMA / ARV
- ARV (median comp)
- $362,919
- List price
- $305,000
- Delta
- -15.96%
- Verdict
- UNDERPRICED
- Comps
- 20 within 1.0 mi
Show comp detail 12 sales within ~0.75 mi
| Address | Dist | Beds/Ba | Sqft | Sold | Price | $/sf | Match |
|---|---|---|---|---|---|---|---|
| 228 NW Watson Dr | 0.12mi | 3/1.5 (-1) | 1,512 (+1%) | 1mo | $300,000 | $198 | 81 |
| 109 NW Maurice Ave | 0.17mi | 3/2.0 (-1) | 1,488 (-1%) | 1mo | $313,000 | $210 | 81 |
| 308 NW Victoria Ave | 0.20mi | 3/2.0 (-1) | 1,383 (-8%) | 0mo | $310,000 | $224 | 68 |
| 135 Moriarty St | 0.44mi | 4/2.0 | 1,552 (+4%) | 2mo | $342,000 | $220 | 68 |
| 300 NW Victoria Ave | 0.20mi | 3/2.0 (-1) | 1,613 (+8%) | 2mo | $375,000 | $232 | 68 |
| 208 Moriarty St | 0.33mi | 3/2.5 (-1) | 1,600 (+7%) | 0mo | $368,995 | $231 | 66 |
| 300 NW Leah Miller Dr | 0.26mi | 3/2.0 (-1) | 1,620 (+8%) | 1mo | $375,000 | $231 | 64 |
| 132 NW Loizos Dr | 0.41mi | 4/1.5 | 1,412 (-6%) | 2mo | $290,000 | $205 | 64 |
| 374 NW Makron Dr | 0.45mi | 3/2.0 (-1) | 1,592 (+6%) | 0mo | $365,000 | $229 | 59 |
| 213 NW Moriarty St | 0.34mi | 3/1.0 (-1) | 1,326 (-12%) | 0mo | $269,000 | $203 | 52 |
| 27 SW Driftwood Ave | 0.72mi | 3/2.0 (-1) | 1,586 (+6%) | 2mo | $199,000 | $125 | 46 |
| 387 NW Canterbury Cir | 0.68mi | 3/2.0 (-1) | 1,294 (-14%) | 1mo | $384,900 | $297 | 36 |
Match score weights: distance 35% · size 25% · config 20% · recency 20%. Top-matched comps best support the ARV.
Projected returns pro-forma
-3.0% appreciation · 1.33% rent growth · sell at horizon
- IRR
- -22.9%
- Equity multiple
- 0.22×
- Total profit
- $-66,225
- Equity at exit
- $45,476
- IRR
- -21.9%
- Equity multiple
- -0.05×
- Total profit
- $-89,358
- Equity at exit
- $26,371
Cash invested: $85,400 (down + closing). Projections, not guarantees.
Landlord ↔ Tenant lean methodology
- Overall (STATE)
- 87 Strongly Landlord-Friendly
- State Florida
- 87 Strongly Landlord-Friendly · R+3
- County
- — inherits STATE
- City
- — inherits STATE
ZIP-level market 32548
- Home prices YoY
- -31.1%
- Rents YoY
- 1.3%
- Active inventory
- 341
- Price-to-rent
- 11.3×
Monthly cashflow live
- Estimated rent
- $2,240 high interval (Pro) →
- Mortgage (P&I)
- −$1,599
- Tax from tax record
- −$248 /mo · $2,972/yr
- Insurance
- −$127
- HOA
- −$0
- Vacancy / Maint / Mgmt
- −$470
- Net cashflow
- $-205
Break-even live
UW: 25.0% down · 7.5% · 30yr · 1.5% tax · 5.0% vac · 8.0% maint · 8.0% mgmt
Financing live
Cash to close
- Down payment
- $76,250
- Closing costs
- $9,150
- Reserves months
- —
- Total cash needed
- —
Loan-product check · same deal, 3 products live
Conventional
25% down · 7.5% · 30yr
- Down + closing
- —
- Monthly P&I
- —
- Monthly cashflow
- —
- DSCR
- —
- Eligible?
- —
Personal DTI + credit; lowest rate.
DSCR
20% down · 8.5% · 30yr
- Down + closing
- —
- Monthly P&I
- —
- Monthly cashflow
- —
- DSCR
- —
- Eligible?
- —
No personal income docs; deal must DSCR.
Hard money
10% down · 12.0% · 12mo
- Down + closing
- —
- Monthly P&I
- —
- Monthly cashflow
- —
- DSCR
- —
- Eligible?
- —
Short-term bridge; refi at stabilization.
Rent comps 10 comps
| Address | Beds | Baths | Sqft | Rent | $/sqft | DOM | Units | Dist |
|---|---|---|---|---|---|---|---|---|
| 305 Leah Miller Dr NW Fort Walton Beach, FL | 3.0 | 1.5 | 1334 | $2,000 | $1.50 | 21d | 1 | 0.22mi |
| 322 Kathleen Pl NW Fort Walton Beach, FL | 4.0 | 2.0 | 1532 | $2,490 | $1.63 | 14d | 1 | 0.38mi |
| 110 Loizos Dr NW Fort Walton Beach, FL | 3.0 | 2.0 | 1148 | $2,200 | $1.92 | 44d | 1 | 0.60mi |
| 17 Cape Dr NW Unit B Fort Walton Beach, FL | 3.0 | 2.0 | 1462 | $1,995 | $1.36 | 14d | 1 | 0.69mi |
| 358 Coral Dr SW Fort Walton Beach, FL | 3.0 | 2.0 | 1350 | $1,800 | $1.33 | 44d | 1 | 0.74mi |
| 218 Rose Marie Ln SW Fort Walton Beach, FL | 3.0 | 1.0 | 1208 | $1,750 | $1.45 | 21d | 1 | 0.81mi |
| 204 Devon Ct Fort Walton Beach, FL | 3.0 | 2.0 | 1599 | $2,000 | $1.25 | 44d | 1 | 1.09mi |
| 30 Harbeson Ave NE Fort Walton Beach, FL | 4.0 | 2.5 | 1717 | $2,250 | $1.31 | 44d | 1 | 1.26mi |
| 13 Chatelaine Cir SE Fort Walton Beach, FL | 3.0 | 3.0 | 1728 | $2,100 | $1.22 | 14d | 1 | 1.32mi |
| 490 Soundview Ct Mary Esther, FL | 3.0 | 2.5 | 1678 | $3,200 | $1.91 | 21d | 1 | 1.33mi |
Listing history 28 events
-
2026-06-18days on market $305,000 Active 61 DOM
-
2026-06-17days on market $305,000 Active 60 DOM
-
2026-06-16pricedays on market $305,000 Active 59 DOM
-
2026-06-15days on market $320,000 Active 58 DOM
-
2026-06-14days on market $320,000 Active 56 DOM
-
2026-06-13days on market $320,000 Active 55 DOM
-
2026-06-10days on market $320,000 Active 53 DOM
-
2026-06-09days on market $320,000 Active 52 DOM
-
2026-06-08days on market $320,000 Active 51 DOM
-
2026-06-07days on market $320,000 Active 50 DOM
-
2026-06-05days on market $320,000 Active 47 DOM
-
2026-06-02days on market $320,000 Active 45 DOM
-
2026-06-01days on market $320,000 Active 44 DOM
-
2026-05-31days on market $320,000 Active 43 DOM
-
2026-05-30days on market $320,000 Active 42 DOM
-
2026-04-18$320,000 Active 51-char remark
Show marketing remark (51 chars)
Partially Completed Home with Expanded Master Suite
-
2025-03-03soldstatus $155,000 Closed 450-char remark
Show marketing remark (450 chars)
Auction Property. AUCTION. Affordable ranch home is in need of your renovations. Come restore this to your desired dream space. Home features 4 beds, 2.5 baths and sits on a large lot. A lot will be required to restore this home to include roof, ceiling, floors and other cosmetic updates. Property is sold as-is with no property disclosure or inspection reports. Gather your design ideas and make this your next project. CAUTION MOLD may be present.
-
2025-01-28status Pending 450-char remark
Show marketing remark (450 chars)
Auction Property. AUCTION. Affordable ranch home is in need of your renovations. Come restore this to your desired dream space. Home features 4 beds, 2.5 baths and sits on a large lot. A lot will be required to restore this home to include roof, ceiling, floors and other cosmetic updates. Property is sold as-is with no property disclosure or inspection reports. Gather your design ideas and make this your next project. CAUTION MOLD may be present.
-
2025-01-15$159,000 Active 450-char remark
Show marketing remark (450 chars)
Auction Property. AUCTION. Affordable ranch home is in need of your renovations. Come restore this to your desired dream space. Home features 4 beds, 2.5 baths and sits on a large lot. A lot will be required to restore this home to include roof, ceiling, floors and other cosmetic updates. Property is sold as-is with no property disclosure or inspection reports. Gather your design ideas and make this your next project. CAUTION MOLD may be present.
-
2023-08-29status Active
-
2023-08-29historical
-
2023-07-07status Pending
-
2023-06-23price $186,100
-
2023-05-26price $204,000
-
2023-05-11price $227,600
-
2023-04-25price $251,400
-
2023-04-07$280,000 Active
-
1977-01-01soldstatus $12,589
ⓘ Source: listings_history table (triggers on properties + properties_extension) + one-shot
backfill from property_details.listing_events for pre-trigger history.
Tax reassessment forecast FL · Resets to sale price
- Current annual tax
- $2,972 · $248/mo
- Projected year-2 tax
- $2,972 · $248/mo
- Expected delta
- $0/yr ($0/mo · 0.0%)
ⓘ Screening estimate from a state-policy table — verify with the county assessor before closing.
Climate risk First Street
- Flood 1/10 Low FEMA zone X (unshaded) · 0% chance over 30 yrs
- Wildfire 1/10 Low
- Heat 10/10 Extreme 7 d/yr ≥104°F today · 22 d/yr by 30 yrs out
- Wind 9/10 Extreme 99% chance of damaging wind over 30 yrs
- Air quality 2/10 Low 1 unhealthy d/yr today · 2 by 30 yrs out
Nearby sold comps map
Loading sold comps map…
Walkable amenities ~0.75 mi
Loading nearby amenities…
Taxation est. · year 1
- Rental income
- $26,874
- − Mortgage interest
- −$17,085
- − Property taxes
- −$2,972
- − Insurance
- −$1,525
- − Repairs & maintenance
- −$2,150
- − Management
- −$2,150
- − Depreciation
- −$8,873
- Taxable loss
- −$7,879
- Est. tax savings @ 24.0%
- +$1,891
- After-tax cash flow
- $-568/yr
For passive investors: Depreciation is non-cash, so a rental often shows a tax loss while cash-flowing — sheltering income. Rental losses are passive: they offset passive income freely, and up to $25,000/yr can offset ordinary (W-2) income if you actively participate and your MAGI is under $100k (phasing out to $0 by $150k); unused losses carry forward. On sale, claimed depreciation is recaptured at up to 25%, and gains may owe capital-gains tax (a 1031 exchange can defer both). Figures are a year-1 estimate at your 24.0% rate — not tax advice; consult a CPA.
Schools (NCES district)
- District
- Okaloosa
- NCES district ID
- 1201380
- Math proficiency
- 60% ▼ -12.00%
- Reading proficiency
- 60% ▼ -4.00%
- Median HH income
- $55,601
- Composite
- 51.62/100
- National rank
- #1705
- State rank
- #12 of 73 in FL
Livability — Fort Walton Beach
- Score
- 80/100
- State rank
- #111
- US rank
- #1628
Category grades
Schools grade is shown separately in the Schools card above.
Census & demographics
- Census place
- Fort Walton Beach, FL
- County
- Okaloosa County · 194,352 people
- City population
- 59,301
- Metro
- Crestview-Fort Walton Beach-Destin, FL
- Population (ZIP)
- 23,774
- Household income
- $65,342
- Rent vs Own
- Severe rent burden
- 889.0
Population outlook (Okaloosa County) Hauer SSP2
- Today (2025)
- 235,133 people
- By 2030
- 253,483 · +7.8%
- By 2040
- 289,537 · +23.1%
- By 2050
- 322,954 · +37.3%
- By 2075
- 399,624 · +70.0%
- By 2100
- 425,311 · +80.9%
Race, ethnicity, and origin ACS 2023
- Neighborhood character
- Diverse neighborhood (Simpson 0.57)
- Race & ethnicity
- White 63% Hispanic / Latino 13% Black 12% Two or more races 9% Asian 6%
- Hispanic origin (detail)
- Mexican 4% Puerto Rican 2%
- Common ancestry
- Italian 4% Slovak 3% Romanian 2%
- Foreign-born
- 12% · Canada, Jamaica
- Languages at home
- 84% English-only · Spanish 9% Other Asian/Pacific 3% Other Indo-European 1%
Political lean MEDSL · Okaloosa
- 2024 margin
- Solid R (+42.4) · D 28.2% · R 70.7% · Other 1.1%
- 2008→2024 swing
- +2.5pp toward D · 2008: -44.9pp · 2024: -42.4pp
- All cycles
- 2024: R+42.4 2020: R+39.1 2016: R+47.8 2012: R+49.4 2008: R+44.9
Not yet ingested
- Civics
- —
Market trends
- HPI YoY
- ▼ -123.88%
- Current HPI
- 274.8418
- Rent YoY
- ▲ 1.33%
- Metro
- Crestview-Fort Walton Beach-Destin, FL
- State GDP YoY
- ▲ 3.28%
- F500 in state
- 36
Industry mix (Fortune 500 HQ in FL)
| Industry | F500 HQs | Revenue |
|---|---|---|
| Industrial Technology | 2 | $29B |
|
||
| Insurance | 2 | $17B |
|
||
| Retail | 1 | $60B |
|
||
| Technology Distribution | 1 | $58B |
|
||
| Homebuilding | 1 | $35B |
|
||
| Technology Manufacturing | 1 | $35B |
|
||
Price history
+2441.9% since first listed13 events — show timeline
- 2026-04-18 Listed $320,000 NAMLS
- 2025-03-03 Sold (MLS) $155,000 Stellar MLS as Distributed by MLS Grid
- 2025-01-28 Pending — Stellar MLS as Distributed by MLS Grid
- 2025-01-15 Listed $159,000 Stellar MLS as Distributed by MLS Grid
- 2023-08-29 Relisted — Stellar MLS as Distributed by MLS Grid
- 2023-08-29 Listing Removed — Stellar MLS as Distributed by MLS Grid
- 2023-07-07 Pending — Stellar MLS as Distributed by MLS Grid
- 2023-06-23 Price Changed $186,100 Stellar MLS as Distributed by MLS Grid
- 2023-05-26 Price Changed $204,000 Stellar MLS as Distributed by MLS Grid
- 2023-05-11 Price Changed $227,600 Stellar MLS as Distributed by MLS Grid
- 2023-04-25 Price Changed $251,400 Stellar MLS as Distributed by MLS Grid
- 2023-04-07 Listed $280,000 Stellar MLS as Distributed by MLS Grid
- 1977-01-01 Sold (Public Records) $12,589 Public Records
Property tax history
+16.4%/yrLatest (2025): $2,972 · +2.8% YoY. Source: county tax records.
Cash-flow waterfall
monthlySold comps — $/sqft
last 12 mo · ≤1 miLoading sold comps…