 Multi-family
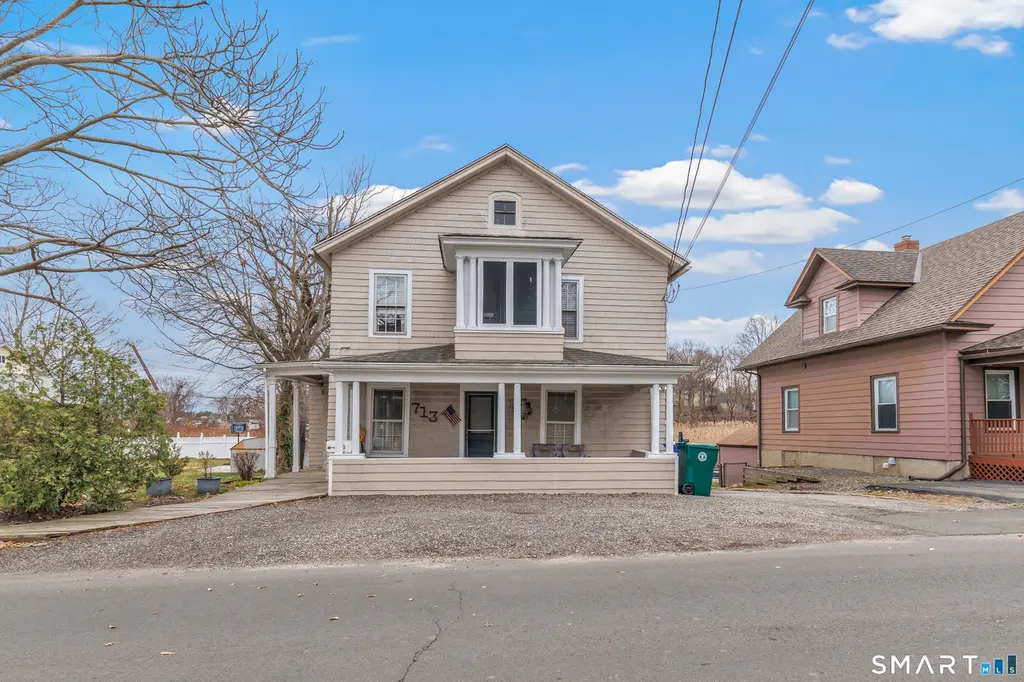
713 Broad St · Milford city (balance), CT
Flood risk 10/10 · Severe
- FEMA flood zone
- AE
- Chance of flooding over 30 yrs
- 0.99%
- Est. flood insurance / yr
- $2,026 – $9,024
Fire risk 1/10 · Minimal
- Est. fire insurance / yr
- $829 – $1,539
Heat risk 6/10 · Moderate
- Hot days now (above 96°F)
- 7 days/yr
- Hot days in 30 yrs
- 15 days/yr
Wind risk 6/10 · Moderate
- Chance of severe wind over 30 yrs
- 60.0%
Air-quality risk 4/10 · Minor
- Unhealthy air days now
- 5 days/yr
- Unhealthy air days in 30 yrs
- 7 days/yr
Risk factors via First Street. Map © Google.
Why this score? — see what drove the C- grade
The composite is a weighted blend of 9 inputs, each scored 0–100. Each bar is that input's sub-score; the figure is the points it added to the 100-point composite (weight × sub-score).
- Cash flow +22.2/30.0
- ARV discount +8.5/15.0
- DSCR +7.1/10.0
- 1% rule +6.0/10.0
- Schools +2.8/10.0
- Rent growth +2.5/5.0
- Livability +2.5/5.0
- Condition / age +2.5/5.0
- Appreciation +0.0/10.0
$425,000
🖨 Deal sheet (PDF) 📄 Offer letter ✓ Due diligence
Multi-family units
County records classify this as Multi-Family (2-4 Unit). Listing-text estimate: 1 unit. estimate disagrees with records
Listing remarks MLS
A Rare Find In The Historical Area - Convenient Location W/ Short Walk To Train Station. Each Flr 4 Rm, 2Br, 1 Bth. Newer Windows, Updated 100 Amp Electrical Services, Newer Hw Heaters. All Separate Utilites Except Water. Full Basement
Key facts
- 0.28 acre lot
- Garage
- Built 1890
Property features AI
Exterior
- Parking: Detached garage (1); Driveway; Off-street parking; Total of 6 parking spaces
- Utilities: Public water connected; Public sewer connected; Hot water from natural gas and electric (40-gallon tank); Thermopane windows (energy efficient)
- Home design: Multi-family property (2-family); Multi-family for sale; Frame construction; White exterior siding; Private driveway
- Construction: Stone foundation; Asphalt shingle roof
- Exterior features: Porch; Gutters; Level lot; Some wetlands; Located in a historic district; Beach rights
Interior
- Bedrooms: 4 bedrooms (total)
- Bathrooms: 2 full bathrooms
- Heating & cooling: Hot water heating; Natural gas heat
- Interior features: 8 total rooms; Full basement with interior access and storage; Attic with walk-up access used for storage
- Laundry & utility: Laundry located on lower level; In-unit hook-ups in at least one unit; some units include washer/dryer
Neighborhood map
What this means for you Summary
Snapshot
- This is a 4-bed/2.0-bath multifamily listed at $425k.
Deal economics
- At list price, monthly cash flow is $230 ($3k/yr) — positive.
- The deal already cash-flows at list — no discount required.
- Meets the 1% rule at list price ($5k rent vs $425k).
- Recommended offer: $412k (3.0% below list) — sets the bar for market timing.
- Cap rate 8.2% vs local median 3.6% in Milford city (balance) — top-decile yield for the area; either an underpriced asset or a hidden risk that comps aren't pricing in. Stress-test before assuming the spread holds.
Location & tenants
- Location reads: area grade C — affects rentability + tenant quality, not the cash-flow math above.
- Stratford School District (urban): math 22% / reading 38% proficiency, ranked #122 of 153 in CT (top 80%) — families likely to look elsewhere, expect single-tenant / working-renter base with shorter leases.
- Zoned schools: Stratford Academy - Johnson House (math 14% / reading 28%, grade F, #441 of 553 statewide, top 80%, 557 students, 64% FRL); David Wooster Middle School (math 18% / reading 40%, grade F, #143 of 175 statewide, top 83%, 539 students, 51% FRL); Stratford High School (math 19% / reading 46%, grade F, #125 of 194 statewide, top 66%, 1,127 students, 45% FRL) — zoned schools average 53% FRL vs 31% district-wide (22 pts higher); higher-poverty schools than district average — tighter screening recommended.
- Market conditions: 76 active listings in the ZIP; 11 comparable units currently listed for rent nearby; rentals at typical pace (median 21d on market — plan ~3-4 weeks tenant-placement turnaround); solid renter incomes; 852 units permitted in Greater Bridgeport Planning Region in 2024 (698 in 5+ unit buildings).
- At $4,675/mo this rent would consume 69% of the median local household income ($82k/yr) (locally 507% of renters already pay >50% of income on rent) — very limited rent-growth headroom before tenants either downsize or default.
Forward outlook
- Local home prices are declining (-3.0%/yr); year-one equity from $3k of loan paydown is wiped out by about $13k of value loss. Plan a longer hold.
Negotiation context
- It's been on market 45 days — a 3% lower offer ($412k) is reasonable based on typical stale-listing flexibility.
- 2 sale attempts since 15y ago with the ask held roughly flat each time — persistent listings suggest the price (not the market) is what's stuck; bring a comps-based counter.
- Current owner paid $213k; list at $425k implies a 100% gain — meaningful room to come down on a strong offer.
Risks & watch-outs
- Watch-outs: flood insurance adds $460/mo; built in 1890 — expect roof / HVAC / electrical / plumbing capex.
- Climate carrying-cost: in FEMA flood zone AE (mandatory federal flood insurance); major wind risk, 60% chance of damaging wind over 30y; extreme-heat days projected 7→15/yr by 2055 (HVAC capex compounding) — expect insurance premiums to compound above CPI over the hold.
Questions for the listing agent
- It's been on market 45 days. Have you received any prior offers? Is the seller open to a 3% concession, seller financing, or rate buy-down credit?
- Built in 1890 — when were the roof, HVAC, electrical panel, plumbing, and water heater last replaced?
- What's the actual annual flood-insurance premium (NFIP or private), and is the property in a SFHA with mandatory coverage?
- Is there a deadline driving the sale (1031 exchange, divorce, estate, relocation)? That informs how much negotiation room exists.
- What's the average days-on-market for RENTAL listings here right now (not sales)? A rising rental-DOM trend means longer vacancies and softer asking-rent achievability than the comps imply.
- What's the recent tenant-quality profile in this submarket — average credit score on applications, eviction rate, late-payment / NSF rate, and stable-employment percentage? A property-management company in the area should have these aggregated.
- How much new apartment / multifamily construction is in the pipeline within 1–3 miles? Heavy new supply (>2% of stock underway) typically softens rents 12–24 months out; light construction supports rent growth.
Investment metrics
- 1% rule
- 1.10% ✓
- Cap rate
- 8.24%
- Cash-on-cash
- 6.96%
- DSCR
- 1.31
- GRM
- 7.6
CMA / ARV
- ARV (on-the-fly)
- $434,943
- Comps found
- 3
Show comp detail 3 sales within ~0.75 mi
| Address | Dist | Beds/Ba | Sqft | Sold | Price | $/sf | Match |
|---|---|---|---|---|---|---|---|
| 713 Broad St | 0.00mi | 4/2.0 | 1,629 (0%) | 1mo | $435,000 | $267 | 99 |
| 414 Knowlton St | 0.68mi | 4/2.0 | 1,671 (+3%) | 20mo | $450,000 | $269 | 48 |
| 1491 Elm St | 0.62mi | 5/5.0 (+1) | 1,599 (-2%) | 23mo | $375,000 | $235 | 32 |
Match score weights: distance 35% · size 25% · config 20% · recency 20%. Top-matched comps best support the ARV.
Projected returns pro-forma
-3.0% appreciation · 3.0% rent growth · sell at horizon
- IRR
- -12.5%
- Equity multiple
- 0.55×
- Total profit
- $-53,815
- Equity at exit
- $63,369
- IRR
- -3.3%
- Equity multiple
- 0.78×
- Total profit
- $-26,384
- Equity at exit
- $36,746
Cash invested: $119,000 (down + closing). Projections, not guarantees.
Landlord ↔ Tenant lean methodology
- Overall (STATE)
- 27 Tenant-Leaning
- State Connecticut
- 27 Tenant-Leaning · D+7
- County
- — inherits STATE
- City
- — inherits STATE
ZIP-level market 06615
- Active inventory
- 76
- Price-to-rent
- 15.2×
Monthly cashflow live
- Estimated rent
- $4,675 high interval (Pro) →
- Mortgage (P&I)
- −$2,229
- Tax from tax record
- −$597 /mo · $7,162/yr
- Insurance
- −$177
- Flood insurance flood zone
- −$460 /mo · $5,525/yr
- HOA
- −$0
- Vacancy / Maint / Mgmt
- −$982
- Net cashflow
- $230
Break-even live
Sensitivity live
| Price | -10% $471 | -5% $350 | +0% $230 | +5% $110 | +10% $-10 |
|---|---|---|---|---|---|
| Rent | -10% $-139 | -5% $46 | +0% $230 | +5% $415 | +10% $599 |
| Rate | -1.0pp $444 | -0.5pp $338 | base $230 | +0.5pp $120 | +1.0pp $8 |
2-unit breakdown (identical units grouped — click to expand)
| Units | Beds | Baths | Est. rent |
|---|---|---|---|
| 2× units | 2 | 1 | $4,674 |
| #1 | 2 | 1 | $2,337 |
| #2 | 2 | 1 | $2,337 |
| Total (2 units) | $4,675 | ||
UW: 25.0% down · 7.5% · 30yr · 1.5% tax · 5.0% vac · 8.0% maint · 8.0% mgmt
Financing live
Cash to close
- Down payment
- $106,250
- Closing costs
- $12,750
- Reserves months
- —
- Total cash needed
- —
Loan-product check · same deal, 3 products live
Conventional
25% down · 7.5% · 30yr
- Down + closing
- —
- Monthly P&I
- —
- Monthly cashflow
- —
- DSCR
- —
- Eligible?
- —
Personal DTI + credit; lowest rate.
DSCR
20% down · 8.5% · 30yr
- Down + closing
- —
- Monthly P&I
- —
- Monthly cashflow
- —
- DSCR
- —
- Eligible?
- —
No personal income docs; deal must DSCR.
Hard money
10% down · 12.0% · 12mo
- Down + closing
- —
- Monthly P&I
- —
- Monthly cashflow
- —
- DSCR
- —
- Eligible?
- —
Short-term bridge; refi at stabilization.
Rent comps 11 comps
| Address | Beds | Baths | Sqft | Rent | $/sqft | DOM | Units | Dist |
|---|---|---|---|---|---|---|---|---|
| 55 Kings College Pl Stratford, CT | 4.0 | 1.5 | 1435 | $2,800 | $1.95 | 25d | 1 | 0.37mi |
| 1127 W Broad St Stratford, CT | 3.0 | 1.5 | 1636 | $4,000 | $2.44 | 5d | 1 | 0.39mi |
| 498 Sherwood Pl Stratford, CT | 3.0 | 1.0–2.0 | 984 | $3,195 | $3.25 | 23d | 5 | 0.49mi |
| 11 Colony St Stratford, CT | 4.0 | 2.0 | 1450 | $3,700 | $2.55 | 5d | 1 | 0.69mi |
| 55 Woodend Rd Stratford, CT | 3.0 | 1.5 | 1200 | $3,000 | $2.50 | 4d | 1 | 0.84mi |
| 231 Nichols Ave Stratford, CT | 3.0 | 1.0 | 1200 | $3,000 | $2.50 | 21d | 1 | 0.98mi |
| 301 McGrath Ct Stratford, CT | 3.0 | 1.5 | 1232 | $2,450 | $1.99 | 25d | 1 | 1.10mi |
| 85 Green St Stratford, CT | 4.0 | 1.0 | 1428 | $3,400 | $2.38 | 45d | 1 | 1.18mi |
| 405 Wilcoxson Ave Stratford, CT | 3.0 | 2.0 | 1458 | $3,500 | $2.40 | 4d | 1 | 1.18mi |
| 164 Meadowview Ave Stratford, CT | 3.0 | 1.5 | 1188 | $2,800 | $2.36 | 45d | 1 | 1.47mi |
| 82 Miller Ave Milford, CT | 4.0 | 2.0 | 1866 | $4,750 | $2.55 | 4d | 1 | 1.47mi |
Listing history 8 events
-
2026-05-23status Under Contract
-
2026-04-17historical Under Contract - Continue to Show
-
2026-04-08$425,000 Active
-
2026-03-31historical $425,000
-
2011-07-18soldstatus $213,000 235-char remark
Show marketing remark (235 chars)
A Rare Find In The Historical Area - Convenient Location W/ Short Walk To Train Station. Each Flr 4 Rm, 2Br, 1 Bth. Newer Windows, Updated 100 Amp Electrical Services, Newer Hw Heaters. All Separate Utilites Except Water. Full Basement
-
2011-07-18soldstatus $213,000
Show marketing remark (235 chars)
A Rare Find In The Historical Area - Convenient Location W/ Short Walk To Train Station. Each Flr 4 Rm, 2Br, 1 Bth. Newer Windows, Updated 100 Amp Electrical Services, Newer Hw Heaters. All Separate Utilites Except Water. Full Basement
-
2011-04-26$224,900 235-char remark
Show marketing remark (235 chars)
A Rare Find In The Historical Area - Convenient Location W/ Short Walk To Train Station. Each Flr 4 Rm, 2Br, 1 Bth. Newer Windows, Updated 100 Amp Electrical Services, Newer Hw Heaters. All Separate Utilites Except Water. Full Basement
-
2010-09-02soldstatus $210,000
ⓘ Source: listings_history table (triggers on properties + properties_extension) + one-shot
backfill from property_details.listing_events for pre-trigger history.
Tax reassessment forecast CT · Partial reset (capped growth)
- Current annual tax
- $7,162 · $597/mo
- Projected year-2 tax
- $8,128 · $677/mo
- Expected delta
- +$966/yr (+$81/mo · 13.5%)
ⓘ Screening estimate from a state-policy table — verify with the county assessor before closing.
Climate risk First Street
- Flood 10/10 Extreme FEMA zone AE · 99% chance over 30 yrs
- Wildfire 1/10 Low
- Heat 6/10 Major 7 d/yr ≥96°F today · 15 d/yr by 30 yrs out
- Wind 6/10 Major 60% chance of damaging wind over 30 yrs
- Air quality 4/10 Moderate 5 unhealthy d/yr today · 7 by 30 yrs out
Nearby sold comps map
Loading sold comps map…
Walkable amenities ~0.75 mi
Loading nearby amenities…
Taxation est. · year 1
- Rental income
- $56,100
- − Mortgage interest
- −$23,807
- − Property taxes
- −$7,162
- − Insurance
- −$7,650
- − Repairs & maintenance
- −$4,488
- − Management
- −$4,488
- − Depreciation
- −$12,364
- Taxable loss
- −$3,858
- Est. tax savings @ 24.0%
- +$926
- After-tax cash flow
- $3,688/yr
For passive investors: Depreciation is non-cash, so a rental often shows a tax loss while cash-flowing — sheltering income. Rental losses are passive: they offset passive income freely, and up to $25,000/yr can offset ordinary (W-2) income if you actively participate and your MAGI is under $100k (phasing out to $0 by $150k); unused losses carry forward. On sale, claimed depreciation is recaptured at up to 25%, and gains may owe capital-gains tax (a 1031 exchange can defer both). Figures are a year-1 estimate at your 24.0% rate — not tax advice; consult a CPA.
Schools (NCES district)
- District
- Stratford School District
- NCES district ID
- 0904440
- Math proficiency
- 22% ▼ -12.00%
- Reading proficiency
- 38% ▼ -10.00%
- Median HH income
- $67,912
- Composite
- 27.85/100
- National rank
- #6877
- State rank
- #122 of 153 in CT
Livability — Milford city (balance)
No livability data for this city. (Only ~50 U.S. cities are tracked.)
Census & demographics
- County
- Fairfield County · 765,532 people
- City population
- 52,340
- Metro
- Bridgeport-Stamford-Norwalk, CT
- Population (ZIP)
- 17,136
- Household income
- $81,534
- Rent vs Own
- Severe rent burden
- 507.0
Population outlook (Greater Bridgeport County) Hauer SSP2
- By 2040
- 365,581
Race, ethnicity, and origin ACS 2023
- Neighborhood character
- Diverse neighborhood (Simpson 0.63)
- Race & ethnicity
- White 53% Hispanic / Latino 24% Black 18% Two or more races 6% Asian 3%
- Hispanic origin (detail)
- Mexican 2% Puerto Rican 13%
- Common ancestry
- Romanian 5% Hispanic 3% Lithuanian 2%
- Foreign-born
- 18% · Canada, South Korea, Jamaica
- Languages at home
- 74% English-only · Spanish 17% French/Haitian/Cajun 2% Other Indo-European 2%
Political lean MEDSL · Greater Bridgeport
- 2024 margin
- Strong D (+23.3) · D 60.9% · R 37.6% · Other 1.5%
- All cycles
- 2024: D+23.3
Not yet ingested
- Civics
- —
Market trends
- HPI YoY
- ▼ -359.68%
- Current HPI
- 230.0031
- Rent YoY
- —
- Metro
- Bridgeport-Stamford-Norwalk, CT
- State GDP YoY
- ▲ 1.06%
- F500 in state
- 38
Industry mix (Fortune 500 HQ in CT)
| Industry | F500 HQs | Revenue |
|---|---|---|
| Industrial Machinery | 4 | $38B |
|
||
| Insurance | 3 | $71B |
|
||
| Financial Services | 2 | $25B |
|
||
| Transportation / Logistics | 2 | $18B |
|
||
| Healthcare | 1 | $247B |
|
||
| Telecommunications | 1 | $55B |
|
||
Price history
+102.4% since first listed8 events — show timeline
- 2026-05-23 Pending — Smart MLS
- 2026-04-17 Contingent — Smart MLS
- 2026-04-08 Listed $425,000 Smart MLS
- 2026-03-31 Coming Soon $425,000 Smart MLS
- 2011-07-18 Sold (Public Records) $213,000 Public Records
- 2011-07-18 Sold (MLS) $213,000 Smart MLS
- 2011-04-26 Listed $224,900 Smart MLS
- 2010-09-02 Sold (Public Records) $210,000 Public Records
Property tax history
+2.8%/yrLatest (2023): $7,162 · +1.9% YoY. Source: county tax records.
Cash-flow waterfall
monthlySold comps — $/sqft
last 12 mo · ≤1 miLoading sold comps…