 14-Plex
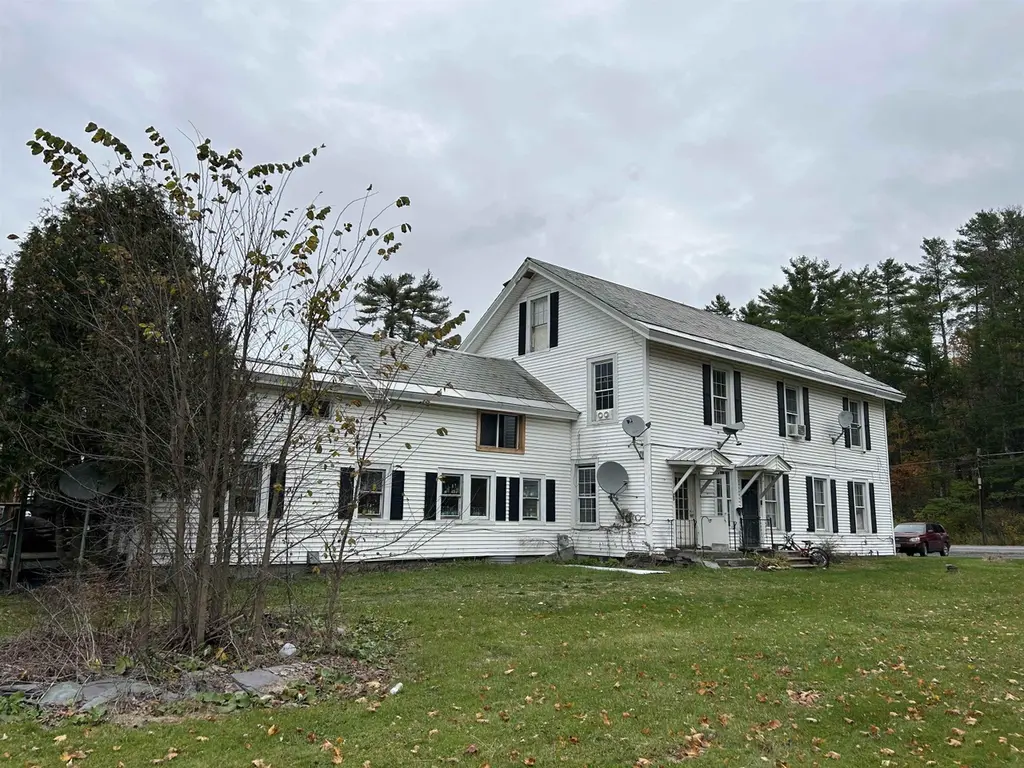
2137 Route 30 N · Castleton, VT
Flood risk 1/10 · Minimal
- FEMA flood zone
- X (unshaded)
- Chance of flooding over 30 yrs
- 0.0%
- Est. flood insurance / yr
- $507 – $1,088
Fire risk 2/10 · Minimal
- Est. fire insurance / yr
- $480 – $892
Heat risk 2/10 · Minimal
- Hot days now (above 94°F)
- 7 days/yr
- Hot days in 30 yrs
- 16 days/yr
Wind risk 2/10 · Minimal
- Chance of severe wind over 30 yrs
- 3.0%
Air-quality risk 1/10 · Minimal
- Unhealthy air days now
- 0 days/yr
- Unhealthy air days in 30 yrs
- 0 days/yr
Risk factors via First Street. Map © Google.
Why this score? — see what drove the B+ grade
The composite is a weighted blend of 9 inputs, each scored 0–100. Each bar is that input's sub-score; the figure is the points it added to the 100-point composite (weight × sub-score).
- Cash flow +30.0/30.0
- DSCR +10.0/10.0
- 1% rule +8.9/10.0
- ARV discount +7.5/15.0
- Appreciation +7.3/10.0
- Schools +5.0/10.0
- Livability +3.2/5.0
- Rent growth +2.5/5.0
- Condition / age +2.2/5.0
$1,190,000
🖨 Deal sheet 📄 Offer letter ✓ Due diligence
Multi-family units
County records classify this as Multi-Family (5+ Unit). Listing-text estimate: 14 units. confirmed
5+ unit building — per-unit beds/baths from public records are typically unavailable; the breakdown below (if shown) is an estimate from the listing text.
Listing remarks MLS
This property is part of 28 units package, could be purchased all or two 14 unit packages, please see MLS # 5067282, total price for all 28 units is $2,450.000 Great investment opportunity, Well maintained property in Castleton (Bomoseen) this property consists of two buildings, Front building with 10units consists of five 2 bedrooms , Three 1 bedrooms , One 3 bedrooms and an Efficiency unit, Back building is 4 units (town home styles)2 stories each unit all four are 2 bedroom units. Total of 14 units , Sits on a large parcel over 6.8_+Acres near lake bomoseen and conveniently on route 30 but buildings are far enough from the road, Plenty of parking , Vinyl siding and vinyl replacement windows, The pro forma Numbers on this property with 100% occupancy is As follows Gross revenues $213,156 A year With expenses just around $67,000 per year, not including management , regular maintenance calls, Vacancy rateAnd debt service, Current CAP Rate Above12% , 11 units are occupied currently the other 3 are in transition . 3 Heating boilers service the front building and two boiler Services the back building.
Key facts
- Large parcel
- Plenty of parking
- Two buildings
Tags
Neighborhood map
What this means for you Summary
Snapshot
- This is a 9×2bd/1ba + 4×1bd/1ba + 1×3bd/1ba units multifamily listed at $1.19M. Condition is rated fair.
Deal economics
- At list price, monthly cash flow is $5k ($58k/yr) — positive. Per door: $345/mo.
- The deal already cash-flows at list — no discount required.
- Meets the 1% rule at list price ($17k rent vs $1.19M).
- Recommended offer: $1.05M (12.0% below list) — sets the bar for market timing.
Location & tenants
- Location reads 64/100 on livability (#66 in VT) — a middle-class / working-renter tenant base. Strengths: crime A+, health & safety A; Watch: schools F, amenities F, commute F.
- Market conditions: 43 active listings in the ZIP; 90 units permitted in Rutland County in 2024 (0 in 5+ unit buildings).
Forward outlook
- In year one you build about $63k of equity ($8k loan paydown + $54k appreciation (4.6% local appreciation)).
- Rutland County population projected at -28% by 2050 — secular population decline; favor cash flow + early exit over multi-decade hold.
- At projected returns (4.6% appreciation + 3.0% rent growth), your $333k cash investment doubles in ~3 years — after that, you're playing with house money.
- By year 2, paydown + projected appreciation supports a ~$101k cash-out refi (75% LTV) — recoverable capital for the next deal without selling this one.
Negotiation context
- It's been on market 236 days — a 12% lower offer ($1.05M) is reasonable based on typical stale-listing flexibility.
Risks & watch-outs
- Watch-outs: built in 1925 — expect roof / HVAC / electrical / plumbing capex.
Questions for the listing agent
- It's been on market 236 days. Have you received any prior offers? Is the seller open to a 12% concession, seller financing, or rate buy-down credit?
- Can we see the unit-by-unit rent roll, current vacancy, and any below-market leases? What's the average tenancy length?
- What capital expenditures (roof, boiler, parking lot, exteriors) have been made in the last 5 years, and what's planned in the next 2?
- Have any recent inspections been done? Can we get a copy of the seller's disclosures and any deferred-maintenance estimates?
- Built in 1925 — when were the roof, HVAC, electrical panel, plumbing, and water heater last replaced?
- Why hasn't it sold? Are there any deal-killer items the seller is aware of (foundation, flood, title, zoning, code violations)?
- Is there a deadline driving the sale (1031 exchange, divorce, estate, relocation)? That informs how much negotiation room exists.
- Schools are F-rated, which usually means shorter tenancies and higher turnover. Who's the typical renter profile here, and what's been the actual vacancy rate?
- What's the average days-on-market for RENTAL listings here right now (not sales)? A rising rental-DOM trend means longer vacancies and softer asking-rent achievability than the comps imply.
- What's the recent tenant-quality profile in this submarket — average credit score on applications, eviction rate, late-payment / NSF rate, and stable-employment percentage? A property-management company in the area should have these aggregated.
- How much new apartment / multifamily construction is in the pipeline within 1–3 miles? Heavy new supply (>2% of stock underway) typically softens rents 12–24 months out; light construction supports rent growth.
Investment metrics
- 1% rule
- 1.39% ✓
- Cap rate
- 11.16%
- Cash-on-cash
- 17.38%
- DSCR
- 1.77
- GRM
- 6.0
CMA / ARV
No comps found within radius.
Projected returns pro-forma
4.57% appreciation · 3.0% rent growth · sell at horizon
- IRR
- 27.1%
- Equity multiple
- 2.66×
- Total profit
- $552,828
- Equity at exit
- $643,526
- IRR
- 26.4%
- Equity multiple
- 5.26×
- Total profit
- $1,420,640
- Equity at exit
- $1,085,947
Cash invested: $333,200 (down + closing). Projections, not guarantees.
Landlord ↔ Tenant lean methodology
- Overall (STATE)
- 41 Moderately Tenant-Leaning
- State Vermont
- 41 Moderately Tenant-Leaning · D+15
- County
- — inherits STATE
- City
- — inherits STATE
ZIP-level market 05735
- Home prices YoY
- 1.3%
- Active inventory
- 43
- Price-to-rent
- 80.9×
Monthly cashflow live
- Estimated rent
- $16,517 medium interval (Pro) →
- Mortgage (P&I)
- −$6,240
- Tax est. 1.5%
- −$1,488 /mo · $17,850/yr
- Insurance
- −$496
- HOA
- −$0
- Vacancy / Maint / Mgmt
- −$3,469
- Net cashflow
- $4,825
Break-even live
14-unit breakdown (identical units grouped — click to expand)
| Units | Beds | Baths | Est. rent |
|---|---|---|---|
| 9× units | 2 | 1 | $11,034 |
| #1 | 2 | 1 | $1,226 |
| #2 | 2 | 1 | $1,226 |
| #3 | 2 | 1 | $1,226 |
| #4 | 2 | 1 | $1,226 |
| #5 | 2 | 1 | $1,226 |
| #6 | 2 | 1 | $1,226 |
| #7 | 2 | 1 | $1,226 |
| #8 | 2 | 1 | $1,226 |
| #9 | 2 | 1 | $1,226 |
| 4× units | 1 | 1 | $4,164 |
| #10 | 1 | 1 | $1,041 |
| #11 | 1 | 1 | $1,041 |
| #12 | 1 | 1 | $1,041 |
| #14 | 1 | 1 | $1,041 |
| 1× unit | 3 | 1 | $1,324 |
| Total (14 units) | $16,517 | ||
UW: 25.0% down · 7.5% · 30yr · 1.5% tax · 5.0% vac · 8.0% maint · 8.0% mgmt
Financing live
Cash to close
- Down payment
- $297,500
- Closing costs
- $35,700
- Reserves months
- —
- Total cash needed
- —
Loan-product check · same deal, 3 products live
Conventional
25% down · 7.5% · 30yr
- Down + closing
- —
- Monthly P&I
- —
- Monthly cashflow
- —
- DSCR
- —
- Eligible?
- —
Personal DTI + credit; lowest rate.
DSCR
20% down · 8.5% · 30yr
- Down + closing
- —
- Monthly P&I
- —
- Monthly cashflow
- —
- DSCR
- —
- Eligible?
- —
No personal income docs; deal must DSCR.
Hard money
10% down · 12.0% · 12mo
- Down + closing
- —
- Monthly P&I
- —
- Monthly cashflow
- —
- DSCR
- —
- Eligible?
- —
Short-term bridge; refi at stabilization.
Listing history 17 events
-
2026-06-18days on market $1,190,000 Active 236 DOM
-
2026-06-17days on market $1,190,000 Active 235 DOM
-
2026-06-16days on market $1,190,000 Active 234 DOM
-
2026-06-15days on market $1,190,000 Active 233 DOM
-
2026-06-15days on market $1,190,000 Active 232 DOM
-
2026-06-13days on market $1,190,000 Active 231 DOM
-
2026-06-12days on market $1,190,000 Active 230 DOM
-
2026-06-09days on market $1,190,000 Active 227 DOM
-
2026-06-08days on market $1,190,000 Active 226 DOM
-
2026-06-08days on market $1,190,000 Active 225 DOM
-
2026-06-07days on market $1,190,000 Active 224 DOM
-
2026-06-03days on market $1,190,000 Active 221 DOM
-
2026-06-02days on market $1,190,000 Active 220 DOM
-
2026-06-01days on market $1,190,000 Active 219 DOM
-
2026-05-31days on market $1,190,000 Active 218 DOM
-
2025-11-05price $1,190,000 1117-char remark
Show marketing remark (1117 chars)
This property is part of 28 units package, could be purchased all or two 14 unit packages, please see MLS # 5067282, total price for all 28 units is $2,450.000 Great investment opportunity, Well maintained property in Castleton (Bomoseen) this property consists of two buildings, Front building with 10units consists of five 2 bedrooms , Three 1 bedrooms , One 3 bedrooms and an Efficiency unit, Back building is 4 units (town home styles)2 stories each unit all four are 2 bedroom units. Total of 14 units , Sits on a large parcel over 6.8_+Acres near lake bomoseen and conveniently on route 30 but buildings are far enough from the road, Plenty of parking , Vinyl siding and vinyl replacement windows, The pro forma Numbers on this property with 100% occupancy is As follows Gross revenues $213,156 A year With expenses just around $67,000 per year, not including management , regular maintenance calls, Vacancy rateAnd debt service, Current CAP Rate Above12% , 11 units are occupied currently the other 3 are in transition . 3 Heating boilers service the front building and two boiler Services the back building.
-
2025-10-25$1,260,000 Active 1117-char remark
Show marketing remark (1117 chars)
This property is part of 28 units package, could be purchased all or two 14 unit packages, please see MLS # 5067282, total price for all 28 units is $2,450.000 Great investment opportunity, Well maintained property in Castleton (Bomoseen) this property consists of two buildings, Front building with 10units consists of five 2 bedrooms , Three 1 bedrooms , One 3 bedrooms and an Efficiency unit, Back building is 4 units (town home styles)2 stories each unit all four are 2 bedroom units. Total of 14 units , Sits on a large parcel over 6.8_+Acres near lake bomoseen and conveniently on route 30 but buildings are far enough from the road, Plenty of parking , Vinyl siding and vinyl replacement windows, The pro forma Numbers on this property with 100% occupancy is As follows Gross revenues $213,156 A year With expenses just around $67,000 per year, not including management , regular maintenance calls, Vacancy rateAnd debt service, Current CAP Rate Above12% , 11 units are occupied currently the other 3 are in transition . 3 Heating boilers service the front building and two boiler Services the back building.
ⓘ Source: listings_history table (triggers on properties + properties_extension) + one-shot
backfill from property_details.listing_events for pre-trigger history.
Climate risk First Street
- Flood 1/10 Low FEMA zone X (unshaded) · 0% chance over 30 yrs
- Wildfire 2/10 Low
- Heat 2/10 Low 7 d/yr ≥94°F today · 16 d/yr by 30 yrs out
- Wind 2/10 Low 3% chance of damaging wind over 30 yrs
- Air quality 1/10 Low 0 unhealthy d/yr today · 0 by 30 yrs out
Nearby sold comps map
Loading sold comps map…
Walkable amenities ~0.75 mi
Loading nearby amenities…
Taxation est. · year 1
- Rental income
- $198,204
- − Mortgage interest
- −$66,659
- − Property taxes
- −$17,850
- − Insurance
- −$5,950
- − Repairs & maintenance
- −$15,856
- − Management
- −$15,856
- − Depreciation
- −$34,618
- Taxable income
- $41,415
- Est. tax owed @ 24.0%
- −$9,940
- After-tax cash flow
- $47,956/yr
For passive investors: Depreciation is non-cash, so a rental often shows a tax loss while cash-flowing — sheltering income. Rental losses are passive: they offset passive income freely, and up to $25,000/yr can offset ordinary (W-2) income if you actively participate and your MAGI is under $100k (phasing out to $0 by $150k); unused losses carry forward. On sale, claimed depreciation is recaptured at up to 25%, and gains may owe capital-gains tax (a 1031 exchange can defer both). Figures are a year-1 estimate at your 24.0% rate — not tax advice; consult a CPA.
Condition & rehab AI · 11 photos
This multi-family property requires moderate renovations to update the kitchen and bathrooms, freshen the exterior paint, and improve the landscaping. These updates will significantly enhance its resale and rental value.
Repairs flagged
- Minor Kitchen cabinets — The cabinets are dated and could be replaced for a fresh look.
- Minor Bathroom fixtures — The fixtures are dated and could be replaced for a more modern look.
- Minor Exterior paint — The paint is faded in some areas and could be refreshed.
- Minor Flooring — The carpeted flooring is dated and could be replaced with hardwood or tile.
Value-add opportunities
- Resale Kitchen renovation — Updating the kitchen with new cabinets and appliances can significantly increase the home's appeal and value.
- Resale Bathroom updates — Replacing dated fixtures and tiles in the bathrooms can enhance the home's appeal and value.
- Both Exterior paint — Refreshing the exterior paint can improve the home's curb appeal and increase its value.
- Both Landscaping — A well-maintained and aesthetically pleasing landscape can significantly increase the home's resale and rental value.
Renovation cost estimate screening
| Repair item | Severity | Est. cost |
|---|---|---|
| Kitchen cabinets · The cabinets are dated and could be replaced for a fresh look. | Minor | $500–3,000 |
| Bathroom fixtures · The fixtures are dated and could be replaced for a more modern look. | Minor | $500–3,000 |
| Exterior paint · The paint is faded in some areas and could be refreshed. | Minor | $500–3,000 |
| Flooring · The carpeted flooring is dated and could be replaced with hardwood or tile. | Minor | $500–3,000 |
| Total estimated repair cost · 4 items | $2,000–12,000 |
Value-add ROI direction
- Resale Kitchen renovation — Updating the kitchen with new cabinets and appliances can significantly increase the home's appeal and value. ↑
- Resale Bathroom updates — Replacing dated fixtures and tiles in the bathrooms can enhance the home's appeal and value. ↑
- Both Exterior paint — Refreshing the exterior paint can improve the home's curb appeal and increase its value. ↑
- Both Landscaping — A well-maintained and aesthetically pleasing landscape can significantly increase the home's resale and rental value. ↑
ⓘ Cost ranges are severity-bucket heuristics (US national rule-of-thumb). Get contractor quotes + a written scope before underwriting a rehab budget.
Schools (NCES district)
No district data.
Livability — Castleton
- Score
- 64/100
- State rank
- #66
- US rank
- #14870
Category grades
Schools grade is shown separately in the Schools card above.
Census & demographics
- Population (ZIP)
- 3,632
Population outlook (Rutland County) Hauer SSP2
- Today (2025)
- 55,307 people
- By 2030
- 52,364 · -5.3%
- By 2040
- 45,751 · -17.3%
- By 2050
- 39,627 · -28.4%
- By 2075
- 29,080 · -47.4%
- By 2100
- 20,673 · -62.6%
Race, ethnicity, and origin ACS 2023
- Neighborhood character
- Predominantly White (92%)
- Race & ethnicity
- White 92% Two or more races 5% Hispanic / Latino 4%
- Common ancestry
- Lithuanian 5% Romanian 3% Serbian 3%
- Foreign-born
- 1%
- Languages at home
- 95% English-only · Spanish 3% French/Haitian/Cajun 1%
Political lean MEDSL · Rutland
- 2024 margin
- Lean D (+5.3) · D 51.3% · R 46.0% · Other 2.7%
- 2008→2024 swing
- -19.3pp toward R · 2008: 24.6pp · 2024: 5.3pp
- All cycles
- 2024: D+5.3 2020: D+10.5 2016: D+4.2 2012: D+22.0 2008: D+24.6
Not yet ingested
- Civics
- —
Market trends
- HPI YoY
- ▲ 4.57%
- Current HPI
- 345.6534
- Rent YoY
- —
- Metro
- —
- State GDP YoY
- —
- F500 in state
- 0
Price history
-5.6% since first listed2 events — show timeline
- 2025-11-05 Price Changed $1,190,000 PrimeMLS
- 2025-10-25 Listed $1,260,000 PrimeMLS
Cash-flow waterfall
monthlySold comps — $/sqft
last 12 mo · ≤1 miLoading sold comps…