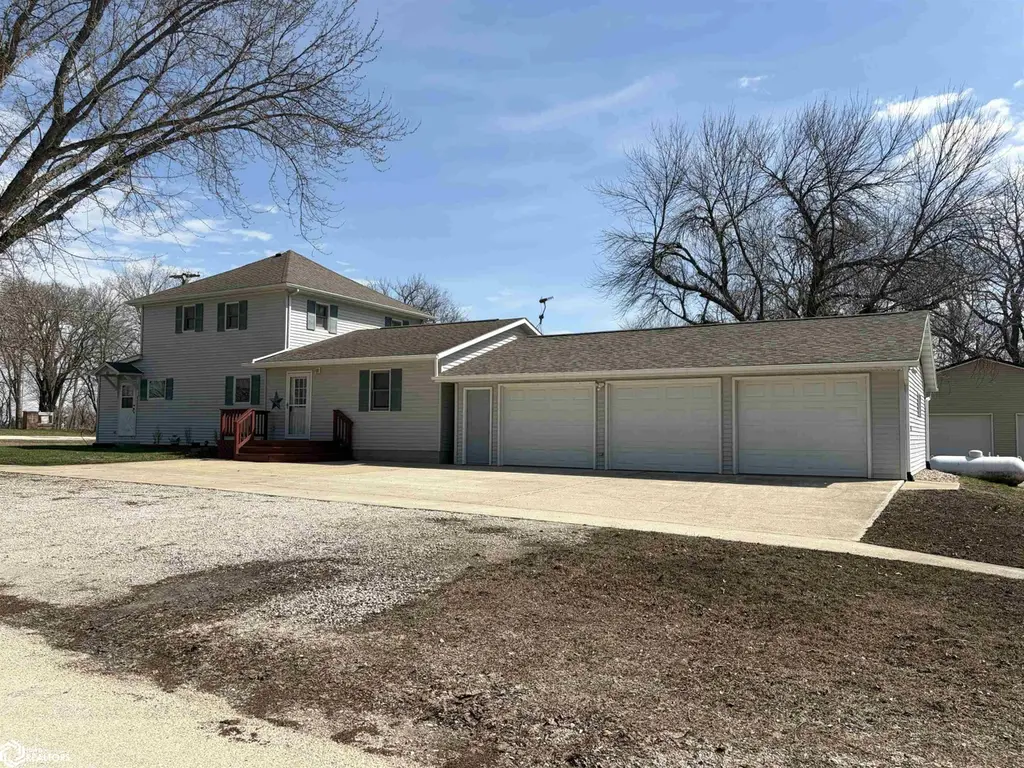
401 1st St. St · Livermore, IA
Flood risk 1/10 · Minimal
- FEMA flood zone
- X (unshaded)
- Chance of flooding over 30 yrs
- 0.0%
- Est. flood insurance / yr
- $473 – $860
Fire risk 3/10 · Minor
- Est. fire insurance / yr
- $902 – $1,676
Heat risk 2/10 · Minimal
- Hot days now (above 101°F)
- 7 days/yr
- Hot days in 30 yrs
- 16 days/yr
Wind risk 2/10 · Minimal
- Chance of severe wind over 30 yrs
- —
Air-quality risk 1/10 · Minimal
- Unhealthy air days now
- 0 days/yr
- Unhealthy air days in 30 yrs
- 0 days/yr
Risk factors via First Street. Map © Google.
Why this score? — see what drove the D+ grade
The composite is a weighted blend of 9 inputs, each scored 0–100. Each bar is that input's sub-score; the figure is the points it added to the 100-point composite (weight × sub-score).
- Cash flow +16.6/30.0
- Appreciation +7.1/10.0
- DSCR +5.2/10.0
- Schools +4.4/10.0
- ARV discount +4.1/15.0
- 1% rule +3.5/10.0
- Livability +3.3/5.0
- Rent growth +2.5/5.0
- Condition / age +2.5/5.0
$149,900
🖨 Deal sheet (PDF) 📄 Offer letter ✓ Due diligence
Listing remarks
STEP INTO TIMELESS CHARM WITH THIS BEAUTIFULLY MAINTAINED 2-STORY HOME, BUILT IN 1945 AND OFFERING APPROXIMATELY 1,680 S/F OF COMFORTABLE LIVING SPACE. FROM THE MOMENT YOU ENTER, YOU'LL APPRECIATE THE CLASSIC HARDWOOD FLOORS IN THE WELCOMING FOYER, SETTING THE TONE FOR THE CHARACTER FOUND THROUGHOUT. THE KITCHEN COMES FULLY EQUIPPED WITH ALL APPLLIANCES INCLUDED, MAKING YOUR MOVE-IN SEAMLESS AND STRESS-FREE. SOME NEWER CARPET UPSTAIRS IN 2025. LP TANK IS OWNED-500 GAL. TANK OUTSIDE, ENJOY A TREATED AND STAINED DECK - PERFECT FOR RELAXING EVENINGS OR ENTERTAINING GUESTS. CAR ENTHUSIASTS, HOBBYISTS, OR ANYONE NEEDING EXTRA SPACE WILL LOVE THE 3-CAR GARAGE. ONE BAY IS HEATED AND FEATURES A H
Key facts
- 3-car garage
- Hardwood floors
- Heated bay
Tags
Neighborhood map
What this means for you Summary
Snapshot
- This is a 4-bed/1.0-bath single-family listed at $150k.
Deal economics
- At list price, monthly cash flow is $92 ($1k/yr) — positive.
- The deal already cash-flows at list — no discount required.
- To meet the 1% rule (rent ≥ 1% of price), the offer needs to be $127k (15.4% below list).
- Recommended offer: $127k (15.4% below list) — sets the bar for 1% rule.
Location & tenants
- Location reads 66/100 on livability (#541 in IA) — a middle-class / working-renter tenant base. Strengths: cost of living A+, housing A+, employment B; Watch: health & safety C-, amenities F, commute F.
- Twin Rivers Community School District (rural): math 60% / reading 40% proficiency, ranked #323 of 330 in IA (top 98%) — acceptable for families but not a draw, mixed tenant base, ~2y average lease.
- Zoned schools: Twin Rivers Elementary School (math 50% / reading 30%, grade F, #578 of 616 statewide, top 94%, 49 students, 41% FRL).
- Market conditions: 4 active listings in the ZIP; 13 units permitted in Humboldt County in 2024 (0 in 5+ unit buildings).
Forward outlook
- In year one you build about $7k of equity ($1k loan paydown + $6k appreciation (4.1% local appreciation)).
- Humboldt County population projected to shrink 9% by 2050 — rents likely to lag national; underwrite the cash flow, not the appreciation.
- At projected returns (4.1% appreciation + 3.0% rent growth), your $42k cash investment doubles in ~5 years — after that, you're playing with house money.
- By year 5, paydown + projected appreciation supports a ~$31k cash-out refi (75% LTV) — recoverable capital for the next deal without selling this one.
Negotiation context
- Only 11 days on market — expect competitive offers; lowballing is unlikely to land.
Risks & watch-outs
- Watch-outs: built in 1945 — expect roof / HVAC / electrical / plumbing capex.
Questions for the listing agent
- Built in 1945 — when were the roof, HVAC, electrical panel, plumbing, and water heater last replaced?
- Is there a deadline driving the sale (1031 exchange, divorce, estate, relocation)? That informs how much negotiation room exists.
- Schools are F-rated, which usually means shorter tenancies and higher turnover. Who's the typical renter profile here, and what's been the actual vacancy rate?
- The area grade is low — what's the realistic commute time and amenity access for the typical tenant pool here? Any planned neighborhood developments (good or bad) we should know about?
- What's the average days-on-market for RENTAL listings here right now (not sales)? A rising rental-DOM trend means longer vacancies and softer asking-rent achievability than the comps imply.
- What's the recent tenant-quality profile in this submarket — average credit score on applications, eviction rate, late-payment / NSF rate, and stable-employment percentage? A property-management company in the area should have these aggregated.
- How much new for-sale + rental construction is in the pipeline within 1–3 miles? Heavy new supply typically softens prices + rents 12–24 months out; constrained supply supports both.
Investment metrics
- 1% rule
- 0.85% ✗
- Cap rate
- 7.03%
- Cash-on-cash
- 2.62%
- DSCR
- 1.12
- GRM
- 9.8
CMA / ARV
- ARV (on-the-fly)
- $139,440
- Comps found
- 4
Show comp detail 4 sales within ~0.75 mi
| Address | Dist | Beds/Ba | Sqft | Sold | Price | $/sf | Match |
|---|---|---|---|---|---|---|---|
| 401 1st St. St | 0.00mi | 4/1.5 | 1,680 (0%) | 1mo | $139,500 | $83 | 97 |
| 502 3rd Avenue Ave | 0.37mi | 3/1.5 (-1) | 1,792 (+7%) | 11mo | $64,900 | $36 | 56 |
| 202 4th St | 0.32mi | 4/1.5 | 1,466 (-13%) | 19mo | $80,000 | $55 | 46 |
| 804 1st St | 0.28mi | 3/2.0 (-1) | 1,436 (-14%) | 12mo | $160,000 | $111 | 44 |
Match score weights: distance 35% · size 25% · config 20% · recency 20%. Top-matched comps best support the ARV.
Projected returns pro-forma
4.13% appreciation · 3.0% rent growth · sell at horizon
- IRR
- 12.9%
- Equity multiple
- 1.79×
- Total profit
- $33,011
- Equity at exit
- $77,167
- IRR
- 14.2%
- Equity multiple
- 3.35×
- Total profit
- $98,490
- Equity at exit
- $127,153
Cash invested: $41,972 (down + closing). Projections, not guarantees.
Landlord ↔ Tenant lean methodology
- Overall (STATE)
- 83 Strongly Landlord-Friendly
- State Iowa
- 83 Strongly Landlord-Friendly · R+6
- County
- — inherits STATE
- City
- — inherits STATE
ZIP-level market 50558
- Home prices YoY
- 3.9%
- Active inventory
- 4
- Price-to-rent
- 9.8×
Monthly cashflow live
- Estimated rent
- $1,269 medium interval (Pro) →
- Mortgage (P&I)
- −$786
- Tax from tax record
- −$62 /mo · $746/yr
- Insurance
- −$62
- HOA
- −$0
- Lot rent
- −$0
- Vacancy / Maint / Mgmt
- −$266
- Net cashflow
- $92
Break-even live
Sensitivity live
| Price | -10% $176 | -5% $134 | +0% $92 | +5% $49 | +10% $7 |
|---|---|---|---|---|---|
| Rent | -10% $-9 | -5% $41 | +0% $92 | +5% $142 | +10% $192 |
| Rate | -1.0pp $167 | -0.5pp $130 | base $92 | +0.5pp $53 | +1.0pp $13 |
UW: 25.0% down · 7.5% · 30yr · 1.5% tax · 5.0% vac · 8.0% maint · 8.0% mgmt
Financing live
Cash to close
- Down payment
- $37,475
- Closing costs
- $4,497
- Reserves months
- —
- Total cash needed
- —
Loan-product check · same deal, 3 products live
Conventional
25% down · 7.5% · 30yr
- Down + closing
- —
- Monthly P&I
- —
- Monthly cashflow
- —
- DSCR
- —
- Eligible?
- —
Personal DTI + credit; lowest rate.
DSCR
20% down · 8.5% · 30yr
- Down + closing
- —
- Monthly P&I
- —
- Monthly cashflow
- —
- DSCR
- —
- Eligible?
- —
No personal income docs; deal must DSCR.
Hard money
10% down · 12.0% · 12mo
- Down + closing
- —
- Monthly P&I
- —
- Monthly cashflow
- —
- DSCR
- —
- Eligible?
- —
Short-term bridge; refi at stabilization.
Listing history 2 events
-
2026-04-26status Pending
-
2026-04-14$149,900 Active
ⓘ Source: listings_history table (triggers on properties + properties_extension) + one-shot
backfill from property_details.listing_events for pre-trigger history.
Tax reassessment forecast IA · Partial reset (capped growth)
- Current annual tax
- $746 · $62/mo
- Projected year-2 tax
- $1,550 · $129/mo
- Expected delta
- +$804/yr (+$67/mo · 107.7%)
ⓘ Screening estimate from a state-policy table — verify with the county assessor before closing.
Climate risk First Street
- Flood 1/10 Low FEMA zone X (unshaded) · 0% chance over 30 yrs
- Wildfire 3/10 Moderate
- Heat 2/10 Low 7 d/yr ≥101°F today · 16 d/yr by 30 yrs out
- Wind 2/10 Low
- Air quality 1/10 Low 0 unhealthy d/yr today · 0 by 30 yrs out
Nearby sold comps map
Loading sold comps map…
Walkable amenities ~0.75 mi
Loading nearby amenities…
Taxation est. · year 1
- Rental income
- $15,224
- − Mortgage interest
- −$8,397
- − Property taxes
- −$746
- − Insurance
- −$750
- − Repairs & maintenance
- −$1,218
- − Management
- −$1,218
- − Depreciation
- −$4,361
- Taxable loss
- −$1,464
- Est. tax savings @ 24.0%
- +$351
- After-tax cash flow
- $1,450/yr
For passive investors: Depreciation is non-cash, so a rental often shows a tax loss while cash-flowing — sheltering income. Rental losses are passive: they offset passive income freely, and up to $25,000/yr can offset ordinary (W-2) income if you actively participate and your MAGI is under $100k (phasing out to $0 by $150k); unused losses carry forward. On sale, claimed depreciation is recaptured at up to 25%, and gains may owe capital-gains tax (a 1031 exchange can defer both). Figures are a year-1 estimate at your 24.0% rate — not tax advice; consult a CPA.
Schools (NCES district)
- District
- Twin Rivers Community School District
- NCES district ID
- 1928200
- Math proficiency
- 60% ▼ -20.00%
- Reading proficiency
- 40% ▼ -40.00%
- Median HH income
- $45,541
- Composite
- 44.42/100
- National rank
- #6104
- State rank
- #323 of 330 in IA
Livability — Livermore
- Score
- 66/100
- State rank
- #541
- US rank
- #12108
Category grades
Schools grade is shown separately in the Schools card above.
Census & demographics
- Census place
- Livermore, IA
- Population (ZIP)
- 745
Population outlook (Humboldt County) Hauer SSP2
- Today (2025)
- 9,265 people
- By 2030
- 9,141 · -1.3%
- By 2040
- 8,904 · -3.9%
- By 2050
- 8,448 · -8.8%
- By 2075
- 7,742 · -16.4%
- By 2100
- 6,414 · -30.8%
Race, ethnicity, and origin ACS 2023
- Neighborhood character
- Predominantly White (90%)
- Race & ethnicity
- White 90% Hispanic / Latino 7% Two or more races 2%
- Hispanic origin (detail)
- Mexican 7%
- Common ancestry
- Portuguese 7% Slovak 3% Lithuanian 1%
- Foreign-born
- 2% · Canada
- Languages at home
- 94% English-only · Spanish 6%
Political lean MEDSL · Humboldt
- 2024 margin
- Solid R (+50.0) · D 24.4% · R 74.4% · Other 1.2%
- 2008→2024 swing
- -35.7pp toward R · 2008: -14.3pp · 2024: -50.0pp
- All cycles
- 2024: R+50.0 2020: R+44.6 2016: R+46.0 2012: R+22.1 2008: R+14.3
Not yet ingested
- Civics
- —
Market trends
- HPI YoY
- ▲ 4.13%
- Current HPI
- 109.1952
- Rent YoY
- —
- Metro
- —
- State GDP YoY
- ▲ 2.48%
- F500 in state
- 4
Industry mix (Fortune 500 HQ in IA)
| Industry | F500 HQs | Revenue |
|---|---|---|
| Financial Services | 1 | $16B |
|
||
| Retail / Convenience | 1 | $15B |
|
||
Price history
2 events — show timeline
- 2026-04-26 Pending — IAR
- 2026-04-14 Listed $149,900 IAR
Property tax history
+0.5%/yrLatest (2019): $746 · +1.6% YoY. Source: county tax records.
Cash-flow waterfall
monthlySold comps — $/sqft
last 12 mo · ≤1 miLoading sold comps…