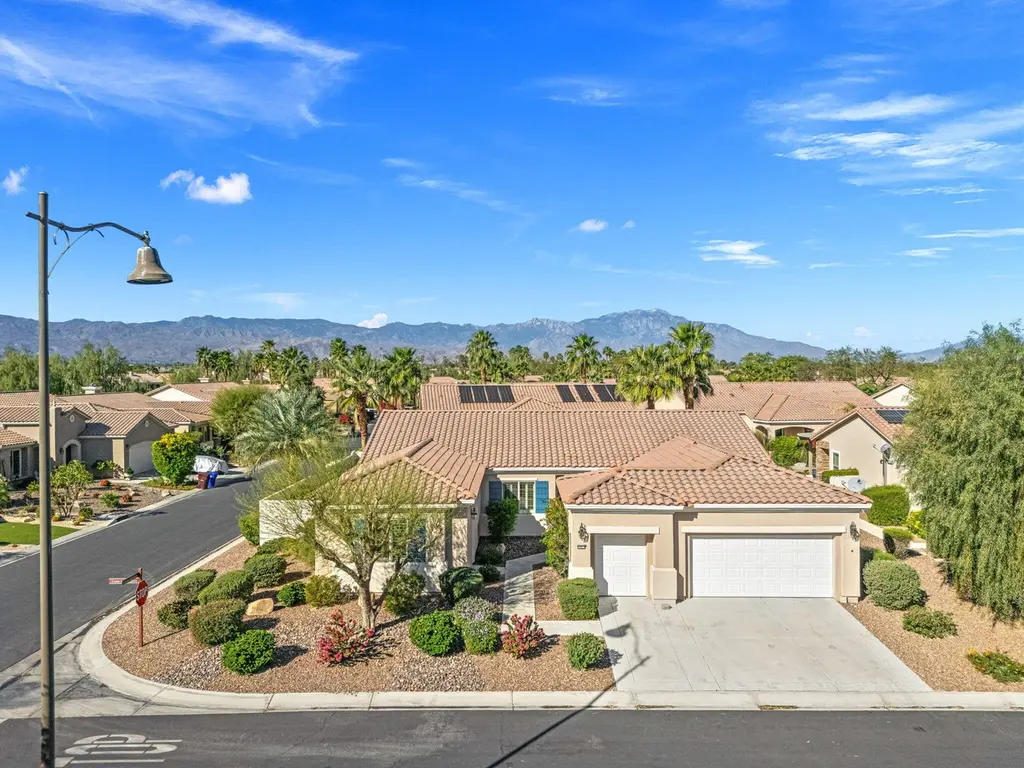
40619 Corte Los Pajaros · Indio, CA
Flood risk 1/10 · Minimal
- FEMA flood zone
- X (shaded)
- Chance of flooding over 30 yrs
- 0.0%
- Est. flood insurance / yr
- $507 – $1,088
Fire risk 6/10 · Moderate
- Est. fire insurance / yr
- $659 – $1,223
Heat risk 9/10 · Severe
- Hot days now (above 114°F)
- 6 days/yr
- Hot days in 30 yrs
- 14 days/yr
Wind risk 1/10 · Minimal
- Chance of severe wind over 30 yrs
- —
Air-quality risk 4/10 · Minor
- Unhealthy air days now
- 5 days/yr
- Unhealthy air days in 30 yrs
- 7 days/yr
Risk factors via First Street. Map © Google.
Why this score? — see what drove the D grade
The composite is a weighted blend of 9 inputs, each scored 0–100. Each bar is that input's sub-score; the figure is the points it added to the 100-point composite (weight × sub-score).
- ARV discount +12.8/15.0
- Cash flow +9.7/30.0
- Rent growth +5.0/5.0
- Schools +3.8/10.0
- 1% rule +3.2/10.0
- DSCR +2.7/10.0
- Livability +2.7/5.0
- Condition / age +2.5/5.0
- Appreciation +0.0/10.0
$539,000
🖨 Deal sheet (PDF) 📄 Offer letter ✓ Due diligence
Listing remarks MLS
Amazing San Miguel Model Located on a great corner lot in the GORGEOUS gated community of Sun City Shadow Hills. 2596 Sq. Ft. of living space with Living Room, Family Room/Formal Dining Area, eat in Kitchen and a Den/office. Primary Suite with Bath, Walk in Closet and great access to the outside. Secondary bedroom is down an extended hallway with its own private entrance. 2 Car Garage plus Golf Car Garage. .. Large rear yard with covered Patio and Water Feature make this an entertainers dream. SCSH offers numerous clubs, organizations, entertainment, trips, and all the Golf, Tennis and Pickleball you can imagine.
Key facts
- Living room
- Eat in kitchen
- Family room
Tags
Neighborhood map
What this means for you Summary
Snapshot
- This is a 2-bed/2.5-bath single-family listed at $539k.
Deal economics
- At list price, monthly cash flow is $-360 ($-4k/yr) — negative.
- To cash-flow at today's rent, offer at most $475k (11.8% below list).
- To meet the 1% rule (rent ≥ 1% of price), the offer needs to be $442k (18.0% below list).
- Recommended offer: $442k (18.0% below list) — sets the bar for 1% rule.
- Cap rate 5.5% vs local median 4.3% in Indio — meaningfully above typical; check what's discounted (condition, days-on-market, listing class) to confirm the premium yield is real.
Location & tenants
- Location reads 53/100 on livability (#927 in CA) — a working-class tenant base; expect higher turnover. Strengths: housing B+; Watch: employment D, crime F, amenities F.
- Desert Sands Unified (suburban): math 31% / reading 56% proficiency, ranked #199 of 517 in CA (top 38%) — families likely to look elsewhere, expect single-tenant / working-renter base with shorter leases.
- Zoned schools: Ronald Reagan Elementary (834 students, 53% FRL); Desert Ridge Academy (math 24% / reading 75%, grade C, #98 of 498 statewide, top 21%, 1,030 students, 81% FRL); Shadow Hills High (math 30% / reading 53%, grade F, #498 of 1,170 statewide, top 43%, 1,751 students, 77% FRL).
- Market conditions: Rents rising fast (+11.6%/yr); 447 active listings in the ZIP; 40 comparable units currently listed for rent nearby; rentals lingering (median 46d on market — plan ~5-8 weeks vacancy on turnover, expect pricing pressure); 65% of comp listings sitting > 30 days — soft ceiling on asking rent; solid renter incomes; 9,195 units permitted in Riverside County in 2024 (1,512 in 5+ unit buildings).
- At $4,420/mo this rent would consume 55% of the median local household income ($97k/yr) (locally 565% of renters already pay >50% of income on rent) — very limited rent-growth headroom before tenants either downsize or default.
Forward outlook
- Local home prices are declining (-3.0%/yr); year-one equity from $4k of loan paydown is wiped out by about $16k of value loss. Plan a longer hold.
- Riverside County population projected at +22% by 2050 — long-run rental-demand tailwind backs the buy-and-hold thesis.
Negotiation context
- It's been on market 110 days — a 9% lower offer ($490k) is reasonable based on typical stale-listing flexibility.
- 3 sale attempts since 20y ago; this cycle's ask has dropped $91k (14%) from the opening price — seller is motivated, your offer sets the floor, not the list.
Risks & watch-outs
- Climate carrying-cost: major wildfire risk; extreme-heat days projected 6→14/yr by 2055 (HVAC capex compounding) — expect insurance premiums to compound above CPI over the hold.
Questions for the listing agent
- What do current leases actually rent for vs. the listed asking? Can we see a recent rent roll and the last 12 months of T-12 income?
- It's been on market 110 days. Have you received any prior offers? Is the seller open to a 18% concession, seller financing, or rate buy-down credit?
- What does the HOA fee cover, when was the last increase, and are there any pending special assessments or reserve-fund shortfalls?
- Why hasn't it sold? Are there any deal-killer items the seller is aware of (foundation, flood, title, zoning, code violations)?
- Is there a deadline driving the sale (1031 exchange, divorce, estate, relocation)? That informs how much negotiation room exists.
- Schools are F-rated, which usually means shorter tenancies and higher turnover. Who's the typical renter profile here, and what's been the actual vacancy rate?
- Crime grade is F in this area — have there been break-ins, vandalism, or insurance claims at this property in the last 3 years? What carrier currently insures it and at what premium?
- The area grade is low — what's the realistic commute time and amenity access for the typical tenant pool here? Any planned neighborhood developments (good or bad) we should know about?
- What's the average days-on-market for RENTAL listings here right now (not sales)? A rising rental-DOM trend means longer vacancies and softer asking-rent achievability than the comps imply.
- What's the recent tenant-quality profile in this submarket — average credit score on applications, eviction rate, late-payment / NSF rate, and stable-employment percentage? A property-management company in the area should have these aggregated.
- How much new for-sale + rental construction is in the pipeline within 1–3 miles? Heavy new supply typically softens prices + rents 12–24 months out; constrained supply supports both.
Investment metrics
- 1% rule
- 0.82% ✗
- Cap rate
- 5.49%
- Cash-on-cash
- -2.86%
- DSCR
- 0.87
- GRM
- 10.2
CMA / ARV
- ARV (median comp)
- $611,289
- List price
- $539,000
- Delta
- -11.83%
- Verdict
- UNDERPRICED
- Comps
- 20 within 1.0 mi
Show comp detail 12 sales within ~0.75 mi
| Address | Dist | Beds/Ba | Sqft | Sold | Price | $/sf | Match |
|---|---|---|---|---|---|---|---|
| 40414 Calle Santa Monica | 0.39mi | 2/2.5 | 2,569 (0%) | 1mo | $680,000 | $265 | 81 |
| 80664 Camino Santa Elise | 0.35mi | 2/2.5 | 2,569 (0%) | 8mo | $556,200 | $217 | 77 |
| 80735 Camino Santa Elise | 0.44mi | 2/2.5 | 2,554 (-1%) | 4mo | $533,000 | $209 | 75 |
| 39-705 Everglades Dr | 0.56mi | 2/2.5 | 2,548 (-1%) | 2mo | $695,990 | $273 | 71 |
| 80630 Camino San Gregorio | 0.30mi | 3/2.5 (+1) | 2,376 (-8%) | 1mo | $527,750 | $222 | 68 |
| 80465 Camino San Mateo | 0.21mi | 3/2.5 (+1) | 2,376 (-8%) | 9mo | $820,000 | $345 | 65 |
| 40111 Camino Montecito | 0.46mi | 3/3.0 (+1) | 2,376 (-8%) | 8mo | $615,000 | $259 | 53 |
| 81138 Avenida Lorena | 0.67mi | 2/2.5 | 2,230 (-13%) | 3mo | $710,000 | $318 | 44 |
| 81083 Avenida Tres Lagunas | 0.68mi | 2/2.5 | 2,230 (-13%) | 4mo | $615,000 | $276 | 43 |
| 81050 Avenida Sombra | 0.64mi | 3/3.5 (+1) | 2,868 (+12%) | 1mo | $1,325,000 | $462 | 41 |
| 81071 Avenida Sombra | 0.65mi | 3/3.5 (+1) | 2,868 (+12%) | 1mo | $593,000 | $207 | 40 |
| 81157 Avenida Los Circos | 0.72mi | 3/3.5 (+1) | 2,868 (+12%) | 6mo | $850,000 | $296 | 34 |
Match score weights: distance 35% · size 25% · config 20% · recency 20%. Top-matched comps best support the ARV.
Projected returns pro-forma
-3.0% appreciation · 8.0% rent growth · sell at horizon
- IRR
- -15.4%
- Equity multiple
- 0.43×
- Total profit
- $-86,744
- Equity at exit
- $80,367
- IRR
- 0.1%
- Equity multiple
- 1.01×
- Total profit
- $1,870
- Equity at exit
- $46,603
Cash invested: $150,920 (down + closing). Projections, not guarantees.
Landlord ↔ Tenant lean methodology
- Overall (STATE)
- 18 Strongly Tenant-Friendly
- State California
- 18 Strongly Tenant-Friendly · D+13
- County
- — inherits STATE
- City
- — inherits STATE
ZIP-level market 92203
- Home prices YoY
- -25.0%
- Rents YoY
- 11.6%
- Active inventory
- 447
- Price-to-rent
- 10.2×
Monthly cashflow live
- Estimated rent
- $4,420 high interval (Pro) →
- Mortgage (P&I)
- −$2,827
- Tax from tax record
- −$403 /mo · $4,838/yr
- Insurance
- −$225
- HOA
- −$397
- Vacancy / Maint / Mgmt
- −$928
- Net cashflow
- $-360
Break-even live
Sensitivity live
| Price | -10% $-55 | -5% $-207 | +0% $-360 | +5% $-512 | +10% $-665 |
|---|---|---|---|---|---|
| Rent | -10% $-709 | -5% $-534 | +0% $-360 | +5% $-185 | +10% $-10 |
| Rate | -1.0pp $-88 | -0.5pp $-223 | base $-360 | +0.5pp $-499 | +1.0pp $-641 |
UW: 25.0% down · 7.5% · 30yr · 1.5% tax · 5.0% vac · 8.0% maint · 8.0% mgmt
Financing live
Cash to close
- Down payment
- $134,750
- Closing costs
- $16,170
- Reserves months
- —
- Total cash needed
- —
Loan-product check · same deal, 3 products live
Conventional
25% down · 7.5% · 30yr
- Down + closing
- —
- Monthly P&I
- —
- Monthly cashflow
- —
- DSCR
- —
- Eligible?
- —
Personal DTI + credit; lowest rate.
DSCR
20% down · 8.5% · 30yr
- Down + closing
- —
- Monthly P&I
- —
- Monthly cashflow
- —
- DSCR
- —
- Eligible?
- —
No personal income docs; deal must DSCR.
Hard money
10% down · 12.0% · 12mo
- Down + closing
- —
- Monthly P&I
- —
- Monthly cashflow
- —
- DSCR
- —
- Eligible?
- —
Short-term bridge; refi at stabilization.
Rent comps 40 comps
| Address | Beds | Baths | Sqft | Rent | $/sqft | DOM | Units | Dist |
|---|---|---|---|---|---|---|---|---|
| 80465 Camino San Mateo Indio, CA | 3.0 | 2.5 | 2376 | $7,500 | $3.16 | 45d | 1 | 0.21mi |
| 80632 Avenida San Ignacio Indio, CA | 3.0 | 2.0 | 2569 | $5,500 | $2.14 | 7d | 1 | 0.21mi |
| 80632 Avenida San Ignacio Indio, CA | 2.0 | 3.0 | 2569 | $5,500 | $2.14 | 45d | 1 | 0.21mi |
| 80646 Avenida San Ignacio Indio, CA | 3.0 | 2.5 | 2376 | $6,600 | $2.78 | 45d | 1 | 0.22mi |
| 80633 Camino San Gregorio Indio, CA | 3.0 | 2.5 | 2376 | $5,600 | $2.36 | 7d | 1 | 0.27mi |
| 80592 Avenida Santa Carmen Indio, CA | 2.0 | 2.5 | 1753 | $2,700 | $1.54 | 45d | 1 | 0.27mi |
| 80188 Camino Santa Elise Indio, CA | 2.0 | 2.0 | 2147 | $2,975 | $1.39 | 45d | 1 | 0.29mi |
| 80635 Camino Santa Elise Indio, CA | 3.0 | 2.5 | 2376 | $5,450 | $2.29 | 45d | 1 | 0.29mi |
| 80741 Avenida Santa Carmen Indio, CA | 3.0 | 2.0 | 2147 | $5,000 | $2.33 | 45d | 1 | 0.30mi |
| 80181 Camino San Mateo Unit NA Indio, CA | 2.0 | 2.0 | 1823 | $3,200 | $1.76 | 45d | 1 | 0.30mi |
| 80586 Camino Santa Juliana Indio, CA | 2.0 | 2.0 | 2147 | $4,500 | $2.10 | 45d | 1 | 0.36mi |
| 80598 Camino Santa Juliana Indio, CA | 3.0 | 2.0 | 1920 | $2,888 | $1.50 | 26d | 1 | 0.37mi |
| 40380 Camino Montecito Indio, CA | 2.0 | 2.0 | 2147 | $2,950 | $1.37 | 45d | 1 | 0.37mi |
| 80818 Avenida San Ignacio Indio, CA | 3.0 | 2.5 | 2376 | $5,500 | $2.31 | 45d | 1 | 0.38mi |
| 80818 Avenida San Ignacio Indio, CA | 3.0 | 3.0 | 2376 | $5,500 | $2.31 | 7d | 1 | 0.38mi |
| 80081 Camino Santa Elise Indio, CA | 2.0 | 2.0 | 2147 | $2,450 | $1.14 | 45d | 1 | 0.40mi |
| 80097 Avenida Santa Olivia Indio, CA | 2.0 | 2.0 | 2147 | $2,800 | $1.30 | 45d | 1 | 0.42mi |
| 40856 Calle Desierto Indio, CA | 3.0 | 3.0 | 2112 | $2,500 | $1.18 | 25d | 1 | 0.59mi |
| 81126 Avenida Lorena Indio, CA | 3.0 | 3.0 | 2112 | $6,000 | $2.84 | 26d | 1 | 0.65mi |
| 81083 Avenida Tres Lagunas Indio, CA | 2.0 | 2.5 | 2230 | $3,600 | $1.61 | 45d | 1 | 0.67mi |
| 81157 Avenida Sombra Indio, CA | 3.0 | 3.5 | 2868 | $6,200 | $2.16 | 45d | 1 | 0.71mi |
| 40087 Corte Azul Indio, CA | 2.0 | 2.0 | 1763 | $2,800 | $1.59 | 18d | 1 | 0.79mi |
| 81074 Avenida Neblina Indio, CA | 3.0 | 3.5 | 2966 | $6,500 | $2.19 | 45d | 1 | 0.82mi |
| 81520 Camino Los Milagros Indio, CA | 3.0 | 3.0 | 2010 | $5,700 | $2.84 | 45d | 1 | 1.08mi |
| 81566 Avenida Sombra Indio, CA | 2.0 | 2.0 | 1763 | $2,245 | $1.27 | 7d | 1 | 1.09mi |
| 79-131 Sangria Ct Indio, CA | 3.0 | 2.0 | 2018 | $3,500 | $1.73 | 45d | 1 | 1.13mi |
| 81562 Camino Los Milagros Indio, CA | 3.0 | 3.0 | 2112 | $6,000 | $2.84 | 45d | 1 | 1.13mi |
| 81592 Camino El Triunfo Indio, CA | 3.0 | 3.5 | 2966 | $7,000 | $2.36 | 45d | 1 | 1.15mi |
| 42655 Delhi Pl Bermuda Dunes, CA | 3.0 | 2.5 | 1988 | $8,000 | $4.02 | 20d | 1 | 1.16mi |
| 81465 Avenida Montura Indio, CA | 3.0 | 3.0 | 2433 | $6,000 | $2.47 | 45d | 1 | 1.22mi |
| 42480 Buccaneer Ct Bermuda Dunes, CA | 3.0 | 3.0 | 3231 | $10,000 | $3.10 | 45d | 1 | 1.23mi |
| 80571 Hoylake Dr Indio, CA | 2.0 | 2.5 | 2172 | $4,200 | $1.93 | 18d | 1 | 1.25mi |
| 81211 Camino Lampazos Indio, CA | 3.0 | 2.0 | 1756 | $3,375 | $1.92 | 18d | 1 | 1.25mi |
| 39613 Taffala Dr Indio, CA | 3.0 | 2.0 | 1904 | $3,595 | $1.89 | 26d | 1 | 1.33mi |
| 43387 Saint Andrews Dr Indio, CA | 2.0 | 2.0 | 1766 | $4,500 | $2.55 | 45d | 1 | 1.37mi |
| 80085 Peak Forest Dr Indio, CA | 3.0 | 2.0 | 1954 | $2,995 | $1.53 | 1d | 1 | 1.39mi |
| 81672 Avenida Viesca Indio, CA | 3.0 | 2.0 | 1756 | $4,500 | $2.56 | 45d | 1 | 1.39mi |
| 81876 Camino Los Milagros Indio, CA | 3.0 | 3.0 | 2014 | $7,500 | $3.72 | 45d | 1 | 1.41mi |
| 37853 Avon St Indio, CA | 3.0 | 2.0 | 2384 | $2,895 | $1.21 | 26d | 1 | 1.41mi |
| 43388 Saint Andrews Dr Indio, CA | 2.0 | 2.0 | 1917 | $3,500 | $1.83 | 45d | 1 | 1.43mi |
HOA detail
- Monthly dues
- $397 · $4,764/yr
- Likely covers
- watersecurity
Listing history 22 events
-
2026-06-21days on market $539,000 Active 110 DOM
-
2026-06-18days on market $539,000 Active 107 DOM
-
2026-06-17days on market $539,000 Active 106 DOM
-
2026-06-16days on market $539,000 Active 105 DOM
-
2026-06-15days on market $539,000 Active 104 DOM
-
2026-06-13days on market $539,000 Active 102 DOM
-
2026-06-09days on market $539,000 Active 98 DOM
-
2026-06-08days on market $539,000 Active 97 DOM
-
2026-06-07days on market $539,000 Active 96 DOM
-
2026-06-04days on market $539,000 Active 93 DOM
-
2026-06-03days on market $539,000 Active 92 DOM
-
2026-06-02days on market $539,000 Active 91 DOM
-
2026-06-01days on market $539,000 Active 90 DOM
-
2026-05-31days on market $539,000 Active 89 DOM
-
2026-04-27price $549,000 620-char remark
Show marketing remark (620 chars)
Amazing San Miguel Model Located on a great corner lot in the GORGEOUS gated community of Sun City Shadow Hills. 2596 Sq. Ft. of living space with Living Room, Family Room/Formal Dining Area, eat in Kitchen and a Den/office. Primary Suite with Bath, Walk in Closet and great access to the outside. Secondary bedroom is down an extended hallway with its own private entrance. 2 Car Garage plus Golf Car Garage. .. Large rear yard with covered Patio and Water Feature make this an entertainers dream. SCSH offers numerous clubs, organizations, entertainment, trips, and all the Golf, Tennis and Pickleball you can imagine.
-
2026-03-15price $599,000 620-char remark
Show marketing remark (620 chars)
Amazing San Miguel Model Located on a great corner lot in the GORGEOUS gated community of Sun City Shadow Hills. 2596 Sq. Ft. of living space with Living Room, Family Room/Formal Dining Area, eat in Kitchen and a Den/office. Primary Suite with Bath, Walk in Closet and great access to the outside. Secondary bedroom is down an extended hallway with its own private entrance. 2 Car Garage plus Golf Car Garage. .. Large rear yard with covered Patio and Water Feature make this an entertainers dream. SCSH offers numerous clubs, organizations, entertainment, trips, and all the Golf, Tennis and Pickleball you can imagine.
-
2026-03-01$629,900 Active 620-char remark
Show marketing remark (620 chars)
Amazing San Miguel Model Located on a great corner lot in the GORGEOUS gated community of Sun City Shadow Hills. 2596 Sq. Ft. of living space with Living Room, Family Room/Formal Dining Area, eat in Kitchen and a Den/office. Primary Suite with Bath, Walk in Closet and great access to the outside. Secondary bedroom is down an extended hallway with its own private entrance. 2 Car Garage plus Golf Car Garage. .. Large rear yard with covered Patio and Water Feature make this an entertainers dream. SCSH offers numerous clubs, organizations, entertainment, trips, and all the Golf, Tennis and Pickleball you can imagine.
-
2006-08-10soldstatus $515,000
-
2006-07-31historical
-
2006-03-20$519,900
-
2006-02-25historical
-
2006-01-24$536,700
ⓘ Source: listings_history table (triggers on properties + properties_extension) + one-shot
backfill from property_details.listing_events for pre-trigger history.
Tax reassessment forecast CA · Resets to sale price
- Current annual tax
- $4,838 · $403/mo
- Projected year-2 tax
- $4,838 · $403/mo
- Expected delta
- $0/yr ($0/mo · -0.0%)
ⓘ Screening estimate from a state-policy table — verify with the county assessor before closing.
Climate risk First Street
- Flood 1/10 Low FEMA zone X (shaded) · 0% chance over 30 yrs
- Wildfire 6/10 Major
- Heat 9/10 Extreme 6 d/yr ≥114°F today · 14 d/yr by 30 yrs out
- Wind 1/10 Low
- Air quality 4/10 Moderate 5 unhealthy d/yr today · 7 by 30 yrs out
Nearby sold comps map
Loading sold comps map…
Walkable amenities ~0.75 mi
Loading nearby amenities…
Taxation est. · year 1
- Rental income
- $53,038
- − Mortgage interest
- −$30,192
- − Property taxes
- −$4,838
- − Insurance
- −$2,695
- − Repairs & maintenance
- −$4,243
- − Management
- −$4,243
- − HOA
- −$4,764
- − Depreciation
- −$15,680
- Taxable loss
- −$13,617
- Est. tax savings @ 24.0%
- +$3,268
- After-tax cash flow
- $-1,047/yr
For passive investors: Depreciation is non-cash, so a rental often shows a tax loss while cash-flowing — sheltering income. Rental losses are passive: they offset passive income freely, and up to $25,000/yr can offset ordinary (W-2) income if you actively participate and your MAGI is under $100k (phasing out to $0 by $150k); unused losses carry forward. On sale, claimed depreciation is recaptured at up to 25%, and gains may owe capital-gains tax (a 1031 exchange can defer both). Figures are a year-1 estimate at your 24.0% rate — not tax advice; consult a CPA.
Schools (NCES district)
- District
- Desert Sands Unified
- NCES district ID
- 0611110
- Math proficiency
- 31% ▼ -4.00%
- Reading proficiency
- 56% ▲ 7.00%
- Median HH income
- $54,957
- Composite
- 37.77/100
- National rank
- #4346
- State rank
- #199 of 517 in CA
Livability — Indio
- Score
- 53/100
- State rank
- #927
- US rank
- #24244
Category grades
Schools grade is shown separately in the Schools card above.
Census & demographics
- Census place
- Indio, CA
- County
- Riverside County · 2,287,001 people
- City population
- 100,560
- Metro
- Riverside-San Bernardino-Ontario, CA
- Population (ZIP)
- 34,735
- Household income
- $97,311
- Rent vs Own
- Severe rent burden
- 565.0
Population outlook (Riverside County) Hauer SSP2
- Today (2025)
- 2,664,475 people
- By 2030
- 2,802,692 · +5.2%
- By 2040
- 3,050,904 · +14.5%
- By 2050
- 3,256,783 · +22.2%
- By 2075
- 3,655,058 · +37.2%
- By 2100
- 3,766,594 · +41.4%
Race, ethnicity, and origin ACS 2023
- Neighborhood character
- Diverse neighborhood (Simpson 0.57)
- Race & ethnicity
- Hispanic / Latino 51% White 41% Two or more races 29% Asian 3% Black 2%
- Hispanic origin (detail)
- Mexican 48%
- Common ancestry
- Italian 3% Lithuanian 2% Romanian 2%
- Foreign-born
- 14% · Canada
- Languages at home
- 64% English-only · Spanish 33% Tagalog/Filipino 1% Other Indo-European 1%
Political lean MEDSL · Riverside
- 2024 margin
- Toss-up / Even · D 48.0% · R 49.3% · Other 2.6%
- 2008→2024 swing
- -3.6pp toward R · 2008: 2.3pp · 2024: -1.3pp
- All cycles
- 2024: R+1.3 2020: D+8.0 2016: D+4.3 2012: R+0.4 2008: D+2.3
Not yet ingested
- Civics
- —
Market trends
- HPI YoY
- ▼ -98.51%
- Current HPI
- 295.6456
- Rent YoY
- ▲ 11.64%
- Metro
- Riverside-San Bernardino-Ontario, CA
- State GDP YoY
- ▲ 3.21%
- F500 in state
- 116
Industry mix (Fortune 500 HQ in CA)
| Industry | F500 HQs | Revenue |
|---|---|---|
| Technology | 27 | $1,492B |
|
||
| Financial Services | 3 | $174B |
|
||
| Retail | 3 | $44B |
|
||
| Insurance | 3 | $26B |
|
||
| Media / Entertainment | 2 | $115B |
|
||
| Pharmaceuticals / Biotech | 2 | $62B |
|
||
Price history
+2.3% since first listed8 events — show timeline
- 2026-04-27 Price Changed $549,000 GPSMLS
- 2026-03-15 Price Changed $599,000 GPSMLS
- 2026-03-01 Listed $629,900 GPSMLS
- 2006-08-10 Sold (Public Records) $515,000 Public Records
- 2006-07-31 Listing Removed — GPSMLS
- 2006-03-20 Listed $519,900 GPSMLS
- 2006-02-25 Listing Removed — GPSMLS
- 2006-01-24 Listed $536,700 GPSMLS
Property tax history
-0.5%/yrLatest (2025): $4,838 · +2.2% YoY. Source: county tax records.
Cash-flow waterfall
monthlySold comps — $/sqft
last 12 mo · ≤1 miLoading sold comps…