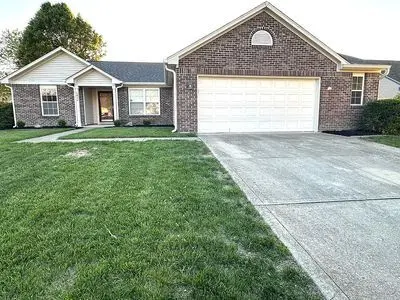
6844 N Abilene Way · McCordsville, IN
Flood risk 1/10 · Minimal
- FEMA flood zone
- X (unshaded)
- Chance of flooding over 30 yrs
- 0.0%
- Est. flood insurance / yr
- $507 – $1,088
Fire risk 1/10 · Minimal
- Est. fire insurance / yr
- $717 – $1,331
Heat risk 3/10 · Minor
- Hot days now (above 100°F)
- 7 days/yr
- Hot days in 30 yrs
- 18 days/yr
Wind risk 2/10 · Minimal
- Chance of severe wind over 30 yrs
- 1.0%
Air-quality risk 2/10 · Minimal
- Unhealthy air days now
- 1 days/yr
- Unhealthy air days in 30 yrs
- 2 days/yr
Risk factors via First Street. Map © Google.
Why this score? — see what drove the D grade
The composite is a weighted blend of 9 inputs, each scored 0–100. Each bar is that input's sub-score; the figure is the points it added to the 100-point composite (weight × sub-score).
- Cash flow +11.4/30.0
- ARV discount +9.1/15.0
- Schools +4.1/10.0
- Rent growth +3.8/5.0
- Livability +3.5/5.0
- DSCR +3.4/10.0
- 1% rule +2.8/10.0
- Condition / age +2.5/5.0
- Appreciation +0.0/10.0
$307,500
🖨 Deal sheet (PDF) 📄 Offer letter ✓ Due diligence
Listing remarks
Completely reimagined and move-in ready, this beautiful, COMPLETELY UPDATED 3-bedroom, 2-bath home blends modern finishes with functional everyday living. The heart of the home is the stunning great room with fireplace that opens to a NEW, eat-in kitchen with brand-new Kraftmade cabinetry, NEW quartz countertops, and a clean, stylish design that's perfect for both entertaining and daily life. Both bathrooms have been thoughtfully renovated with NEW, updated finishes, fixtures, and NEW cabinets, creating spa-like spaces that feel fresh, modern, and inviting. NEW flooring flows throughout the home, creating warmth, durability, and seamless style in every room. A dedicated home office offers f
Key facts
- Quartz countertops
- Renovated bathrooms
- Eat-in kitchen
Tags
Property features AI
Exterior
- Home design: Built in 2001
- Construction: Single-family residence (built 2001)
- Exterior features: Located in the Austin Trace subdivision
Neighborhood map
What this means for you Summary
Snapshot
- This is a 3-bed/2.0-bath single-family listed at $308k.
Deal economics
- At list price, monthly cash flow is $-105 ($-1k/yr) — negative.
- To cash-flow at today's rent, offer at most $289k (6.0% below list).
- To meet the 1% rule (rent ≥ 1% of price), the offer needs to be $238k (22.5% below list).
- Recommended offer: $238k (22.5% below list) — sets the bar for 1% rule.
- Cap rate 5.9% vs local median 3.9% in McCordsville — top-decile yield for the area; either an underpriced asset or a hidden risk that comps aren't pricing in. Stress-test before assuming the spread holds.
Location & tenants
- Location reads 69/100 on livability (#181 in IN) — a middle-class / working-renter tenant base. Strengths: employment A+, cost of living A+, housing A+; Watch: amenities F, commute F, health & safety F.
- Mt Vernon Community School Corporation (rural): math 43% / reading 48% proficiency, ranked #70 of 301 in IN (top 23%) — families likely to look elsewhere, expect single-tenant / working-renter base with shorter leases; only 18% free/reduced lunch — higher-income household profile.
- Market conditions: Rents rising fast (+5.2%/yr); 422 active listings in the ZIP; 13 comparable units currently listed for rent nearby; rentals leasing fast (median 8d on market — plan ~1-2 weeks tenant-placement turnaround); high-income renter base; 1,091 units permitted in Hancock County in 2024 (0 in 5+ unit buildings).
Forward outlook
- Local home prices are declining (-3.0%/yr); year-one equity from $2k of loan paydown is wiped out by about $9k of value loss. Plan a longer hold.
- Hancock County population projected at +7% by 2050 — modest demand growth; plan on rents tracking national, not racing it.
Negotiation context
- Only 4 days on market — expect competitive offers; lowballing is unlikely to land.
Questions for the listing agent
- What do current leases actually rent for vs. the listed asking? Can we see a recent rent roll and the last 12 months of T-12 income?
- What does the HOA fee cover, when was the last increase, and are there any pending special assessments or reserve-fund shortfalls?
- Is there a deadline driving the sale (1031 exchange, divorce, estate, relocation)? That informs how much negotiation room exists.
- Schools are B-rated — typically a magnet for longer-tenancy family renters. What's the average tenant stay here, and is there a school-zone premium baked into asking?
- The area grade is low — what's the realistic commute time and amenity access for the typical tenant pool here? Any planned neighborhood developments (good or bad) we should know about?
- What's the average days-on-market for RENTAL listings here right now (not sales)? A rising rental-DOM trend means longer vacancies and softer asking-rent achievability than the comps imply.
- What's the recent tenant-quality profile in this submarket — average credit score on applications, eviction rate, late-payment / NSF rate, and stable-employment percentage? A property-management company in the area should have these aggregated.
- How much new for-sale + rental construction is in the pipeline within 1–3 miles? Heavy new supply typically softens prices + rents 12–24 months out; constrained supply supports both.
Investment metrics
- 1% rule
- 0.78% ✗
- Cap rate
- 5.88%
- Cash-on-cash
- -1.46%
- DSCR
- 0.94
- GRM
- 10.7
CMA / ARV
- ARV (on-the-fly)
- $318,528
- Comps found
- 12
Show comp detail 12 sales within ~0.75 mi
| Address | Dist | Beds/Ba | Sqft | Sold | Price | $/sf | Match |
|---|---|---|---|---|---|---|---|
| 6664 Dunkirk Dr | 0.21mi | 4/2.0 (+1) | 1,603 (-3%) | 2mo | $329,900 | $206 | 77 |
| 7074 N Lyndhurst Xing | 0.29mi | 3/2.0 | 1,571 (-5%) | 6mo | $282,500 | $180 | 73 |
| 6819 W Wintergreen Ct | 0.50mi | 3/2.0 | 1,692 (+2%) | 1mo | $320,000 | $189 | 73 |
| 6609 Dunkirk Dr | 0.26mi | 4/2.0 (+1) | 1,600 (-4%) | 11mo | $322,000 | $201 | 68 |
| 6830 W Denton Dr | 0.32mi | 3/2.5 | 1,808 (+9%) | 4mo | $250,000 | $138 | 65 |
| 6418 W Oxford Ln | 0.24mi | 3/2.0 | 1,516 (-9%) | 13mo | $282,000 | $186 | 64 |
| 7200 Maidstone Cv | 0.47mi | 3/2.0 | 1,772 (+7%) | 6mo | $430,486 | $243 | 62 |
| 7151 N Stubbington Ln | 0.41mi | 3/2.0 | 1,465 (-12%) | 2mo | $282,000 | $192 | 60 |
| 6729 Birmingham Ave | 0.22mi | 3/2.0 | 1,904 (+15%) | 7mo | $315,000 | $165 | 59 |
| 6644 Aberdeen Dr | 0.45mi | 4/2.0 (+1) | 1,600 (-4%) | 11mo | $310,000 | $194 | 59 |
| 6847 Cardiff Dr | 0.45mi | 3/2.0 | 1,775 (+7%) | 11mo | $329,000 | $185 | 59 |
| 7424 Cindy Dr | 0.68mi | 3/2.0 | 1,791 (+8%) | 0mo | $361,000 | $202 | 55 |
Match score weights: distance 35% · size 25% · config 20% · recency 20%. Top-matched comps best support the ARV.
Projected returns pro-forma
-3.0% appreciation · 5.18% rent growth · sell at horizon
- IRR
- -16.5%
- Equity multiple
- 0.41×
- Total profit
- $-51,205
- Equity at exit
- $45,849
- IRR
- -5.0%
- Equity multiple
- 0.65×
- Total profit
- $-30,452
- Equity at exit
- $26,587
Cash invested: $86,100 (down + closing). Projections, not guarantees.
Landlord ↔ Tenant lean methodology
- Overall (STATE)
- 90 Strongly Landlord-Friendly
- State Indiana
- 90 Strongly Landlord-Friendly · R+11
- County
- — inherits STATE
- City
- — inherits STATE
ZIP-level market 46055
- Home prices YoY
- -20.1%
- Rents YoY
- 5.2%
- Active inventory
- 422
- Price-to-rent
- 10.7×
Monthly cashflow live
- Estimated rent
- $2,384 high interval (Pro) →
- Mortgage (P&I)
- −$1,613
- Tax from tax record
- −$217 /mo · $2,606/yr
- Insurance
- −$128
- HOA
- −$30
- Vacancy / Maint / Mgmt
- −$501
- Net cashflow
- $-105
Break-even live
Sensitivity live
| Price | -10% $69 | -5% $-18 | +0% $-105 | +5% $-192 | +10% $-279 |
|---|---|---|---|---|---|
| Rent | -10% $-293 | -5% $-199 | +0% $-105 | +5% $-11 | +10% $84 |
| Rate | -1.0pp $50 | -0.5pp $-27 | base $-105 | +0.5pp $-184 | +1.0pp $-265 |
UW: 25.0% down · 7.5% · 30yr · 1.5% tax · 5.0% vac · 8.0% maint · 8.0% mgmt
Financing live
Cash to close
- Down payment
- $76,875
- Closing costs
- $9,225
- Reserves months
- —
- Total cash needed
- —
Loan-product check · same deal, 3 products live
Conventional
25% down · 7.5% · 30yr
- Down + closing
- —
- Monthly P&I
- —
- Monthly cashflow
- —
- DSCR
- —
- Eligible?
- —
Personal DTI + credit; lowest rate.
DSCR
20% down · 8.5% · 30yr
- Down + closing
- —
- Monthly P&I
- —
- Monthly cashflow
- —
- DSCR
- —
- Eligible?
- —
No personal income docs; deal must DSCR.
Hard money
10% down · 12.0% · 12mo
- Down + closing
- —
- Monthly P&I
- —
- Monthly cashflow
- —
- DSCR
- —
- Eligible?
- —
Short-term bridge; refi at stabilization.
Rent comps 13 comps
| Address | Beds | Baths | Sqft | Rent | $/sqft | DOM | Units | Dist |
|---|---|---|---|---|---|---|---|---|
| 7044 N Mesquite Ct McCordsville, IN | 3.0 | 2.0 | 2073 | $1,991 | $0.96 | 8d | 1 | 0.29mi |
| 6654 Willow Way McCordsville, IN | 3.0–4.0 | 2.0–2.5 | 1810 | $2,485 | $1.37 | 2d | 10 | 0.39mi |
| 7298 N Kensington Way Unit 6311-213 McCordsville, IN | 2.0 | 2.0 | 1109 | $2,050 | $1.85 | 2d | 1 | 0.48mi |
| 6267 Cypress Ct McCordsville, IN | 3.0 | 2.0 | 1673 | $2,500 | $1.49 | 2d | 1 | 0.55mi |
| N Kensington Way McCordsville, IN | 1.0–2.0 | 1.0–2.0 | 968 | $2,375 | $2.45 | 20d | 6 | 0.63mi |
| 5790 Arcade Blvd McCordsville, IN | 3.0 | 2.5 | 2021 | $2,250 | $1.11 | 20d | 1 | 1.03mi |
| 5811 Main St McCordsville, IN | 1.0–2.0 | 1.0–2.0 | 926 | $2,140 | $2.31 | 2d | 14 | 1.06mi |
| 5871 Broadacre Dr McCordsville, IN | 1.0–3.0 | 1.0–2.0 | 978 | $2,285 | $2.34 | 3d | 150 | 1.06mi |
| 6641 W Jamestown Dr McCordsville, IN | 4.0 | 2.5 | 2035 | $2,195 | $1.08 | 24d | 1 | 1.07mi |
| 7427 Cobblestone West Dr Indianapolis, IN | 3.0 | 2.0 | 1704 | $1,931 | $1.13 | 8d | 1 | 1.10mi |
| 5702 N Jefferson Dr McCordsville, IN | 3.0 | 2.5 | 2093 | $2,086 | $1.00 | 8d | 1 | 1.12mi |
| 5510 Wood Spring Ln McCordsville, IN | 3.0 | 2.5 | 2009 | $2,091 | $1.04 | 22d | 1 | 1.23mi |
| 12030 Bearsdale Dr Indianapolis, IN | 3.0 | 2.5 | 1560 | $2,025 | $1.30 | 24d | 1 | 1.35mi |
HOA detail
- Monthly dues
- $30 · $360/yr
Listing history 4 events
-
2026-06-02status $307,500 Pending 4 DOM
-
2026-06-01days on market $307,500 Active 4 DOM
-
2026-05-31days on market $307,500 Active 3 DOM
-
2026-05-12$315,000 Active
ⓘ Source: listings_history table (triggers on properties + properties_extension) + one-shot
backfill from property_details.listing_events for pre-trigger history.
Tax reassessment forecast IN · Partial reset (capped growth)
- Current annual tax
- $2,606 · $217/mo
- Projected year-2 tax
- $2,610 · $218/mo
- Expected delta
- +$4/yr ($0/mo · 0.1%)
ⓘ Screening estimate from a state-policy table — verify with the county assessor before closing.
Climate risk First Street
- Flood 1/10 Low FEMA zone X (unshaded) · 0% chance over 30 yrs
- Wildfire 1/10 Low
- Heat 3/10 Moderate 7 d/yr ≥100°F today · 18 d/yr by 30 yrs out
- Wind 2/10 Low 100% chance of damaging wind over 30 yrs
- Air quality 2/10 Low 1 unhealthy d/yr today · 2 by 30 yrs out
Nearby sold comps map
Loading sold comps map…
Walkable amenities ~0.75 mi
Loading nearby amenities…
Taxation est. · year 1
- Rental income
- $28,605
- − Mortgage interest
- −$17,225
- − Property taxes
- −$2,606
- − Insurance
- −$1,538
- − Repairs & maintenance
- −$2,288
- − Management
- −$2,288
- − HOA
- −$360
- − Depreciation
- −$8,945
- Taxable loss
- −$6,646
- Est. tax savings @ 24.0%
- +$1,595
- After-tax cash flow
- $338/yr
For passive investors: Depreciation is non-cash, so a rental often shows a tax loss while cash-flowing — sheltering income. Rental losses are passive: they offset passive income freely, and up to $25,000/yr can offset ordinary (W-2) income if you actively participate and your MAGI is under $100k (phasing out to $0 by $150k); unused losses carry forward. On sale, claimed depreciation is recaptured at up to 25%, and gains may owe capital-gains tax (a 1031 exchange can defer both). Figures are a year-1 estimate at your 24.0% rate — not tax advice; consult a CPA.
Schools (NCES district)
- District
- Mt Vernon Community School Corporation
- NCES district ID
- 1807260
- Math proficiency
- 43% ▼ -12.00%
- Reading proficiency
- 48% ▼ -7.00%
- Median HH income
- $73,671
- Composite
- 41.3/100
- National rank
- #3514
- State rank
- #70 of 301 in IN
Livability — McCordsville
- Score
- 69/100
- State rank
- #181
- US rank
- #8388
Category grades
Schools grade is shown separately in the Schools card above.
Census & demographics
- Census place
- McCordsville, IN
- County
- Hancock County · 59,521 people
- City population
- 16,010
- Metro
- Indianapolis-Carmel-Anderson, IN
- Population (ZIP)
- 16,010
- Household income
- $113,784
- Rent vs Own
- Severe rent burden
- 58.0
Population outlook (Hancock County) Hauer SSP2
- Today (2025)
- 77,820 people
- By 2030
- 79,914 · +2.7%
- By 2040
- 82,734 · +6.3%
- By 2050
- 83,348 · +7.1%
- By 2075
- 82,439 · +5.9%
- By 2100
- 74,181 · -4.7%
Race, ethnicity, and origin ACS 2023
- Neighborhood character
- Predominantly White (77%)
- Race & ethnicity
- White 77% Black 13% Two or more races 6% Hispanic / Latino 4% Asian 1%
- Common ancestry
- Lithuanian 3% Italian 3% Romanian 3%
- Foreign-born
- 4% · Canada, Vietnam, Jamaica
- Languages at home
- 94% English-only · Spanish 4%
Political lean MEDSL · Hancock
- 2024 margin
- Solid R (+33.7) · D 32.2% · R 65.9% · Other 1.9%
- 2008→2024 swing
- -4.1pp toward R · 2008: -29.6pp · 2024: -33.7pp
- All cycles
- 2024: R+33.7 2020: R+37.5 2016: R+44.8 2012: R+41.0 2008: R+29.6
Not yet ingested
- Civics
- —
Market trends
- HPI YoY
- ▼ -52.35%
- Current HPI
- 207.9764
- Rent YoY
- ▲ 5.18%
- Metro
- Indianapolis-Carmel-Anderson, IN
- State GDP YoY
- ▲ 2.90%
- F500 in state
- 18
Industry mix (Fortune 500 HQ in IN)
| Industry | F500 HQs | Revenue |
|---|---|---|
| Industrial Machinery | 2 | $37B |
|
||
| Healthcare | 1 | $177B |
|
||
| Pharmaceuticals | 1 | $45B |
|
||
| Metals / Steel | 1 | $18B |
|
||
| Agriculture | 1 | $17B |
|
||
| Packaging | 1 | $12B |
|
||
Price history
1 event — show timeline
- 2026-05-12 Listed $315,000 FSBO.com
Property tax history
+6.8%/yrLatest (2025): $2,606 · -5.8% YoY. Source: county tax records.
Cash-flow waterfall
monthlySold comps — $/sqft
last 12 mo · ≤1 miLoading sold comps…