5732 25th St · Princeton, MN
Flood risk 1/10 · Minimal
- FEMA flood zone
- X (unshaded)
- Chance of flooding over 30 yrs
- 0.0%
- Est. flood insurance / yr
- $473 – $860
Fire risk 4/10 · Minor
- Est. fire insurance / yr
- $888 – $1,650
Heat risk 2/10 · Minimal
- Hot days now (above 97°F)
- 7 days/yr
- Hot days in 30 yrs
- 13 days/yr
Wind risk 2/10 · Minimal
- Chance of severe wind over 30 yrs
- —
Air-quality risk 2/10 · Minimal
- Unhealthy air days now
- 1 days/yr
- Unhealthy air days in 30 yrs
- 1 days/yr
Risk factors via First Street. Map © Google.
Why this score? — see what drove the D grade
The composite is a weighted blend of 9 inputs, each scored 0–100. Each bar is that input's sub-score; the figure is the points it added to the 100-point composite (weight × sub-score).
- Cash flow +14.0/30.0
- ARV discount +7.5/15.0
- DSCR +4.2/10.0
- Schools +4.1/10.0
- Livability +3.4/5.0
- 1% rule +3.3/10.0
- Rent growth +2.5/5.0
- Condition / age +2.5/5.0
- Appreciation +0.0/10.0
$230,000
🖨 Deal sheet (PDF) 📄 Offer letter ✓ Due diligence
Listing remarks MLS
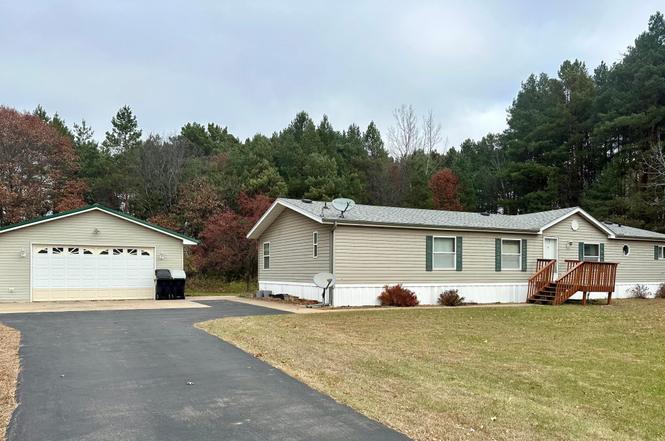
2.25 acres. Lots of trees surrounding property. 3BR 2 BA. Living room & Family room w/ gas fplc, separated by French doors. Open floor plan. Kitchen has skylight for natural light. Built-ins throughout. Septic is compliant
Key facts
- 2.25 acre lot
- 2 garage spots
- Built 1996
Neighborhood map
What this means for you Summary
Snapshot
- This is a 3-bed/2.0-bath single-family listed at $230k.
Deal economics
- At list price, monthly cash flow is $27 ($330/yr) — positive.
- The deal already cash-flows at list — no discount required.
- To meet the 1% rule (rent ≥ 1% of price), the offer needs to be $191k (16.8% below list).
- Recommended offer: $191k (16.8% below list) — sets the bar for 1% rule.
- Cap rate 6.4% vs local median 2.7% in Princeton — top-decile yield for the area; either an underpriced asset or a hidden risk that comps aren't pricing in. Stress-test before assuming the spread holds.
Location & tenants
- Location reads 68/100 on livability (#404 in MN) — a middle-class / working-renter tenant base. Strengths: cost of living A+, housing A+, crime A-; Watch: health & safety D+, employment D, amenities F.
- Princeton Public School District (town): math 41% / reading 53% proficiency, ranked #141 of 301 in MN (top 47%) — families likely to look elsewhere, expect single-tenant / working-renter base with shorter leases.
- Zoned schools: Princeton Intermediate School (math 46% / reading 48%, grade D-, #492 of 857 statewide, top 61%, 746 students, 41% FRL); Princeton Middle School (math 36% / reading 55%, grade D+, #106 of 258 statewide, top 43%, 732 students, 38% FRL); Princeton High School (math 47% / reading 62%, grade C-, #87 of 471 statewide, top 22%, 979 students, 33% FRL) — zoned schools average 37% FRL vs 22% district-wide (15 pts higher); higher-poverty schools than district average — tighter screening recommended.
- Market conditions: 118 active listings in the ZIP; solid renter incomes; 163 units permitted in Mille Lacs County in 2024 (66 in 5+ unit buildings).
Forward outlook
- Local home prices are declining (-3.0%/yr); year-one equity from $2k of loan paydown is wiped out by about $7k of value loss. Plan a longer hold.
- Mille Lacs County population projected at -22% by 2050 — secular population decline; favor cash flow + early exit over multi-decade hold.
Negotiation context
- Only 11 days on market — expect competitive offers; lowballing is unlikely to land.
- 4 sale attempts since 18y ago with the ask held roughly flat each time — persistent listings suggest the price (not the market) is what's stuck; bring a comps-based counter.
- Current owner paid $61k; list at $230k implies a 277% gain — meaningful room to come down on a strong offer.
Questions for the listing agent
- Is there a deadline driving the sale (1031 exchange, divorce, estate, relocation)? That informs how much negotiation room exists.
- Schools are B-rated — typically a magnet for longer-tenancy family renters. What's the average tenant stay here, and is there a school-zone premium baked into asking?
- The area grade is low — what's the realistic commute time and amenity access for the typical tenant pool here? Any planned neighborhood developments (good or bad) we should know about?
- What's the average days-on-market for RENTAL listings here right now (not sales)? A rising rental-DOM trend means longer vacancies and softer asking-rent achievability than the comps imply.
- What's the recent tenant-quality profile in this submarket — average credit score on applications, eviction rate, late-payment / NSF rate, and stable-employment percentage? A property-management company in the area should have these aggregated.
- How much new for-sale + rental construction is in the pipeline within 1–3 miles? Heavy new supply typically softens prices + rents 12–24 months out; constrained supply supports both.
Investment metrics
- 1% rule
- 0.83% ✗
- Cap rate
- 6.44%
- Cash-on-cash
- 0.51%
- DSCR
- 1.02
- GRM
- 10.0
CMA / ARV
No comps found within radius.
Projected returns pro-forma
-3.0% appreciation · 3.0% rent growth · sell at horizon
- IRR
- -15.5%
- Equity multiple
- 0.45×
- Total profit
- $-35,556
- Equity at exit
- $34,294
- IRR
- -7.0%
- Equity multiple
- 0.55×
- Total profit
- $-28,856
- Equity at exit
- $19,886
Cash invested: $64,400 (down + closing). Projections, not guarantees.
Landlord ↔ Tenant lean methodology
- Overall (STATE)
- 46 Balanced
- State Minnesota
- 46 Balanced · D+2
- County
- — inherits STATE
- City
- — inherits STATE
ZIP-level market 55371
- Home prices YoY
- -5.4%
- Active inventory
- 118
- Price-to-rent
- 10.0×
Monthly cashflow live
- Estimated rent
- $1,913 medium interval (Pro) →
- Mortgage (P&I)
- −$1,206
- Tax from tax record
- −$182 /mo · $2,178/yr
- Insurance
- −$96
- HOA
- −$0
- Lot rent
- −$0
- Vacancy / Maint / Mgmt
- −$402
- Net cashflow
- $27
Break-even live
Sensitivity live
| Price | -10% $158 | -5% $93 | +0% $27 | +5% $-38 | +10% $-103 |
|---|---|---|---|---|---|
| Rent | -10% $-124 | -5% $-48 | +0% $27 | +5% $103 | +10% $179 |
| Rate | -1.0pp $143 | -0.5pp $86 | base $27 | +0.5pp $-32 | +1.0pp $-93 |
UW: 25.0% down · 7.5% · 30yr · 1.5% tax · 5.0% vac · 8.0% maint · 8.0% mgmt
Financing live
Cash to close
- Down payment
- $57,500
- Closing costs
- $6,900
- Reserves months
- —
- Total cash needed
- —
Loan-product check · same deal, 3 products live
Conventional
25% down · 7.5% · 30yr
- Down + closing
- —
- Monthly P&I
- —
- Monthly cashflow
- —
- DSCR
- —
- Eligible?
- —
Personal DTI + credit; lowest rate.
DSCR
20% down · 8.5% · 30yr
- Down + closing
- —
- Monthly P&I
- —
- Monthly cashflow
- —
- DSCR
- —
- Eligible?
- —
No personal income docs; deal must DSCR.
Hard money
10% down · 12.0% · 12mo
- Down + closing
- —
- Monthly P&I
- —
- Monthly cashflow
- —
- DSCR
- —
- Eligible?
- —
Short-term bridge; refi at stabilization.
Listing history 10 events
-
2025-11-21status Pending
-
2025-11-10historical Contingent - Inspection
-
2025-11-10$230,000 Active
-
2012-07-10soldstatus $61,000 226-char remark
Show marketing remark (226 chars)
2.25 acres. Lots of trees surrounding property. 3BR 2 BA. Living room & Family room w/ gas fplc, separated by French doors. Open floor plan. Kitchen has skylight for natural light. Built-ins throughout. Septic is compliant
-
2012-06-21historical 226-char remark
Show marketing remark (226 chars)
2.25 acres. Lots of trees surrounding property. 3BR 2 BA. Living room & Family room w/ gas fplc, separated by French doors. Open floor plan. Kitchen has skylight for natural light. Built-ins throughout. Septic is compliant
-
2012-04-13$56,000 226-char remark
Show marketing remark (226 chars)
2.25 acres. Lots of trees surrounding property. 3BR 2 BA. Living room & Family room w/ gas fplc, separated by French doors. Open floor plan. Kitchen has skylight for natural light. Built-ins throughout. Septic is compliant
-
2011-09-19historical
-
2011-05-09$91,200
-
2009-02-16historical
-
2008-08-16$165,000
ⓘ Source: listings_history table (triggers on properties + properties_extension) + one-shot
backfill from property_details.listing_events for pre-trigger history.
Tax reassessment forecast MN · Partial reset (capped growth)
- Current annual tax
- $2,178 · $182/mo
- Projected year-2 tax
- $2,377 · $198/mo
- Expected delta
- +$199/yr (+$17/mo · 9.1%)
ⓘ Screening estimate from a state-policy table — verify with the county assessor before closing.
Climate risk First Street
- Flood 1/10 Low FEMA zone X (unshaded) · 0% chance over 30 yrs
- Wildfire 4/10 Moderate
- Heat 2/10 Low 7 d/yr ≥97°F today · 13 d/yr by 30 yrs out
- Wind 2/10 Low
- Air quality 2/10 Low 1 unhealthy d/yr today · 1 by 30 yrs out
Nearby sold comps map
Loading sold comps map…
Walkable amenities ~0.75 mi
Loading nearby amenities…
Taxation est. · year 1
- Rental income
- $22,951
- − Mortgage interest
- −$12,884
- − Property taxes
- −$2,178
- − Insurance
- −$1,150
- − Repairs & maintenance
- −$1,836
- − Management
- −$1,836
- − Depreciation
- −$6,691
- Taxable loss
- −$3,623
- Est. tax savings @ 24.0%
- +$870
- After-tax cash flow
- $1,199/yr
For passive investors: Depreciation is non-cash, so a rental often shows a tax loss while cash-flowing — sheltering income. Rental losses are passive: they offset passive income freely, and up to $25,000/yr can offset ordinary (W-2) income if you actively participate and your MAGI is under $100k (phasing out to $0 by $150k); unused losses carry forward. On sale, claimed depreciation is recaptured at up to 25%, and gains may owe capital-gains tax (a 1031 exchange can defer both). Figures are a year-1 estimate at your 24.0% rate — not tax advice; consult a CPA.
Schools (NCES district)
- District
- Princeton Public School District
- NCES district ID
- 2730030
- Math proficiency
- 41% ▼ -19.00%
- Reading proficiency
- 53% ▼ -11.00%
- Median HH income
- $61,277
- Composite
- 41.33/100
- National rank
- #3504
- State rank
- #141 of 301 in MN
Livability — Princeton
- Score
- 68/100
- State rank
- #404
- US rank
- #9444
Category grades
Schools grade is shown separately in the Schools card above.
Census & demographics
- County
- Sherburne County · 120,363 people
- City population
- 18,103
- Metro
- Minneapolis-St. Paul-Bloomington, MN-WI
- Population (ZIP)
- 18,103
- Household income
- $93,824
- Rent vs Own
- Severe rent burden
- 273.0
Population outlook (Mille Lacs County) Hauer SSP2
- Today (2025)
- 24,811 people
- By 2030
- 23,960 · -3.4%
- By 2040
- 21,835 · -12.0%
- By 2050
- 19,376 · -21.9%
- By 2075
- 14,838 · -40.2%
- By 2100
- 11,957 · -51.8%
Race, ethnicity, and origin ACS 2023
- Neighborhood character
- Predominantly White (92%)
- Race & ethnicity
- White 92% Two or more races 5% Hispanic / Latino 2%
- Common ancestry
- Portuguese 12% Romanian 3% Lithuanian 3%
- Foreign-born
- 1% · Canada
- Languages at home
- 97% English-only · Spanish 3%
Political lean MEDSL · Mille Lacs
- 2024 margin
- Solid R (+40.9) · D 28.9% · R 69.7% · Other 1.4%
- 2008→2024 swing
- -33.6pp toward R · 2008: -7.2pp · 2024: -40.9pp
- All cycles
- 2024: R+40.9 2020: R+37.8 2016: R+35.8 2012: R+8.6 2008: R+7.2
Not yet ingested
- Civics
- —
Market trends
- HPI YoY
- ▼ -19.20%
- Current HPI
- 336.1604
- Rent YoY
- —
- Metro
- Minneapolis-St. Paul-Bloomington, MN-WI
- State GDP YoY
- ▲ 2.41%
- F500 in state
- 34
Industry mix (Fortune 500 HQ in MN)
| Industry | F500 HQs | Revenue |
|---|---|---|
| Healthcare | 2 | $407B |
|
||
| Retail | 2 | $150B |
|
||
| Consumer Goods | 2 | $32B |
|
||
| Industrial Machinery | 2 | $6B |
|
||
| Agriculture | 1 | $40B |
|
||
| Healthcare / Medical Devices | 1 | $32B |
|
||
Price history
+39.4% since first listed10 events — show timeline
- 2025-11-21 Pending — NORTHSTARMLS as Distributed by MLS Grid
- 2025-11-10 Contingent — NORTHSTARMLS as Distributed by MLS Grid
- 2025-11-10 Listed $230,000 NORTHSTARMLS as Distributed by MLS Grid
- 2012-07-10 Sold (MLS) $61,000 NORTHSTARMLS as Distributed by MLS Grid
- 2012-06-21 Listing Removed — NORTHSTARMLS as Distributed by MLS Grid
- 2012-04-13 Listed $56,000 NORTHSTARMLS as Distributed by MLS Grid
- 2011-09-19 Listing Removed — NORTHSTARMLS as Distributed by MLS Grid
- 2011-05-09 Listed $91,200 NORTHSTARMLS as Distributed by MLS Grid
- 2009-02-16 Listing Removed — NORTHSTARMLS as Distributed by MLS Grid
- 2008-08-16 Listed $165,000 NORTHSTARMLS as Distributed by MLS Grid
Property tax history
+2.4%/yrLatest (2026): $2,178 · +2.1% YoY. Source: county tax records.
Cash-flow waterfall
monthlySold comps — $/sqft
last 12 mo · ≤1 miLoading sold comps…