8101 Resort Village Dr #3909 · Hunters Creek, FL
Flood risk No data
- FEMA flood zone
- —
- Chance of flooding over 30 yrs
- —
- Est. flood insurance / yr
- —
Fire risk No data
- Est. fire insurance / yr
- —
Heat risk No data
- Hot days now (above threshold)
- —
- Hot days in 30 yrs
- —
Wind risk No data
- Chance of severe wind over 30 yrs
- —
Air-quality risk No data
- Unhealthy air days now
- —
- Unhealthy air days in 30 yrs
- —
Risk factors via First Street. Map © Google.
Why this score? — see what drove the D grade
The composite is a weighted blend of 9 inputs, each scored 0–100. Each bar is that input's sub-score; the figure is the points it added to the 100-point composite (weight × sub-score).
- 1% rule +8.6/10.0
- ARV discount +7.5/15.0
- Cash flow +7.1/30.0
- Appreciation +5.1/10.0
- Schools +4.1/10.0
- Livability +3.8/5.0
- Condition / age +2.5/5.0
- Rent growth +1.7/5.0
- DSCR +1.3/10.0
$159,999
🖨 Deal sheet (PDF) 📄 Offer letter ✓ Due diligence
Listing remarks
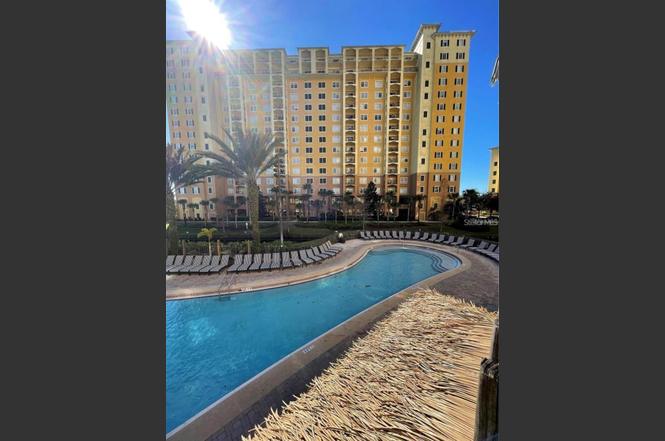
REDUCED TO SELL!!! THE MOST SOUGHT AFTER BUILDING OF THE RESORT BUIDLING 3 , ON THE 9TH FLOOR!!! One of the most sought after condos in this wonderful resort set smack bang in the building by the Grand pool, and water park. LOCATION LOCATION LOCATION. View of pool from a lovely large balcony! This is the most beautifully positioned unit, fully furnished condo, extra large furnished balcony. The two bedroom unit sports 3 TVs, a luxury master bedroom with Jacuzzi bath, granite counter tops, walk in closets. The Resort comes with on site Fitness Center, luxury Spa, Games room, Pizza Hut Express, Frankie Farrell's bar and Lani's Tiki bar. Located right in the heart of Lake Buena Vista. Shutt
Key facts
- Large balcony
- Jacuzzi bath
- View of pool
Tags
Property features AI
Finance
- Other: Furnished; Unit on record as part of a multi-unit building (building number 3); Universal property ID registered
- Financial info: Monthly HOA fee approximately $813.84; Total annual association fees approximately $9,766.08; Lease restrictions apply
- HOA & community: Part of Lake Buena Vista Resort Village association; Monthly association fee includes cable TV, common area taxes, pool, escrow reserves, structure and grounds maintenance, management, recreational facilities, sewer, trash and water; Association amenities include cable TV, fitness center and pool; Association approval not required for sale; Pets not allowed; Deed-restricted community with clubhouse, fitness center, pool, sidewalks and other community restrictions
Exterior
- Parking: Asphalt road access
- Security: Fire sprinkler system
- Utilities: Public water; Public sewer; Cable connected; Electricity available and connected; Phone available; Water connected
- Home design: Residential condo-hotel; Completed condition; South-facing; One level; Located on 9th floor
- Construction: Brick, concrete and stucco construction; Tile roof; Slab foundation; Built as part of a 15-story building
- Exterior features: Balcony; Outdoor lighting; Outdoor grill; Sliding doors; Gunite in-ground pool (heated); Heated in-ground spa
Interior
- Kitchen: Dishwasher; Microwave; Range; Refrigerator; Exhaust fan; Electric water heater
- Bedrooms: 2 bedrooms
- Flooring: Carpet; Ceramic tile
- Bathrooms: 2 full bathrooms
- Heating & cooling: Central heating; Central air
- Interior features: Kitchen and family room combo; Solid surface counters; Thermostat; Blinds; Elevator in building; Fire sprinkler system
- Laundry & utility: Inside laundry in a laundry closet; Washer; Dryer
Neighborhood map
What this means for you Summary
Snapshot
- This is a 2-bed/2.0-bath condo listed at $160k.
Deal economics
- At list price, monthly cash flow is $-229 ($-3k/yr) — negative.
- To cash-flow at today's rent, offer at most $120k (25.3% below list).
- Meets the 1% rule at list price ($2k rent vs $160k).
- Recommended offer: $120k (25.3% below list) — sets the bar for cash-flow.
- Cap rate 4.6% vs local median 3.0% in Hunters Creek — top-decile yield for the area; either an underpriced asset or a hidden risk that comps aren't pricing in. Stress-test before assuming the spread holds.
Location & tenants
- Location reads 76/100 on livability (#222 in FL, #3,277 nationally) — a middle-class / working-renter tenant base. Strengths: crime A+, housing A+, employment A; Watch: commute D, amenities F.
- Orange (suburban): math 46% / reading 51% proficiency, ranked #43 of 73 in FL (top 59%) — families likely to look elsewhere, expect single-tenant / working-renter base with shorter leases.
- Zoned schools: Sunshine Elementary (math 41% / reading 43%, grade F, #1,403 of 2,144 statewide, top 67%, 949 students, 41% FRL); Freedom Middle (math 43% / reading 43%, grade D-, #331 of 571 statewide, top 59%, 1,159 students, 44% FRL); Lake Buena Vista High School (1,714 students, 49% FRL).
- Market conditions: Rents falling (-3.2%/yr); 281 active listings in the ZIP; 40 comparable units currently listed for rent nearby; rentals leasing fast (median 13d on market — plan ~1-2 weeks tenant-placement turnaround); 8,053 units permitted in Orange County in 2024 (3,133 in 5+ unit buildings).
- This rent runs 38% of the median local income ($69k/yr) — at the standard rent-burdened threshold; future hikes will face affordability resistance.
Forward outlook
- In year one you build about $2k of equity ($1k loan paydown + $475 appreciation (0.3% local appreciation)).
- Orange County population projected at +52% by 2050 — long-run rental-demand tailwind backs the buy-and-hold thesis.
Negotiation context
- It's been on market 418 days — a 12% lower offer ($141k) is reasonable based on typical stale-listing flexibility.
Risks & watch-outs
- Watch-outs: HOA is 37% of rent.
Questions for the listing agent
- What do current leases actually rent for vs. the listed asking? Can we see a recent rent roll and the last 12 months of T-12 income?
- It's been on market 418 days. Have you received any prior offers? Is the seller open to a 25% concession, seller financing, or rate buy-down credit?
- What does the HOA fee cover, when was the last increase, and are there any pending special assessments or reserve-fund shortfalls?
- Any open or pending special assessments — roof, HVAC, plumbing, elevator, façade? What's the per-unit balance and payoff schedule, and is the seller paying it off at close or rolling it to the buyer?
- Why hasn't it sold? Are there any deal-killer items the seller is aware of (foundation, flood, title, zoning, code violations)?
- Is there a deadline driving the sale (1031 exchange, divorce, estate, relocation)? That informs how much negotiation room exists.
- Schools are B-rated — typically a magnet for longer-tenancy family renters. What's the average tenant stay here, and is there a school-zone premium baked into asking?
- The area grade is low — what's the realistic commute time and amenity access for the typical tenant pool here? Any planned neighborhood developments (good or bad) we should know about?
- What's the average days-on-market for RENTAL listings here right now (not sales)? A rising rental-DOM trend means longer vacancies and softer asking-rent achievability than the comps imply.
- What's the recent tenant-quality profile in this submarket — average credit score on applications, eviction rate, late-payment / NSF rate, and stable-employment percentage? A property-management company in the area should have these aggregated.
- How much new apartment / multifamily construction is in the pipeline within 1–3 miles? Heavy new supply (>2% of stock underway) typically softens rents 12–24 months out; light construction supports rent growth.
Investment metrics
- 1% rule
- 1.36% ✓
- Cap rate
- 4.57%
- Cash-on-cash
- -6.14%
- DSCR
- 0.73
- GRM
- 6.1
CMA / ARV
No comps found within radius.
Projected returns pro-forma
0.3% appreciation · 0.0% rent growth · sell at horizon
- IRR
- -11.0%
- Equity multiple
- 0.49×
- Total profit
- $-22,870
- Equity at exit
- $48,847
- IRR
- -8.4%
- Equity multiple
- 0.16×
- Total profit
- $-37,620
- Equity at exit
- $60,658
Cash invested: $44,800 (down + closing). Projections, not guarantees.
Landlord ↔ Tenant lean methodology
- Overall (STATE)
- 87 Strongly Landlord-Friendly
- State Florida
- 87 Strongly Landlord-Friendly · R+3
- County
- — inherits STATE
- City
- — inherits STATE
ZIP-level market 32821
- Home prices YoY
- 0.1%
- Rents YoY
- -3.2%
- Active inventory
- 281
- Price-to-rent
- 6.1×
Monthly cashflow live
- Estimated rent
- $2,183 high interval (Pro) →
- Mortgage (P&I)
- −$839
- Tax from tax record
- −$235 /mo · $2,822/yr
- Insurance
- −$67
- HOA
- −$813
- Vacancy / Maint / Mgmt
- −$458
- Net cashflow
- $-229
Break-even live
Sensitivity live
| Price | -10% $-139 | -5% $-184 | +0% $-229 | +5% $-274 | +10% $-320 |
|---|---|---|---|---|---|
| Rent | -10% $-402 | -5% $-315 | +0% $-229 | +5% $-143 | +10% $-57 |
| Rate | -1.0pp $-149 | -0.5pp $-188 | base $-229 | +0.5pp $-271 | +1.0pp $-313 |
UW: 25.0% down · 7.5% · 30yr · 1.5% tax · 5.0% vac · 8.0% maint · 8.0% mgmt
Financing live
Cash to close
- Down payment
- $40,000
- Closing costs
- $4,800
- Reserves months
- —
- Total cash needed
- —
Loan-product check · same deal, 3 products live
Conventional
25% down · 7.5% · 30yr
- Down + closing
- —
- Monthly P&I
- —
- Monthly cashflow
- —
- DSCR
- —
- Eligible?
- —
Personal DTI + credit; lowest rate.
DSCR
20% down · 8.5% · 30yr
- Down + closing
- —
- Monthly P&I
- —
- Monthly cashflow
- —
- DSCR
- —
- Eligible?
- —
No personal income docs; deal must DSCR.
Hard money
10% down · 12.0% · 12mo
- Down + closing
- —
- Monthly P&I
- —
- Monthly cashflow
- —
- DSCR
- —
- Eligible?
- —
Short-term bridge; refi at stabilization.
Rent comps 40 comps
| Address | Beds | Baths | Sqft | Rent | $/sqft | DOM | Units | Dist |
|---|---|---|---|---|---|---|---|---|
| 8097 Poinciana Blvd Orlando, FL | 1.0–3.0 | 1.0–2.0 | 1075 | $2,394 | $2.23 | 0d | 29 | 0.07mi |
| 6011 Vineland Resort Way Orlando, FL | 1.0–3.0 | 1.0–2.0 | 1082 | $2,146 | $1.98 | 0d | 14 | 0.11mi |
| 7261 Crossroads Garden Dr Orlando, FL | 3.0 | 1.0–2.0 | 981 | $2,280 | $2.32 | 0d | 20 | 0.38mi |
| 4950 Lunar Ln Kissimmee, FL | 3.0 | 1.0–3.0 | 981 | $2,961 | $3.02 | 0d | 43 | 0.57mi |
| 14051 International Dr Orlando, FL | 1.0–3.0 | 1.0–2.0 | 1115 | $2,444 | $2.19 | 0d | 48 | 0.57mi |
| 3285 Peace Pipe Dr Kissimmee, FL | 3.0 | 2.0 | 1377 | $1,900 | $1.38 | 25d | 1 | 0.57mi |
| 5270 Warrior Ln Kissimmee, FL | 3.0 | 2.0 | 1123 | $1,995 | $1.78 | 25d | 1 | 0.67mi |
| 5212 Broken Arrow Dr Kissimmee, FL | 3.0 | 2.0 | 1377 | $2,250 | $1.63 | 25d | 1 | 0.71mi |
| 3251 Prime Park Cir Kissimmee, FL | 1.0–3.0 | 1.0–2.0 | 1020 | $2,096 | $2.05 | 0d | 21 | 0.82mi |
| 4865 Big Pine Loop Kissimmee, FL | 3.0 | 1.0–2.0 | 1023 | $2,955 | $2.89 | 16d | 127 | 0.83mi |
| 4865 Big Pine Loop Kissimmee, FL | 3.0 | 1.0–2.0 | 1023 | $2,827 | $2.76 | 4d | 320 | 0.83mi |
| 14501 Gateway Point Cir Orlando, FL | 1.0–4.0 | 1.0–2.0 | 1023 | $1,849 | $1.81 | 0d | 19 | 0.85mi |
| 5316 Barefoot Path Kissimmee, FL | 3.0 | 2.0 | 1410 | $2,100 | $1.49 | 25d | 1 | 0.91mi |
| 4741 Clock Tower Dr #107 Kissimmee, FL | 2.0 | 2.0 | 1186 | $2,800 | $2.36 | 25d | 1 | 0.98mi |
| 4701 Luminous Loop Kissimmee, FL | 1.0–3.0 | 1.0–2.0 | 973 | $1,978 | $2.03 | 0d | 34 | 1.01mi |
| 5087 Dominica Dr Kissimmee, FL | 2.0 | 2.5 | 1304 | $1,650 | $1.27 | 25d | 1 | 1.01mi |
| 5279 Images Cir #207 Kissimmee, FL | 2.0 | 1.0 | 774 | $979 | $1.26 | 25d | 1 | 1.02mi |
| 5095 Dominica Dr Kissimmee, FL | 2.0 | 3.0 | 1304 | $2,400 | $1.84 | 0d | 1 | 1.02mi |
| 5095 Dominica Dr Kissimmee, FL | 2.0 | 3.0 | 1304 | $2,400 | $1.84 | 12d | 1 | 1.02mi |
| 3111 Paradox Cir Unit 1018148P Kissimmee, FL | 3.0 | 2.0 | 1184 | $3,391 | $2.86 | 0d | 1 | 1.03mi |
| 3087 Seaview Castle Dr Unit 1549038P Kissimmee, FL | 3.0 | 3.0 | 1463 | $3,742 | $2.56 | 5d | 1 | 1.04mi |
| 4721 Clock Tower Dr Unit 1359866P Kissimmee, FL | 2.0 | 2.0 | 1184 | $3,280 | $2.77 | 4d | 1 | 1.04mi |
| 5283 Images Cir #304 Kissimmee, FL | 2.0 | 2.0 | 969 | $1,600 | $1.65 | 25d | 1 | 1.05mi |
| 5283 Images Cir #304 Kissimmee, FL | 2.0 | 2.0 | 969 | $1,600 | $1.65 | 12d | 1 | 1.05mi |
| 5002 Mangrove Aly #104 Kissimmee, FL | 2.0 | 2.0 | 1066 | $1,749 | $1.64 | 12d | 1 | 1.05mi |
| 5116 Dominica Dr Kissimmee, FL | 3.0 | 3.0 | 1394 | $2,100 | $1.51 | 0d | 1 | 1.06mi |
| 3120 Paradox Cir #108 Kissimmee, FL | 3.0 | 2.0 | 1329 | $2,600 | $1.96 | 25d | 1 | 1.08mi |
| 5299 Images Cir Kissimmee, FL | 1.0–3.0 | 1.0–3.0 | 1027 | $1,592 | $1.55 | 0d | 14 | 1.10mi |
| 3191 Paradox Cir Unit 205 Kissimmee, FL | 2.0 | 2.5 | 1126 | $2,500 | $2.22 | 25d | 1 | 1.10mi |
| 2954 Sadina St Kissimmee, FL | 2.0 | 2.5 | 885 | $1,500 | $1.69 | 4d | 2 | 1.12mi |
| 5404 Paradise Cay Cir Kissimmee, FL | 3.0 | 2.5 | 1364 | $2,000 | $1.47 | 25d | 1 | 1.13mi |
| 3171 Paradox Cir Unit 1UNIT 103 Kissimmee, FL | 2.0 | 2.0 | 1181 | $2,250 | $1.91 | 25d | 1 | 1.14mi |
| 3151 Paradox Cir Unit 1UNIT 202 Kissimmee, FL | 2.0 | 2.0 | 1181 | $2,700 | $2.29 | 25d | 1 | 1.16mi |
| 5492 Paradise Cay Cir Kissimmee, FL | 3.0 | 3.0 | 1337 | $2,200 | $1.65 | 25d | 1 | 1.21mi |
| 1110 Spaceport Ct Kissimmee, FL | 2.0 | 2.0 | 1052 | $2,000 | $1.90 | 25d | 1 | 1.21mi |
| 5311 Paradise Cay Cir Kissimmee, FL | 3.0 | 3.0 | 1187 | $1,700 | $1.43 | 9d | 1 | 1.21mi |
| 1024 Baseball and Boardwalk Ct Kissimmee, FL | 2.0 | 2.0 | 1052 | $2,000 | $1.90 | 25d | 1 | 1.23mi |
| 8815 Worldquest Blvd #2403 Orlando, FL | 2.0 | 2.0 | 1178 | $2,100 | $1.78 | 19d | 1 | 1.25mi |
| 15050 Ember Springs Cir Orlando, FL | 1.0–3.0 | 1.0–3.0 | 1066 | $1,938 | $1.82 | 0d | 29 | 1.33mi |
| 2904 Edenshire Way #106 Kissimmee, FL | 3.0 | 2.0 | 1300 | $2,650 | $2.04 | 25d | 1 | 1.35mi |
HOA detail condo
- Monthly dues
- $813 · $9,756/yr
- Likely covers
- waterpoolgym
- Assessments
- None detected in remarks — confirm with the listing agent.
Listing history 17 events
-
2026-06-21days on market $159,999 Active 418 DOM
-
2026-06-18days on market $159,999 Active 415 DOM
-
2026-06-17days on market $159,999 Active 414 DOM
-
2026-06-16days on market $159,999 Active 413 DOM
-
2026-06-15days on market $159,999 Active 412 DOM
-
2026-06-13days on market $159,999 Active 410 DOM
-
2026-06-13days on market $159,999 Active 409 DOM
-
2026-06-09days on market $159,999 Active 406 DOM
-
2026-06-08days on market $159,999 Active 405 DOM
-
2026-06-07days on market $159,999 Active 404 DOM
-
2026-06-04days on market $159,999 Active 401 DOM
-
2026-06-03days on market $159,999 Active 400 DOM
-
2026-06-02days on market $159,999 Active 399 DOM
-
2026-06-02days on market $159,999 Active 398 DOM
-
2026-05-31days on market $159,999 Active 397 DOM
-
2026-05-04price $159,999
-
2025-04-29$175,000 Active
ⓘ Source: listings_history table (triggers on properties + properties_extension) + one-shot
backfill from property_details.listing_events for pre-trigger history.
Tax reassessment forecast FL · Resets to sale price
- Current annual tax
- $2,822 · $235/mo
- Projected year-2 tax
- $2,822 · $235/mo
- Expected delta
- $0/yr ($0/mo · 0.0%)
ⓘ Screening estimate from a state-policy table — verify with the county assessor before closing.
Nearby sold comps map
Loading sold comps map…
Walkable amenities ~0.75 mi
Loading nearby amenities…
Taxation est. · year 1
- Rental income
- $26,200
- − Mortgage interest
- −$8,962
- − Property taxes
- −$2,822
- − Insurance
- −$800
- − Repairs & maintenance
- −$2,096
- − Management
- −$2,096
- − HOA
- −$9,756
- − Depreciation
- −$4,655
- Taxable loss
- −$4,987
- Est. tax savings @ 24.0%
- +$1,197
- After-tax cash flow
- $-1,552/yr
For passive investors: Depreciation is non-cash, so a rental often shows a tax loss while cash-flowing — sheltering income. Rental losses are passive: they offset passive income freely, and up to $25,000/yr can offset ordinary (W-2) income if you actively participate and your MAGI is under $100k (phasing out to $0 by $150k); unused losses carry forward. On sale, claimed depreciation is recaptured at up to 25%, and gains may owe capital-gains tax (a 1031 exchange can defer both). Figures are a year-1 estimate at your 24.0% rate — not tax advice; consult a CPA.
Schools (NCES district)
- District
- Orange
- NCES district ID
- 1201440
- Math proficiency
- 46% ▼ -9.00%
- Reading proficiency
- 51% ▼ -2.00%
- Median HH income
- $49,350
- Composite
- 41.47/100
- National rank
- #3461
- State rank
- #43 of 73 in FL
Livability — Hunters Creek
- Score
- 76/100
- State rank
- #222
- US rank
- #3277
Category grades
Schools grade is shown separately in the Schools card above.
Census & demographics
- County
- Orange County · 1,471,359 people
- Metro
- Orlando-Kissimmee-Sanford, FL
- Population (ZIP)
- 26,161
- Household income
- $69,348
- Rent vs Own
- Severe rent burden
- 1840.0
Population outlook (Orange County) Hauer SSP2
- Today (2025)
- 1,618,226 people
- By 2030
- 1,787,404 · +10.5%
- By 2040
- 2,125,621 · +31.4%
- By 2050
- 2,454,016 · +51.6%
- By 2075
- 3,173,711 · +96.1%
- By 2100
- 3,607,781 · +122.9%
Race, ethnicity, and origin ACS 2023
- Neighborhood character
- Diverse neighborhood (Simpson 0.65)
- Race & ethnicity
- White 43% Hispanic / Latino 41% Two or more races 19% Black 6% Asian 3% Pacific Islander 1% Native American 1%
- Hispanic origin (detail)
- Mexican 3% Puerto Rican 11% Cuban 1% Dominican 4%
- Common ancestry
- Romanian 3% Lithuanian 2% Estonian 2%
- Foreign-born
- 29% · Canada, Jamaica, China
- Languages at home
- 58% English-only · Spanish 32% Other Indo-European 4% Other Asian/Pacific 2%
Political lean MEDSL · Orange
- 2024 margin
- D (+13.6) · D 56.1% · R 42.5% · Other 1.3%
- 2008→2024 swing
- -5.0pp toward R · 2008: 18.6pp · 2024: 13.6pp
- All cycles
- 2024: D+13.6 2020: D+23.1 2016: D+24.6 2012: D+18.2 2008: D+18.6
Not yet ingested
- Civics
- —
Market trends
- HPI YoY
- ▲ 0.30%
- Current HPI
- 300.2268
- Rent YoY
- ▼ -3.20%
- Metro
- Orlando-Kissimmee-Sanford, FL
- State GDP YoY
- ▲ 3.28%
- F500 in state
- 36
Industry mix (Fortune 500 HQ in FL)
| Industry | F500 HQs | Revenue |
|---|---|---|
| Industrial Technology | 2 | $29B |
|
||
| Insurance | 2 | $17B |
|
||
| Retail | 1 | $60B |
|
||
| Technology Distribution | 1 | $58B |
|
||
| Homebuilding | 1 | $35B |
|
||
| Technology Manufacturing | 1 | $35B |
|
||
Price history
-8.6% since first listed2 events — show timeline
- 2026-05-04 Price Changed $159,999 Stellar MLS as Distributed by MLS Grid
- 2025-04-29 Listed $175,000 Stellar MLS as Distributed by MLS Grid
Property tax history
+3.4%/yrLatest (2025): $2,822 · -4.1% YoY. Source: county tax records.
Cash-flow waterfall
monthlySold comps — $/sqft
last 12 mo · ≤1 miLoading sold comps…