 🏷️ Likely Rental
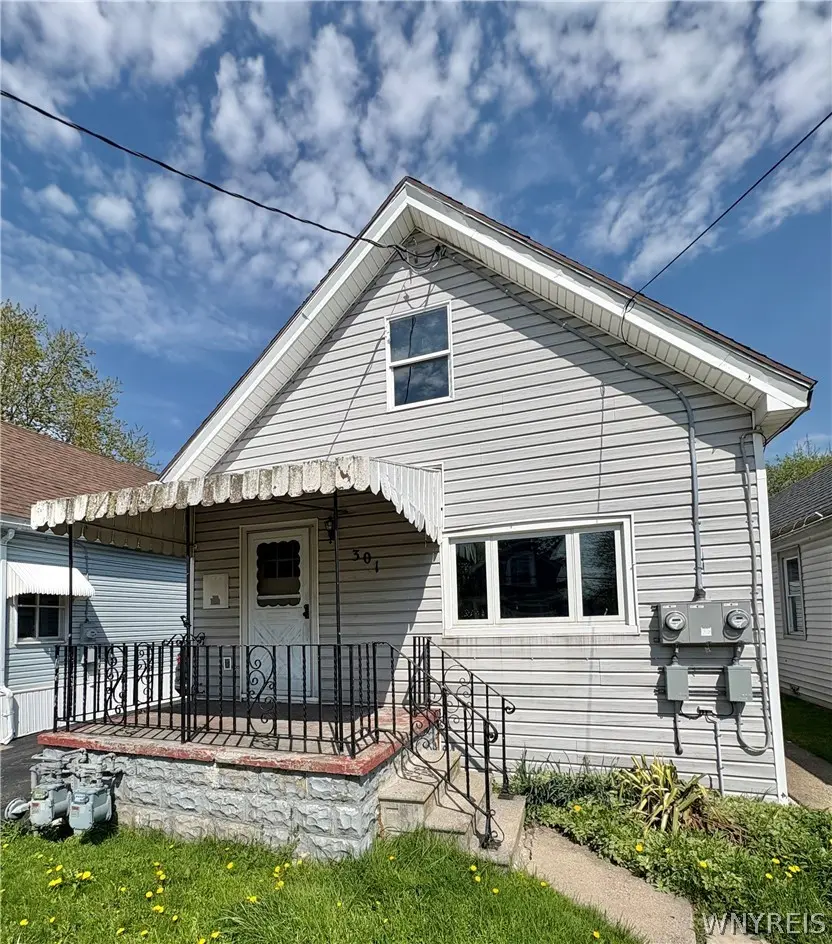
301 Davey St · Buffalo, NY
Flood risk 3/10 · Minor
- FEMA flood zone
- X (unshaded)
- Chance of flooding over 30 yrs
- 0.2%
- Est. flood insurance / yr
- $507 – $1,088
Fire risk 1/10 · Minimal
- Est. fire insurance / yr
- $691 – $1,283
Heat risk 3/10 · Minor
- Hot days now (above 92°F)
- 7 days/yr
- Hot days in 30 yrs
- 15 days/yr
Wind risk 1/10 · Minimal
- Chance of severe wind over 30 yrs
- —
Air-quality risk 3/10 · Minor
- Unhealthy air days now
- 2 days/yr
- Unhealthy air days in 30 yrs
- 3 days/yr
Risk factors via First Street. Map © Google.
Why this score? — see what drove the B grade
The composite is a weighted blend of 9 inputs, each scored 0–100. Each bar is that input's sub-score; the figure is the points it added to the 100-point composite (weight × sub-score).
- Cash flow +23.9/30.0
- ARV discount +15.0/15.0
- Appreciation +9.0/10.0
- DSCR +7.7/10.0
- 1% rule +4.9/10.0
- Livability +3.9/5.0
- Schools +3.3/10.0
- Rent growth +2.5/5.0
- Condition / age +2.5/5.0
$155,000
🖨 Deal sheet 📄 Offer letter ✓ Due diligence
Listing remarks
Welcome to 301 Davey Street in Buffalo, NY. This is an opportunity to own 2 single family houses on 1 lot. The front house is vacant and the back house is currently tenant occupied. The tenant in the back house wishes to stay. This house presents the unique opportunity to have 2 occupants on 1 parcel but not right on top of each other. The front unit features 4 bedrooms, 1.5 bathrooms. kitchen, living room, and a dining room. The back unit features 3 bedrooms, 1 bathroom, living room, and full kitchen. This is the perfect opportunity to owner occupy 1 unit and rent out the other or rent out both units. Pride of ownership best describes the property. The back house is fully fenced in to prov
Key facts
- 1 lot
- Tenant occupied
- Private living space
Tags
Property features AI
Finance
- Financial info: Two-unit property with separate gas and electric meters for each unit; Unit 1 reported rent: $1,000; Unit 2 rent information: see remarks; Owner pays: water (and other items per remarks); Operating expense details: see remarks
Exterior
- Parking: No driveway
- Utilities: Public water connected; Sewer connected
- Home design: Single-story building; Existing/resale property
- Construction: Construction details: see remarks
- Exterior features: Rectangular lot (approx. 30 x 134 feet)
Interior
- Bedrooms: Unit 1: 3 bedrooms; Unit 2: 4 bedrooms
- Flooring: Carpet; Varies
- Bathrooms: Two full bathrooms and one half bathroom (building total); Unit 1: 1 full bathroom; Unit 2: 1 full bathroom and 1 half bathroom
- Heating & cooling: Gas forced-air heating; Has heating
- Interior features: Carpet and varied flooring throughout; Crawl space basement
- Laundry & utility: Gas water heater
Neighborhood map
What this means for you Summary
Snapshot
- This is a 4-bed/1.0-bath other listed at $155k.
Deal economics
- At list price, monthly cash flow is $302 ($4k/yr) — positive.
- The deal already cash-flows at list — no discount required.
- To meet the 1% rule (rent ≥ 1% of price), the offer needs to be $153k (1.2% below list).
- Recommended offer: $150k (3.0% below list) — sets the bar for market timing.
Location & tenants
- Location reads 77/100 on livability (#195 in NY, #3,011 nationally) — a middle-class / working-renter tenant base. Strengths: commute A+, housing A+, health & safety A+; Watch: crime F, employment D-.
- Buffalo City School District (urban): math 41% / reading 40% proficiency, ranked #535 of 590 in NY (top 91%) — families likely to look elsewhere, expect single-tenant / working-renter base with shorter leases; 75% free/reduced lunch — lower-income household profile, screen leases tightly.
- Market conditions: 169 active listings in the ZIP; 9 comparable units currently listed for rent nearby; rentals at typical pace (median 17d on market — plan ~3-4 weeks tenant-placement turnaround); 1,244 units permitted in Erie County in 2024 (563 in 5+ unit buildings).
- This rent runs 36% of the median local income ($50k/yr) — at the standard rent-burdened threshold; future hikes will face affordability resistance.
Forward outlook
- In year one you build about $14k of equity ($1k loan paydown + $12k appreciation (8.1% local appreciation)).
- At projected returns (8.1% appreciation + 3.0% rent growth), your $43k cash investment doubles in ~3 years — after that, you're playing with house money.
- By year 3, paydown + projected appreciation supports a ~$34k cash-out refi (75% LTV) — recoverable capital for the next deal without selling this one.
Negotiation context
- It's been on market 38 days — a 3% lower offer ($150k) is reasonable based on typical stale-listing flexibility.
- 2 sale attempts with the ask held roughly flat each time — persistent listings suggest the price (not the market) is what's stuck; bring a comps-based counter.
- Current owner paid $18k; list at $155k implies a 761% gain — meaningful room to come down on a strong offer.
Risks & watch-outs
- Watch-outs: built in 1900 — expect roof / HVAC / electrical / plumbing capex.
Questions for the listing agent
- It's been on market 38 days. Have you received any prior offers? Is the seller open to a 3% concession, seller financing, or rate buy-down credit?
- Built in 1900 — when were the roof, HVAC, electrical panel, plumbing, and water heater last replaced?
- Is there a deadline driving the sale (1031 exchange, divorce, estate, relocation)? That informs how much negotiation room exists.
- Crime grade is F in this area — have there been break-ins, vandalism, or insurance claims at this property in the last 3 years? What carrier currently insures it and at what premium?
- What's the average days-on-market for RENTAL listings here right now (not sales)? A rising rental-DOM trend means longer vacancies and softer asking-rent achievability than the comps imply.
- What's the recent tenant-quality profile in this submarket — average credit score on applications, eviction rate, late-payment / NSF rate, and stable-employment percentage? A property-management company in the area should have these aggregated.
- How much new for-sale + rental construction is in the pipeline within 1–3 miles? Heavy new supply typically softens prices + rents 12–24 months out; constrained supply supports both.
Investment metrics
- 1% rule
- 0.99% ✗
- Cap rate
- 8.63%
- Cash-on-cash
- 8.35%
- DSCR
- 1.37
- GRM
- 8.4
CMA / ARV
- ARV (median comp)
- $299,371
- List price
- $155,000
- Delta
- -48.22%
- Verdict
- UNDERPRICED
- Comps
- 20 within 1.0 mi
Projected returns pro-forma
8.06% appreciation · 3.0% rent growth · sell at horizon
- IRR
- 26.5%
- Equity multiple
- 2.93×
- Total profit
- $83,595
- Equity at exit
- $118,374
- IRR
- 23.8%
- Equity multiple
- 6.26×
- Total profit
- $228,109
- Equity at exit
- $235,561
Cash invested: $43,400 (down + closing). Projections, not guarantees.
Landlord ↔ Tenant lean methodology
- Overall (STATE)
- 15 Strongly Tenant-Friendly
- State New York
- 15 Strongly Tenant-Friendly · D+10
- County
- — inherits STATE
- City
- — inherits STATE
ZIP-level market 14206
- Home prices YoY
- 1.8%
- Active inventory
- 169
- Price-to-rent
- 8.4×
Monthly cashflow live
- Estimated rent
- $1,531 high interval (Pro) →
- Mortgage (P&I)
- −$813
- Tax from tax record
- −$30 /mo · $363/yr
- Insurance
- −$65
- HOA
- −$0
- Vacancy / Maint / Mgmt
- −$322
- Net cashflow
- $302
Break-even live
UW: 25.0% down · 7.5% · 30yr · 1.5% tax · 5.0% vac · 8.0% maint · 8.0% mgmt
Financing live
Cash to close
- Down payment
- $38,750
- Closing costs
- $4,650
- Reserves months
- —
- Total cash needed
- —
Loan-product check · same deal, 3 products live
Conventional
25% down · 7.5% · 30yr
- Down + closing
- —
- Monthly P&I
- —
- Monthly cashflow
- —
- DSCR
- —
- Eligible?
- —
Personal DTI + credit; lowest rate.
DSCR
20% down · 8.5% · 30yr
- Down + closing
- —
- Monthly P&I
- —
- Monthly cashflow
- —
- DSCR
- —
- Eligible?
- —
No personal income docs; deal must DSCR.
Hard money
10% down · 12.0% · 12mo
- Down + closing
- —
- Monthly P&I
- —
- Monthly cashflow
- —
- DSCR
- —
- Eligible?
- —
Short-term bridge; refi at stabilization.
Rent comps 9 comps
| Address | Beds | Baths | Sqft | Rent | $/sqft | DOM | Units | Dist |
|---|---|---|---|---|---|---|---|---|
| 1777 Broadway Unit 2 Buffalo, NY | 3.0 | 1.0 | 1300 | $1,200 | $0.92 | 43d | 1 | 0.43mi |
| 1150 Bailey Ave Buffalo, NY | 4.0 | 1.5 | 1100 | $1,200 | $1.09 | 23d | 1 | 0.78mi |
| 14 Rutland Ave Buffalo, NY | 4.0 | 1.0 | 1430 | $2,200 | $1.54 | 10d | 1 | 0.89mi |
| 979 Walden Ave Buffalo, NY | 4.0 | 3.0 | 1793 | $2,000 | $1.12 | 1d | 1 | 0.95mi |
| 24 Euclid Ave Buffalo, NY | 3.0 | 2.0 | 1150 | $1,700 | $1.48 | 43d | 1 | 1.06mi |
| 1202 Walden Ave Unit 3 Buffalo, NY | 3.0 | 1.0 | 1500 | $1,400 | $0.93 | 17d | 1 | 1.16mi |
| 67 Moeller St Unit LOWER Buffalo, NY | 3.0 | 1.0 | 960 | $1,200 | $1.25 | 23d | 1 | 1.27mi |
| 67 Moeller St Unit UPPER Buffalo, NY | 3.0 | 1.0 | 960 | $1,000 | $1.04 | 3d | 1 | 1.27mi |
| 143 Reo Ave Buffalo, NY | 3.0 | 2.0 | 1143 | $1,600 | $1.40 | 11d | 1 | 1.48mi |
Listing history 18 events
-
2026-06-18days on market $155,000 Active 38 DOM
-
2026-06-17days on market $155,000 Active 37 DOM
-
2026-06-16days on market $155,000 Active 36 DOM
-
2026-06-15days on market $155,000 Active 35 DOM
-
2026-06-13days on market $155,000 Active 33 DOM
-
2026-06-13days on market $155,000 Active 32 DOM
-
2026-06-10days on market $155,000 Active 30 DOM
-
2026-06-09days on market $155,000 Active 29 DOM
-
2026-06-08days on market $155,000 Active 28 DOM
-
2026-06-07days on market $155,000 Active 27 DOM
-
2026-06-03days on market $155,000 Active 23 DOM
-
2026-06-02days on market $155,000 Active 22 DOM
-
2026-06-01days on market $155,000 Active 21 DOM
-
2026-05-31days on market $155,000 Active 20 DOM
-
2026-05-11$155,000 Active 788-char remark
-
2025-11-15historical
-
2025-10-15$155,000 Active
-
2014-02-14soldstatus $18,000
ⓘ Source: listings_history table (triggers on properties + properties_extension) + one-shot
backfill from property_details.listing_events for pre-trigger history.
Tax reassessment forecast NY · Partial reset (capped growth)
- Current annual tax
- $363 · $30/mo
- Projected year-2 tax
- $1,491 · $124/mo
- Expected delta
- +$1,128/yr (+$94/mo · 310.6%)
ⓘ Screening estimate from a state-policy table — verify with the county assessor before closing.
Climate risk First Street
- Flood 3/10 Moderate FEMA zone X (unshaded) · 20% chance over 30 yrs
- Wildfire 1/10 Low
- Heat 3/10 Moderate 7 d/yr ≥92°F today · 15 d/yr by 30 yrs out
- Wind 1/10 Low
- Air quality 3/10 Moderate 2 unhealthy d/yr today · 3 by 30 yrs out
Nearby sold comps map
Loading sold comps map…
Walkable amenities ~0.75 mi
Loading nearby amenities…
Taxation est. · year 1
- Rental income
- $18,377
- − Mortgage interest
- −$8,682
- − Property taxes
- −$363
- − Insurance
- −$775
- − Repairs & maintenance
- −$1,470
- − Management
- −$1,470
- − Depreciation
- −$4,509
- Taxable income
- $1,107
- Est. tax owed @ 24.0%
- −$266
- After-tax cash flow
- $3,360/yr
For passive investors: Depreciation is non-cash, so a rental often shows a tax loss while cash-flowing — sheltering income. Rental losses are passive: they offset passive income freely, and up to $25,000/yr can offset ordinary (W-2) income if you actively participate and your MAGI is under $100k (phasing out to $0 by $150k); unused losses carry forward. On sale, claimed depreciation is recaptured at up to 25%, and gains may owe capital-gains tax (a 1031 exchange can defer both). Figures are a year-1 estimate at your 24.0% rate — not tax advice; consult a CPA.
Schools (NCES district)
- District
- Buffalo City School District
- NCES district ID
- 3605850
- Math proficiency
- 41% ▲ 11.00%
- Reading proficiency
- 40% ▲ 7.00%
- Median HH income
- $31,665
- Composite
- 33.17/100
- National rank
- #5544
- State rank
- #535 of 590 in NY
Livability — Buffalo
- Score
- 77/100
- State rank
- #195
- US rank
- #3011
Category grades
Schools grade is shown separately in the Schools card above.
Census & demographics
- Census place
- Buffalo, NY
- County
- Erie County · 714,559 people
- City population
- 440,021
- Metro
- Buffalo-Cheektowaga, NY
- Population (ZIP)
- 21,631
- Household income
- $50,450
- Rent vs Own
- Severe rent burden
- 841.0
Population outlook (Erie County) Hauer SSP2
- Today (2025)
- 933,037 people
- By 2030
- 935,181 · +0.2%
- By 2040
- 928,531 · -0.5%
- By 2050
- 905,725 · -2.9%
- By 2075
- 834,037 · -10.6%
- By 2100
- 708,033 · -24.1%
Race, ethnicity, and origin ACS 2023
- Neighborhood character
- Majority White (65%)
- Race & ethnicity
- White 65% Hispanic / Latino 13% Black 12% Two or more races 8% Asian 4%
- Hispanic origin (detail)
- Mexican 2% Puerto Rican 10%
- Common ancestry
- Romanian 25% Lithuanian 1% Italian 1%
- Foreign-born
- 6% · Canada, China
- Languages at home
- 88% English-only · Spanish 5% Other Indo-European 3% Arabic 2%
Political lean MEDSL · Erie
- 2024 margin
- Lean D (+9.7) · D 54.8% · R 45.2%
- 2008→2024 swing
- -7.9pp toward R · 2008: 17.5pp · 2024: 9.7pp
- All cycles
- 2024: D+9.7 2020: D+14.7 2016: D+4.8 2012: D+15.6 2008: D+17.5
Not yet ingested
- Civics
- —
Market trends
- HPI YoY
- ▲ 8.06%
- Current HPI
- 457.3935
- Rent YoY
- —
- Metro
- Buffalo-Cheektowaga, NY
- State GDP YoY
- ▲ 2.60%
- F500 in state
- 92
Industry mix (Fortune 500 HQ in NY)
| Industry | F500 HQs | Revenue |
|---|---|---|
| Financial Services | 10 | $950B |
|
||
| Consumer Goods | 9 | $162B |
|
||
| Insurance | 4 | $225B |
|
||
| Telecommunications | 2 | $144B |
|
||
| Pharmaceuticals | 2 | $112B |
|
||
| Media / Entertainment | 2 | $69B |
|
||
Price history
+761.1% since first listed4 events — show timeline
- 2026-05-11 Listed $155,000 WNYREIS
- 2025-11-15 Listing Removed — WNYREIS
- 2025-10-15 Listed $155,000 WNYREIS
- 2014-02-14 Sold (Public Records) $18,000 Public Records
Property tax history
+8.3%/yrLatest (2025): $363 · +20.0% YoY. Source: county tax records.
Cash-flow waterfall
monthlySold comps — $/sqft
last 12 mo · ≤1 miLoading sold comps…