1101 E Second St · Port Angeles, WA
Flood risk 1/10 · Minimal
- FEMA flood zone
- X
- Chance of flooding over 30 yrs
- 0.0%
- Est. flood insurance / yr
- $507 – $1,088
Fire risk 1/10 · Minimal
- Est. fire insurance / yr
- $604 – $1,122
Heat risk 2/10 · Minimal
- Hot days now (above 81°F)
- 8 days/yr
- Hot days in 30 yrs
- 16 days/yr
Wind risk 1/10 · Minimal
- Chance of severe wind over 30 yrs
- —
Air-quality risk 6/10 · Moderate
- Unhealthy air days now
- 8 days/yr
- Unhealthy air days in 30 yrs
- 9 days/yr
Risk factors via First Street. Map © Google.
Why this score? — see what drove the C grade
The composite is a weighted blend of 9 inputs, each scored 0–100. Each bar is that input's sub-score; the figure is the points it added to the 100-point composite (weight × sub-score).
- Cash flow +19.2/30.0
- ARV discount +15.0/15.0
- DSCR +6.1/10.0
- Schools +5.2/10.0
- 1% rule +4.3/10.0
- Livability +3.9/5.0
- Rent growth +2.5/5.0
- Condition / age +2.5/5.0
- Appreciation +0.0/10.0
$224,950
🖨 Deal sheet (PDF) 📄 Offer letter ✓ Due diligence
Listing remarks MLS
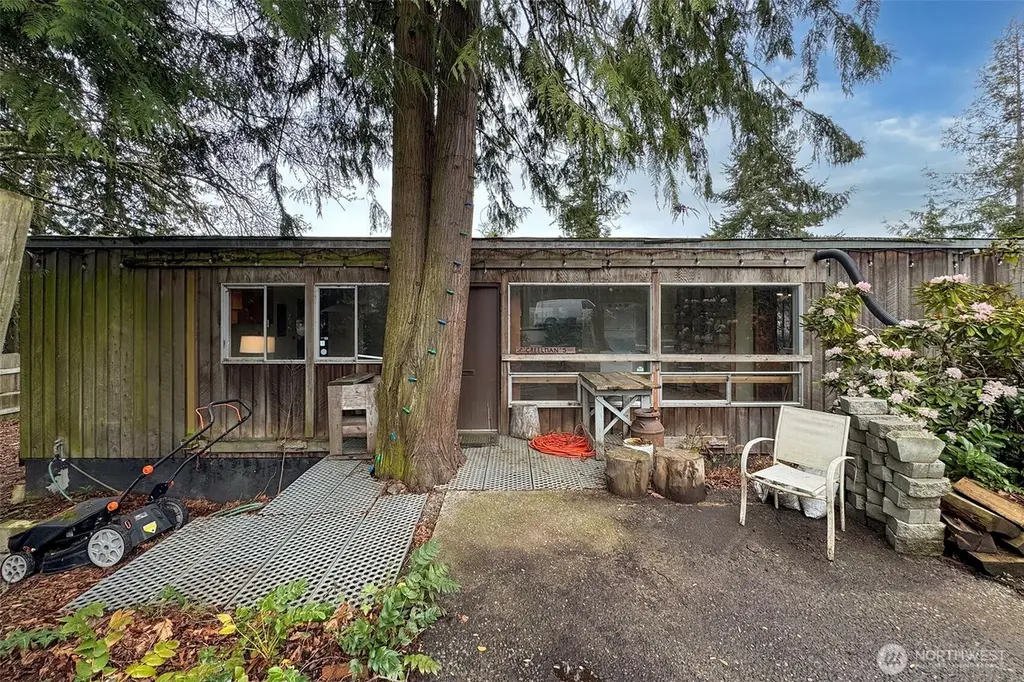
Port Angeles Fixer-Upper-This 1-bed, 1-bath cottage is a high-potential "basecamp" investment. Located in the city center, it offers a rare walkable lifestyle near the Black Ball Ferry, downtown shops, and the waterfront. High equity potential. 20 mins to Olympic National Park; steps from the Strait of Juan de Fuca. Ideal for a chic short-term rental or a minimalist long-term lease. A prime opportunity to trade sweat equity for a central slice of the Olympic Peninsula.
Key facts
- 0.43 acre lot
- Built 1962
- Listed 77 days
Neighborhood map
What this means for you Summary
Snapshot
- This is a 1-bed/1.0-bath single-family listed at $225k.
Deal economics
- At list price, monthly cash flow is $244 ($3k/yr) — positive.
- The deal already cash-flows at list — no discount required.
- To meet the 1% rule (rent ≥ 1% of price), the offer needs to be $210k (6.6% below list).
- Recommended offer: $210k (6.6% below list) — sets the bar for 1% rule.
- Cap rate 7.6% vs local median 2.8% in Port Angeles — top-decile yield for the area; either an underpriced asset or a hidden risk that comps aren't pricing in. Stress-test before assuming the spread holds.
Location & tenants
- Location reads 78/100 on livability (#138 in WA, #2,729 nationally) — a middle-class / working-renter tenant base. Strengths: amenities A+, commute A+, health & safety A+; Watch: employment C-, crime F.
- Port Angeles School District (town): math 55% / reading 65% proficiency, ranked #70 of 291 in WA (top 24%) — acceptable for families but not a draw, mixed tenant base, ~2y average lease.
- Zoned schools: Roosevelt Elementary School (406 students, 64% FRL); Stevens Middle School (492 students, 63% FRL); Port Angeles High School (989 students, 57% FRL) — zoned schools average 61% FRL vs 46% district-wide (16 pts higher); higher-poverty schools than district average — tighter screening recommended.
- Market conditions: 273 active listings in the ZIP; 1 comparable units currently listed for rent nearby; 166 units permitted in Clallam County in 2024 (0 in 5+ unit buildings).
Forward outlook
- Local home prices are declining (-3.0%/yr); year-one equity from $2k of loan paydown is wiped out by about $7k of value loss. Plan a longer hold.
- Clallam County population projected at +5% by 2050 — modest demand growth; plan on rents tracking national, not racing it.
Negotiation context
- It's been on market 77 days — a 6% lower offer ($211k) is reasonable based on typical stale-listing flexibility.
- 2 sale attempts with the ask held roughly flat each time — persistent listings suggest the price (not the market) is what's stuck; bring a comps-based counter.
Questions for the listing agent
- It's been on market 77 days. Have you received any prior offers? Is the seller open to a 7% concession, seller financing, or rate buy-down credit?
- Built in 1962 — when were the roof, HVAC, electrical panel, plumbing, and water heater last replaced?
- Why hasn't it sold? Are there any deal-killer items the seller is aware of (foundation, flood, title, zoning, code violations)?
- Is there a deadline driving the sale (1031 exchange, divorce, estate, relocation)? That informs how much negotiation room exists.
- Schools are B-rated — typically a magnet for longer-tenancy family renters. What's the average tenant stay here, and is there a school-zone premium baked into asking?
- Crime grade is F in this area — have there been break-ins, vandalism, or insurance claims at this property in the last 3 years? What carrier currently insures it and at what premium?
- What's the average days-on-market for RENTAL listings here right now (not sales)? A rising rental-DOM trend means longer vacancies and softer asking-rent achievability than the comps imply.
- What's the recent tenant-quality profile in this submarket — average credit score on applications, eviction rate, late-payment / NSF rate, and stable-employment percentage? A property-management company in the area should have these aggregated.
- How much new for-sale + rental construction is in the pipeline within 1–3 miles? Heavy new supply typically softens prices + rents 12–24 months out; constrained supply supports both.
Investment metrics
- 1% rule
- 0.93% ✗
- Cap rate
- 7.60%
- Cash-on-cash
- 4.66%
- DSCR
- 1.21
- GRM
- 8.9
CMA / ARV
- ARV (median comp)
- $336,488
- List price
- $224,950
- Delta
- -33.15%
- Verdict
- UNDERPRICED
- Comps
- 20 within 1.0 mi
Show comp detail 6 sales within ~0.75 mi
| Address | Dist | Beds/Ba | Sqft | Sold | Price | $/sf | Match |
|---|---|---|---|---|---|---|---|
| 817 E 7th St | 0.44mi | 2/2.0 (+1) | 1,360 (+0%) | 6mo | $150,000 | $110 | 65 |
| 1034 E Seventh St | 0.38mi | 1/1.0 | 1,350 (-1%) | 22mo | $335,000 | $248 | 63 |
| 1825 E 3rd St | 0.72mi | 2/2.0 (+1) | 1,360 (+0%) | 11mo | $436,500 | $321 | 48 |
| 109 N Vine | 0.61mi | 2/1.5 (+1) | 1,264 (-7%) | 13mo | $396,500 | $314 | 43 |
| 919 S Albert St | 0.74mi | 2/1.0 (+1) | 1,211 (-11%) | 10mo | $310,000 | $256 | 34 |
| 1125 Highland Ave | 0.69mi | 2/2.0 (+1) | 1,532 (+13%) | 23mo | $444,000 | $290 | 18 |
Match score weights: distance 35% · size 25% · config 20% · recency 20%. Top-matched comps best support the ARV.
Projected returns pro-forma
-3.0% appreciation · 3.0% rent growth · sell at horizon
- IRR
- -9.1%
- Equity multiple
- 0.67×
- Total profit
- $-20,941
- Equity at exit
- $33,541
- IRR
- 0.4%
- Equity multiple
- 1.03×
- Total profit
- $1,586
- Equity at exit
- $19,450
Cash invested: $62,986 (down + closing). Projections, not guarantees.
Landlord ↔ Tenant lean methodology
- Overall (STATE)
- 28 Tenant-Leaning
- State Washington
- 28 Tenant-Leaning · D+8
- County
- — inherits STATE
- City
- — inherits STATE
ZIP-level market 98362
- Active inventory
- 273
- Price-to-rent
- 8.9×
Monthly cashflow live
- Estimated rent
- $2,100 medium interval (Pro) →
- Mortgage (P&I)
- −$1,180
- Tax from tax record
- −$141 /mo · $1,695/yr
- Insurance
- −$94
- HOA
- −$0
- Vacancy / Maint / Mgmt
- −$441
- Net cashflow
- $244
Break-even live
Sensitivity live
| Price | -10% $372 | -5% $308 | +0% $244 | +5% $181 | +10% $117 |
|---|---|---|---|---|---|
| Rent | -10% $78 | -5% $161 | +0% $244 | +5% $327 | +10% $410 |
| Rate | -1.0pp $358 | -0.5pp $302 | base $244 | +0.5pp $186 | +1.0pp $127 |
UW: 25.0% down · 7.5% · 30yr · 1.5% tax · 5.0% vac · 8.0% maint · 8.0% mgmt
Financing live
Cash to close
- Down payment
- $56,238
- Closing costs
- $6,748
- Reserves months
- —
- Total cash needed
- —
Loan-product check · same deal, 3 products live
Conventional
25% down · 7.5% · 30yr
- Down + closing
- —
- Monthly P&I
- —
- Monthly cashflow
- —
- DSCR
- —
- Eligible?
- —
Personal DTI + credit; lowest rate.
DSCR
20% down · 8.5% · 30yr
- Down + closing
- —
- Monthly P&I
- —
- Monthly cashflow
- —
- DSCR
- —
- Eligible?
- —
No personal income docs; deal must DSCR.
Hard money
10% down · 12.0% · 12mo
- Down + closing
- —
- Monthly P&I
- —
- Monthly cashflow
- —
- DSCR
- —
- Eligible?
- —
Short-term bridge; refi at stabilization.
Rent comps 1 comps
| Address | Beds | Baths | Sqft | Rent | $/sqft | DOM | Units | Dist |
|---|---|---|---|---|---|---|---|---|
| 1119 S Lincoln St Port Angeles, WA | 2.0 | 1.0 | 1000 | $2,100 | $2.10 | 45d | 1 | 1.12mi |
Listing history 12 events
-
2026-06-12statusdays on market $224,950 Pending 77 DOM
-
2026-06-10status $224,950 Active Under Contract 75 DOM
-
2026-06-09days on market $224,950 Active 75 DOM
-
2026-06-08days on market $224,950 Active 74 DOM
-
2026-06-08days on market $224,950 Active 73 DOM
-
2026-06-07days on market $224,950 Active 72 DOM
-
2026-06-03days on market $224,950 Active 69 DOM
-
2026-06-02days on market $224,950 Active 68 DOM
-
2026-06-01days on market $224,950 Active 67 DOM
-
2026-05-31days on market $224,950 Active 66 DOM
-
2026-03-26$224,950 Active 483-char remark
Show marketing remark (483 chars)
Port Angeles Fixer-Upper-This 1-bed, 1-bath cottage is a high-potential "basecamp" investment. Located in the city center, it offers a rare walkable lifestyle near the Black Ball Ferry, downtown shops, and the waterfront. High equity potential. 20 mins to Olympic National Park; steps from the Strait of Juan de Fuca. Ideal for a chic short-term rental or a minimalist long-term lease. A prime opportunity to trade sweat equity for a central slice of the Olympic Peninsula.
-
2026-03-26$224,950 Active
Show marketing remark (483 chars)
Port Angeles Fixer-Upper-This 1-bed, 1-bath cottage is a high-potential "basecamp" investment. Located in the city center, it offers a rare walkable lifestyle near the Black Ball Ferry, downtown shops, and the waterfront. High equity potential. 20 mins to Olympic National Park; steps from the Strait of Juan de Fuca. Ideal for a chic short-term rental or a minimalist long-term lease. A prime opportunity to trade sweat equity for a central slice of the Olympic Peninsula.
ⓘ Source: listings_history table (triggers on properties + properties_extension) + one-shot
backfill from property_details.listing_events for pre-trigger history.
Tax reassessment forecast WA · Resets to sale price
- Current annual tax
- $1,695 · $141/mo
- Projected year-2 tax
- $2,205 · $184/mo
- Expected delta
- +$510/yr (+$42/mo · 30.1%)
ⓘ Screening estimate from a state-policy table — verify with the county assessor before closing.
Climate risk First Street
- Flood 1/10 Low FEMA zone X · 0% chance over 30 yrs
- Wildfire 1/10 Low
- Heat 2/10 Low 8 d/yr ≥81°F today · 16 d/yr by 30 yrs out
- Wind 1/10 Low
- Air quality 6/10 Major 8 unhealthy d/yr today · 9 by 30 yrs out
Nearby sold comps map
Loading sold comps map…
Walkable amenities ~0.75 mi
Loading nearby amenities…
Taxation est. · year 1
- Rental income
- $25,200
- − Mortgage interest
- −$12,601
- − Property taxes
- −$1,695
- − Insurance
- −$1,125
- − Repairs & maintenance
- −$2,016
- − Management
- −$2,016
- − Depreciation
- −$6,544
- Taxable loss
- −$796
- Est. tax savings @ 24.0%
- +$191
- After-tax cash flow
- $3,124/yr
For passive investors: Depreciation is non-cash, so a rental often shows a tax loss while cash-flowing — sheltering income. Rental losses are passive: they offset passive income freely, and up to $25,000/yr can offset ordinary (W-2) income if you actively participate and your MAGI is under $100k (phasing out to $0 by $150k); unused losses carry forward. On sale, claimed depreciation is recaptured at up to 25%, and gains may owe capital-gains tax (a 1031 exchange can defer both). Figures are a year-1 estimate at your 24.0% rate — not tax advice; consult a CPA.
Schools (NCES district)
- District
- Port Angeles School District
- NCES district ID
- 5306820
- Math proficiency
- 55% ▬ 0.00%
- Reading proficiency
- 65% ▲ 1.00%
- Median HH income
- $46,594
- Composite
- 52.34/100
- National rank
- #3432
- State rank
- #70 of 291 in WA
Livability — Port Angeles
- Score
- 78/100
- State rank
- #138
- US rank
- #2729
Category grades
Schools grade is shown separately in the Schools card above.
Census & demographics
- Census place
- Port Angeles, WA
- Population (ZIP)
- 23,907
Population outlook (Clallam County) Hauer SSP2
- Today (2025)
- 76,817 people
- By 2030
- 78,177 · +1.8%
- By 2040
- 79,795 · +3.9%
- By 2050
- 80,890 · +5.3%
- By 2075
- 83,933 · +9.3%
- By 2100
- 82,141 · +6.9%
Race, ethnicity, and origin ACS 2023
- Neighborhood character
- Predominantly White (84%)
- Race & ethnicity
- White 84% Two or more races 8% Hispanic / Latino 7% Native American 1% Asian 1%
- Hispanic origin (detail)
- Mexican 4%
- Common ancestry
- Italian 6% Portuguese 6% Lithuanian 4%
- Foreign-born
- 4% · Canada
- Languages at home
- 95% English-only · Spanish 3% German/W. Germanic 1%
Political lean MEDSL · Clallam
- 2024 margin
- Lean D (+7.9) · D 52.6% · R 44.7% · Other 2.7%
- 2008→2024 swing
- +4.6pp toward D · 2008: 3.3pp · 2024: 7.9pp
- All cycles
- 2024: D+7.9 2020: D+3.4 2016: R+1.6 2012: D+0.4 2008: D+3.3
Not yet ingested
- Civics
- —
Market trends
- HPI YoY
- ▼ -340.90%
- Current HPI
- 189.7112
- Rent YoY
- —
- Metro
- —
- State GDP YoY
- ▲ 4.65%
- F500 in state
- 22
Industry mix (Fortune 500 HQ in WA)
| Industry | F500 HQs | Revenue |
|---|---|---|
| Retail | 2 | $269B |
|
||
| Technology / Retail | 1 | $638B |
|
||
| Technology | 1 | $245B |
|
||
| Telecommunications | 1 | $38B |
|
||
| Food / Beverage | 1 | $36B |
|
||
| Automotive / Trucks | 1 | $34B |
|
||
Price history
+0.0% since first listed2 events — show timeline
- 2026-03-26 Listed $224,950 NWMLS as Distributed by MLS Grid
- 2026-03-26 Listed $224,950 OLS
Property tax history
+0.3%/yrLatest (2026): $1,695 · +18.5% YoY. Source: county tax records.
Cash-flow waterfall
monthlySold comps — $/sqft
last 12 mo · ≤1 miLoading sold comps…