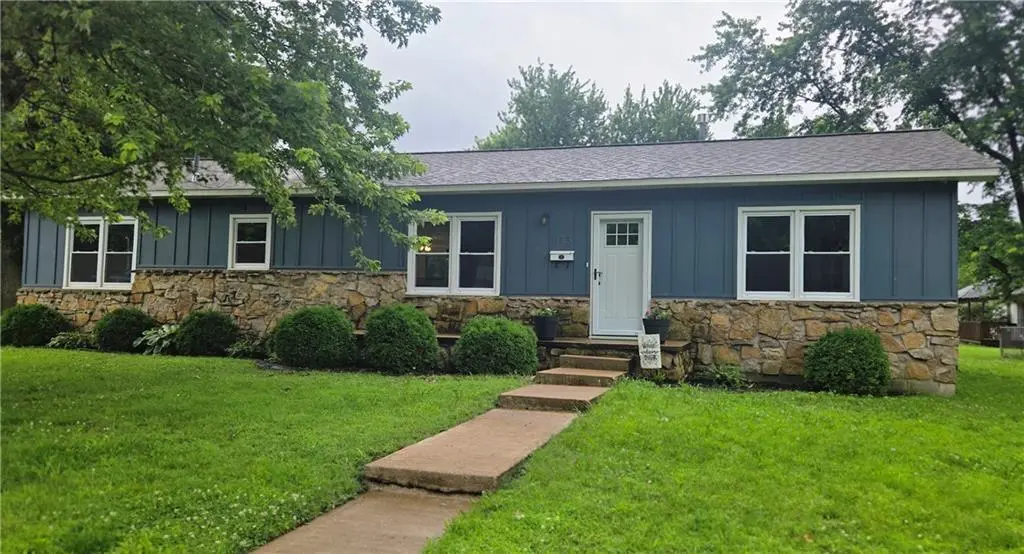
113 W Antelope N/A · Girard, KS
Flood risk 1/10 · Minimal
- FEMA flood zone
- X (unshaded)
- Chance of flooding over 30 yrs
- 0.0%
- Est. flood insurance / yr
- $507 – $1,088
Fire risk 2/10 · Minimal
- Est. fire insurance / yr
- $1,154 – $2,142
Heat risk 5/10 · Moderate
- Hot days now (above 109°F)
- 7 days/yr
- Hot days in 30 yrs
- 19 days/yr
Wind risk 2/10 · Minimal
- Chance of severe wind over 30 yrs
- 2.0%
Air-quality risk 2/10 · Minimal
- Unhealthy air days now
- 1 days/yr
- Unhealthy air days in 30 yrs
- 1 days/yr
Risk factors via First Street. Map © Google.
Why this score? — see what drove the D- grade
The composite is a weighted blend of 9 inputs, each scored 0–100. Each bar is that input's sub-score; the figure is the points it added to the 100-point composite (weight × sub-score).
- Cash flow +9.3/30.0
- Appreciation +6.8/10.0
- Livability +3.5/5.0
- ARV discount +3.3/15.0
- Schools +3.2/10.0
- DSCR +2.6/10.0
- 1% rule +2.5/10.0
- Rent growth +2.5/5.0
- Condition / age +2.5/5.0
$135,000
🖨 Deal sheet 📄 Offer letter ✓ Due diligence
Key facts
- Breakfast nook
- New vanity
- Granite countertops
Tags
Property features AI
Finance
- Other: No maintenance provided by a community association
- Financial info: No investor or rental income details provided
- HOA & community: No association fees
Exterior
- Parking: Attached garage (1 car)
- Security: No specific security features provided
- Utilities: Public water; Public sewer
- Home design: Single-family residence; One-story (ranch); Above-grade finished living area reported as 1,260
- Construction: Composition roof; Other construction materials; Home age reported at 51–75 years
- Exterior features: Patio; Lot approximately 5,170 square feet; Not in a flood plain
Interior
- Kitchen: Dishwasher; Free‑standing electric oven
- Bedrooms: Three bedrooms, all on the main level (approx. 12.5 x 12; 12 x 13.5; 12.5 x 11)
- Flooring: Luxury vinyl flooring
- Bathrooms: One full bathroom on the main level (approx. 7.5 x 12)
- Heating & cooling: Natural gas heating; Electric cooling (central cooling present)
- Interior features: Ranch floor plan; Crawl space basement; Patio
- Laundry & utility: No specific laundry details provided
Neighborhood map
What this means for you Summary
Snapshot
- This is a 3-bed/2.0-bath single-family listed at $135k.
Deal economics
- At list price, monthly cash flow is $-98 ($-1k/yr) — negative.
- To cash-flow at today's rent, offer at most $118k (12.8% below list).
- To meet the 1% rule (rent ≥ 1% of price), the offer needs to be $101k (25.2% below list).
- Recommended offer: $101k (25.2% below list) — sets the bar for 1% rule.
Location & tenants
- Location reads 69/100 on livability (#185 in KS) — a middle-class / working-renter tenant base. Strengths: cost of living A+, housing A+, health & safety A+; Watch: crime C-, schools D+, amenities F.
- Girard (town): math 32% / reading 44% proficiency, ranked #44 of 169 in KS (top 26%) — families likely to look elsewhere, expect single-tenant / working-renter base with shorter leases.
- Market conditions: 15 active listings in the ZIP; 65 units permitted in Crawford County in 2024 (0 in 5+ unit buildings).
Forward outlook
- In year one you build about $6k of equity ($933 loan paydown + $5k appreciation (3.7% local appreciation)).
- By year 6, paydown + projected appreciation supports a ~$31k cash-out refi (75% LTV) — recoverable capital for the next deal without selling this one.
Negotiation context
- Only 2 days on market — expect competitive offers; lowballing is unlikely to land.
- Current owner paid $39k; list at $135k implies a 246% gain — meaningful room to come down on a strong offer.
Risks & watch-outs
- Climate carrying-cost: extreme-heat days projected 7→19/yr by 2055 (HVAC capex compounding) — expect insurance premiums to compound above CPI over the hold.
Questions for the listing agent
- What do current leases actually rent for vs. the listed asking? Can we see a recent rent roll and the last 12 months of T-12 income?
- Built in 1974 — when were the roof, HVAC, electrical panel, plumbing, and water heater last replaced?
- Is there a deadline driving the sale (1031 exchange, divorce, estate, relocation)? That informs how much negotiation room exists.
- Schools are D-rated, which usually means shorter tenancies and higher turnover. Who's the typical renter profile here, and what's been the actual vacancy rate?
- The area grade is low — what's the realistic commute time and amenity access for the typical tenant pool here? Any planned neighborhood developments (good or bad) we should know about?
- What's the average days-on-market for RENTAL listings here right now (not sales)? A rising rental-DOM trend means longer vacancies and softer asking-rent achievability than the comps imply.
- What's the recent tenant-quality profile in this submarket — average credit score on applications, eviction rate, late-payment / NSF rate, and stable-employment percentage? A property-management company in the area should have these aggregated.
- How much new for-sale + rental construction is in the pipeline within 1–3 miles? Heavy new supply typically softens prices + rents 12–24 months out; constrained supply supports both.
Investment metrics
- 1% rule
- 0.75% ✗
- Cap rate
- 5.42%
- Cash-on-cash
- -3.11%
- DSCR
- 0.86
- GRM
- 11.1
CMA / ARV
- ARV (on-the-fly)
- $123,480
- Comps found
- 12
Show comp detail 12 sales within ~0.75 mi
| Address | Dist | Beds/Ba | Sqft | Sold | Price | $/sf | Match |
|---|---|---|---|---|---|---|---|
| 412 S Osage St | 0.06mi | 3/1.5 | 1,196 (-5%) | 16mo | $140,000 | $117 | 74 |
| 205 N Cherokee St | 0.46mi | 2/1.5 (-1) | 1,272 (+1%) | 7mo | $79,900 | $63 | 64 |
| 607 W Forest N/A | 0.51mi | 3/1.5 | 1,269 (+1%) | 12mo | $150,000 | $118 | 63 |
| 108 W Buffalo St | 0.12mi | 2/1.0 (-1) | 1,376 (+9%) | 10mo | $135,000 | $98 | 62 |
| 605 S Summit St | 0.20mi | 3/1.0 | 1,136 (-10%) | 12mo | $79,500 | $70 | 60 |
| 110 S Williams St | 0.73mi | 3/2.0 | 1,227 (-3%) | 2mo | $195,000 | $159 | 60 |
| 717 S Cherokee St | 0.42mi | 3/1.5 | 1,232 (-2%) | 18mo | $49,900 | $41 | 60 |
| 502 S Summit St | 0.12mi | 2/1.0 (-1) | 1,152 (-9%) | 17mo | $65,000 | $56 | 57 |
| 413 S Summit St | 0.07mi | 2/1.0 (-1) | 1,074 (-15%) | 10mo | $105,000 | $98 | 55 |
| 409 N Ozark St | 0.62mi | 3/2.0 | 1,296 (+3%) | 19mo | $47,900 | $37 | 50 |
| 111 N Cherokee St | 0.41mi | 3/1.0 | 1,120 (-11%) | 11mo | $110,000 | $98 | 49 |
| 413 S Burnett St | 0.44mi | 3/1.5 | 1,152 (-9%) | 19mo | $150,000 | $130 | 47 |
Match score weights: distance 35% · size 25% · config 20% · recency 20%. Top-matched comps best support the ARV.
Projected returns pro-forma
3.69% appreciation · 3.0% rent growth · sell at horizon
- IRR
- 6.6%
- Equity multiple
- 1.40×
- Total profit
- $14,996
- Equity at exit
- $66,010
- IRR
- 9.2%
- Equity multiple
- 2.49×
- Total profit
- $56,156
- Equity at exit
- $106,065
Cash invested: $37,800 (down + closing). Projections, not guarantees.
Landlord ↔ Tenant lean methodology
- Overall (STATE)
- 83 Strongly Landlord-Friendly
- State Kansas
- 83 Strongly Landlord-Friendly · R+10
- County
- — inherits STATE
- City
- — inherits STATE
ZIP-level market 66743
- Home prices YoY
- 1.9%
- Active inventory
- 15
- Price-to-rent
- 11.1×
Monthly cashflow live
- Estimated rent
- $1,010 medium interval (Pro) →
- Mortgage (P&I)
- −$708
- Tax from tax record
- −$132 /mo · $1,584/yr
- Insurance
- −$56
- HOA
- −$0
- Vacancy / Maint / Mgmt
- −$212
- Net cashflow
- $-98
Break-even live
UW: 25.0% down · 7.5% · 30yr · 1.5% tax · 5.0% vac · 8.0% maint · 8.0% mgmt
Financing live
Cash to close
- Down payment
- $33,750
- Closing costs
- $4,050
- Reserves months
- —
- Total cash needed
- —
Loan-product check · same deal, 3 products live
Conventional
25% down · 7.5% · 30yr
- Down + closing
- —
- Monthly P&I
- —
- Monthly cashflow
- —
- DSCR
- —
- Eligible?
- —
Personal DTI + credit; lowest rate.
DSCR
20% down · 8.5% · 30yr
- Down + closing
- —
- Monthly P&I
- —
- Monthly cashflow
- —
- DSCR
- —
- Eligible?
- —
No personal income docs; deal must DSCR.
Hard money
10% down · 12.0% · 12mo
- Down + closing
- —
- Monthly P&I
- —
- Monthly cashflow
- —
- DSCR
- —
- Eligible?
- —
Short-term bridge; refi at stabilization.
Listing history 2 events
-
2026-06-12statusdays on market $135,000 Pending 2 DOM
-
2026-06-09$135,000 Active 1 DOM
ⓘ Source: listings_history table (triggers on properties + properties_extension) + one-shot
backfill from property_details.listing_events for pre-trigger history.
Tax reassessment forecast KS · Resets to sale price
- Current annual tax
- $1,584 · $132/mo
- Projected year-2 tax
- $1,904 · $159/mo
- Expected delta
- +$320/yr (+$27/mo · 20.2%)
ⓘ Screening estimate from a state-policy table — verify with the county assessor before closing.
Climate risk First Street
- Flood 1/10 Low FEMA zone X (unshaded) · 0% chance over 30 yrs
- Wildfire 2/10 Low
- Heat 5/10 Major 7 d/yr ≥109°F today · 19 d/yr by 30 yrs out
- Wind 2/10 Low 2% chance of damaging wind over 30 yrs
- Air quality 2/10 Low 1 unhealthy d/yr today · 1 by 30 yrs out
Nearby sold comps map
Loading sold comps map…
Walkable amenities ~0.75 mi
Loading nearby amenities…
Taxation est. · year 1
- Rental income
- $12,123
- − Mortgage interest
- −$7,562
- − Property taxes
- −$1,584
- − Insurance
- −$675
- − Repairs & maintenance
- −$970
- − Management
- −$970
- − Depreciation
- −$3,927
- Taxable loss
- −$3,565
- Est. tax savings @ 24.0%
- +$856
- After-tax cash flow
- $-322/yr
For passive investors: Depreciation is non-cash, so a rental often shows a tax loss while cash-flowing — sheltering income. Rental losses are passive: they offset passive income freely, and up to $25,000/yr can offset ordinary (W-2) income if you actively participate and your MAGI is under $100k (phasing out to $0 by $150k); unused losses carry forward. On sale, claimed depreciation is recaptured at up to 25%, and gains may owe capital-gains tax (a 1031 exchange can defer both). Figures are a year-1 estimate at your 24.0% rate — not tax advice; consult a CPA.
Schools (NCES district)
- District
- Girard
- NCES district ID
- 2006480
- Math proficiency
- 32% ▲ 2.00%
- Reading proficiency
- 44% ▲ 4.00%
- Median HH income
- $44,262
- Composite
- 32.24/100
- National rank
- #5769
- State rank
- #44 of 169 in KS
Livability — Girard
- Score
- 69/100
- State rank
- #185
- US rank
- #8485
Category grades
Schools grade is shown separately in the Schools card above.
Census & demographics
- Census place
- Girard, KS
- Population (ZIP)
- 4,384
Population outlook (Crawford County) Hauer SSP2
- Today (2025)
- 39,393 people
- By 2030
- 39,540 · +0.4%
- By 2040
- 39,452 · +0.1%
- By 2050
- 39,188 · -0.5%
- By 2075
- 39,038 · -0.9%
- By 2100
- 38,219 · -3.0%
Race, ethnicity, and origin ACS 2023
- Neighborhood character
- Predominantly White (91%)
- Race & ethnicity
- White 91% Two or more races 6% Hispanic / Latino 1%
- Common ancestry
- Lithuanian 4% Slovak 3% Italian 3%
- Foreign-born
- 0%
- Languages at home
- 98% English-only · Spanish 1%
Political lean MEDSL · Crawford
- 2024 margin
- Strong R (+25.3) · D 36.5% · R 61.7% · Other 1.8%
- 2008→2024 swing
- -26.7pp toward R · 2008: 1.4pp · 2024: -25.3pp
- All cycles
- 2024: R+25.3 2020: R+23.1 2016: R+23.1 2012: R+6.5 2008: D+1.4
Not yet ingested
- Civics
- —
Market trends
- HPI YoY
- ▲ 3.69%
- Current HPI
- 196.0003
- Rent YoY
- —
- Metro
- —
- State GDP YoY
- —
- F500 in state
- 0
Price history
+95.9% since first listed4 events — show timeline
- 2026-06-09 Listed $135,000 Heartland MLS as Distributed by MLS Grid
- 2012-10-02 Sold (Public Records) — Public Records
- 2009-11-01 Sold (Public Records) $39,000 Public Records
- 2004-03-01 Sold (Public Records) $68,900 Public Records
Property tax history
+2.9%/yrLatest (2025): $1,584 · +10.1% YoY. Source: county tax records.
Cash-flow waterfall
monthlySold comps — $/sqft
last 12 mo · ≤1 miLoading sold comps…