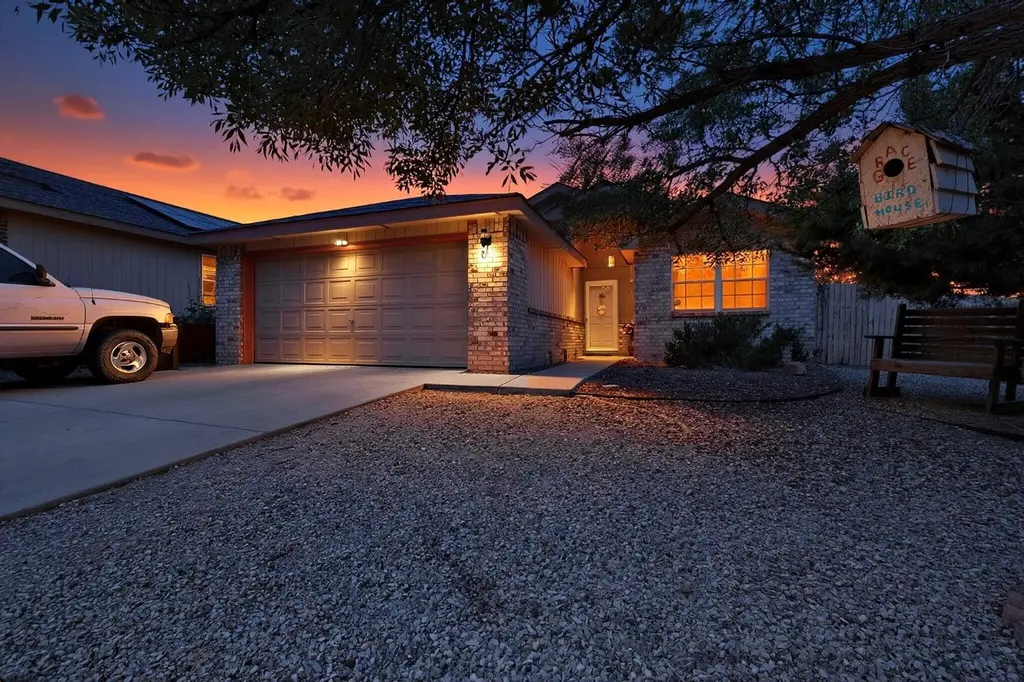
17 Milagro Ct · Tome, NM
Flood risk 1/10 · Minimal
- FEMA flood zone
- X (unshaded)
- Chance of flooding over 30 yrs
- 0.0%
- Est. flood insurance / yr
- $507 – $1,088
Fire risk 5/10 · Moderate
- Est. fire insurance / yr
- $706 – $1,312
Heat risk 5/10 · Moderate
- Hot days now (above 97°F)
- 7 days/yr
- Hot days in 30 yrs
- 20 days/yr
Wind risk 1/10 · Minimal
- Chance of severe wind over 30 yrs
- —
Air-quality risk 1/10 · Minimal
- Unhealthy air days now
- 0 days/yr
- Unhealthy air days in 30 yrs
- 0 days/yr
Risk factors via First Street. Map © Google.
Why this score? — see what drove the D grade
The composite is a weighted blend of 9 inputs, each scored 0–100. Each bar is that input's sub-score; the figure is the points it added to the 100-point composite (weight × sub-score).
- Cash flow +16.5/30.0
- DSCR +5.1/10.0
- Rent growth +5.0/5.0
- 1% rule +3.7/10.0
- ARV discount +3.5/15.0
- Livability +3.1/5.0
- Schools +2.6/10.0
- Condition / age +2.5/5.0
- Appreciation +0.0/10.0
$245,000
🖨 Deal sheet (PDF) 📄 Offer letter ✓ Due diligence
Listing remarks
Welcome to this cozy and charming home full of potential and personality. Thoughtfully started upgrades give you a head start, while still leaving plenty of room to add your own style and finishing touches. The home offers a warm and inviting layout, with comfortable living spaces perfect for relaxing or entertaining. Recent improvements have already begun enhancing both function and appeal, making this an ideal opportunity for someone looking to personalize a home without starting from scratch.
Key facts
- 6,098 sq ft lot
- 2 garage spots
- Built 1993
Property features AI
Finance
- Financial info: Annual tax amount available
Exterior
- Parking: Attached garage with garage door opener; 2 garage spaces
- Utilities: Cable available; Electricity connected; Natural gas connected; Phone available; Sewer connected (public sewer); Water connected (community/co-op)
- Home design: Single-story home; Resale property; Pitched shingle roof
- Construction: Builder: Unknown
- Exterior features: Covered patio; Patio; Back yard fencing; Landscaped lot; Faces west; R-1 zoning
Interior
- Kitchen: Built-in gas range; Refrigerator
- Bedrooms: Bedroom 3 on main level; Bedroom 2 on main level; Primary bedroom on main level
- Flooring: Carpet; Laminate; Tile
- Bathrooms: 2 full bathrooms
- Heating & cooling: Wall furnace heating; Evaporative cooling
- Interior features: Ceiling fans; Main-level primary bedroom; Walk-in closet(s); Clad, metal, and single-pane windows
- Laundry & utility: Washer hookup; Electric dryer hookup; Gas dryer hookup
Neighborhood map
What this means for you Summary
Snapshot
- This is a 3-bed/2.0-bath other listed at $245k.
Deal economics
- At list price, monthly cash flow is $145 ($2k/yr) — positive.
- The deal already cash-flows at list — no discount required.
- To meet the 1% rule (rent ≥ 1% of price), the offer needs to be $212k (13.4% below list).
- Recommended offer: $212k (13.4% below list) — sets the bar for 1% rule.
Location & tenants
- Location reads 62/100 on livability (#89 in NM) — a middle-class / working-renter tenant base. Strengths: crime A+, housing A+, employment A-; Watch: amenities F, commute F, health & safety F.
- Los Lunas Public Schools (suburban): math 20% / reading 34% proficiency, ranked #34 of 95 in NM (top 36%) — low school quality limits family demand, transient renter base, plan for 1-2y turnover; 63% free/reduced lunch — lower-income household profile, screen leases tightly.
- Zoned schools: La Merced Elementary (437 students, 100% FRL); Belen Middle (528 students, 100% FRL); Belen High (math 30% / reading 50%, grade F, #61 of 110 statewide, top 61%, 1,027 students, 100% FRL) — zoned schools average 100% FRL vs 63% district-wide (37 pts higher); higher-poverty schools than district average — tighter screening recommended.
- Zoned-school proficiency averages 40% at this address vs 27% district-wide (+13 pts) — the actual schools serving this property are materially stronger than the Los Lunas Public Schools average implies; a family-tenant draw the district grade alone would hide.
- Market conditions: Rents rising fast (+33.2%/yr); 567 active listings in the ZIP; 1 comparable units currently listed for rent nearby; 303 units permitted in Valencia County in 2024 (0 in 5+ unit buildings).
- This rent runs 42% of the median local income ($61k/yr) — at the standard rent-burdened threshold; future hikes will face affordability resistance.
Forward outlook
- Local home prices are declining (-3.0%/yr); year-one equity from $2k of loan paydown is wiped out by about $7k of value loss. Plan a longer hold.
- Valencia County population projected at -14% by 2050 — secular population decline; favor cash flow + early exit over multi-decade hold.
Negotiation context
- Only 8 days on market — expect competitive offers; lowballing is unlikely to land.
- 2 sale attempts with the ask held roughly flat each time — persistent listings suggest the price (not the market) is what's stuck; bring a comps-based counter.
- Current owner paid $108k; list at $245k implies a 128% gain — meaningful room to come down on a strong offer.
Risks & watch-outs
- Climate carrying-cost: moderate wildfire risk; extreme-heat days projected 7→20/yr by 2055 (HVAC capex compounding) — expect insurance premiums to compound above CPI over the hold.
Questions for the listing agent
- Is there a deadline driving the sale (1031 exchange, divorce, estate, relocation)? That informs how much negotiation room exists.
- Schools are D-rated, which usually means shorter tenancies and higher turnover. Who's the typical renter profile here, and what's been the actual vacancy rate?
- The area grade is low — what's the realistic commute time and amenity access for the typical tenant pool here? Any planned neighborhood developments (good or bad) we should know about?
- What's the average days-on-market for RENTAL listings here right now (not sales)? A rising rental-DOM trend means longer vacancies and softer asking-rent achievability than the comps imply.
- What's the recent tenant-quality profile in this submarket — average credit score on applications, eviction rate, late-payment / NSF rate, and stable-employment percentage? A property-management company in the area should have these aggregated.
- How much new for-sale + rental construction is in the pipeline within 1–3 miles? Heavy new supply typically softens prices + rents 12–24 months out; constrained supply supports both.
Investment metrics
- 1% rule
- 0.87% ✗
- Cap rate
- 7.00%
- Cash-on-cash
- 2.54%
- DSCR
- 1.11
- GRM
- 9.6
CMA / ARV
- ARV (median comp)
- $225,199
- List price
- $245,000
- Delta
- 8.79%
- Verdict
- FAIR
- Comps
- 8 within 1.0 mi
Projected returns pro-forma
-3.0% appreciation · 8.0% rent growth · sell at horizon
- IRR
- -7.3%
- Equity multiple
- 0.72×
- Total profit
- $-19,310
- Equity at exit
- $36,530
- IRR
- 7.3%
- Equity multiple
- 1.67×
- Total profit
- $45,854
- Equity at exit
- $21,183
Cash invested: $68,600 (down + closing). Projections, not guarantees.
Landlord ↔ Tenant lean methodology
- Overall (STATE)
- 55 Moderately Landlord-Leaning
- State New Mexico
- 55 Moderately Landlord-Leaning · D+3
- County
- — inherits STATE
- City
- — inherits STATE
ZIP-level market 87031
- Home prices YoY
- -29.8%
- Rents YoY
- 33.2%
- Active inventory
- 567
- Price-to-rent
- 9.6×
Monthly cashflow live
- Estimated rent
- $2,122 medium interval (Pro) →
- Mortgage (P&I)
- −$1,285
- Tax from tax record
- −$144 /mo · $1,732/yr
- Insurance
- −$102
- HOA
- −$0
- Vacancy / Maint / Mgmt
- −$446
- Net cashflow
- $145
Break-even live
Sensitivity live
| Price | -10% $284 | -5% $214 | +0% $145 | +5% $76 | +10% $6 |
|---|---|---|---|---|---|
| Rent | -10% $-22 | -5% $61 | +0% $145 | +5% $229 | +10% $313 |
| Rate | -1.0pp $269 | -0.5pp $207 | base $145 | +0.5pp $82 | +1.0pp $17 |
UW: 25.0% down · 7.5% · 30yr · 1.5% tax · 5.0% vac · 8.0% maint · 8.0% mgmt
Financing live
Cash to close
- Down payment
- $61,250
- Closing costs
- $7,350
- Reserves months
- —
- Total cash needed
- —
Loan-product check · same deal, 3 products live
Conventional
25% down · 7.5% · 30yr
- Down + closing
- —
- Monthly P&I
- —
- Monthly cashflow
- —
- DSCR
- —
- Eligible?
- —
Personal DTI + credit; lowest rate.
DSCR
20% down · 8.5% · 30yr
- Down + closing
- —
- Monthly P&I
- —
- Monthly cashflow
- —
- DSCR
- —
- Eligible?
- —
No personal income docs; deal must DSCR.
Hard money
10% down · 12.0% · 12mo
- Down + closing
- —
- Monthly P&I
- —
- Monthly cashflow
- —
- DSCR
- —
- Eligible?
- —
Short-term bridge; refi at stabilization.
Rent comps 1 comps
| Address | Beds | Baths | Sqft | Rent | $/sqft | DOM | Units | Dist |
|---|---|---|---|---|---|---|---|---|
| 16 Sheba Pl Los Lunas, NM | 3.0 | 2.0 | 1420 | $2,000 | $1.41 | 46d | 1 | 0.25mi |
Listing history 9 events
-
2026-06-13status $245,000 Pending 8 DOM
-
2026-06-10days on market $245,000 Active 8 DOM
-
2026-06-09days on market $245,000 Active 7 DOM
-
2026-06-08days on market $245,000 Active 6 DOM
-
2026-06-08status $245,000 Active 5 DOM
-
2026-05-07status Pending 500-char remark
-
2026-05-01$245,000 Active 500-char remark
-
2004-08-02soldstatus $107,500
-
1999-06-08soldstatus
ⓘ Source: listings_history table (triggers on properties + properties_extension) + one-shot
backfill from property_details.listing_events for pre-trigger history.
Tax reassessment forecast NM · Resets to sale price
- Current annual tax
- $1,732 · $144/mo
- Projected year-2 tax
- $1,960 · $163/mo
- Expected delta
- +$228/yr (+$19/mo · 13.2%)
ⓘ Screening estimate from a state-policy table — verify with the county assessor before closing.
Climate risk First Street
- Flood 1/10 Low FEMA zone X (unshaded) · 0% chance over 30 yrs
- Wildfire 5/10 Major
- Heat 5/10 Major 7 d/yr ≥97°F today · 20 d/yr by 30 yrs out
- Wind 1/10 Low
- Air quality 1/10 Low 0 unhealthy d/yr today · 0 by 30 yrs out
Nearby sold comps map
Loading sold comps map…
Walkable amenities ~0.75 mi
Loading nearby amenities…
Taxation est. · year 1
- Rental income
- $25,464
- − Mortgage interest
- −$13,724
- − Property taxes
- −$1,732
- − Insurance
- −$1,225
- − Repairs & maintenance
- −$2,037
- − Management
- −$2,037
- − Depreciation
- −$7,127
- Taxable loss
- −$2,419
- Est. tax savings @ 24.0%
- +$580
- After-tax cash flow
- $2,322/yr
For passive investors: Depreciation is non-cash, so a rental often shows a tax loss while cash-flowing — sheltering income. Rental losses are passive: they offset passive income freely, and up to $25,000/yr can offset ordinary (W-2) income if you actively participate and your MAGI is under $100k (phasing out to $0 by $150k); unused losses carry forward. On sale, claimed depreciation is recaptured at up to 25%, and gains may owe capital-gains tax (a 1031 exchange can defer both). Figures are a year-1 estimate at your 24.0% rate — not tax advice; consult a CPA.
Schools (NCES district)
- District
- Los Lunas Public Schools
- NCES district ID
- 3501680
- Math proficiency
- 20% —
- Reading proficiency
- 34% —
- Median HH income
- $44,438
- Composite
- 26.11/100
- National rank
- #12724
- State rank
- #34 of 95 in NM
Livability — Tome
- Score
- 62/100
- State rank
- #89
- US rank
- #16929
Category grades
Schools grade is shown separately in the Schools card above.
Census & demographics
- County
- Valencia County · 68,779 people
- City population
- 11
- Metro
- Albuquerque, NM
- Population (ZIP)
- 47,514
- Household income
- $60,902
- Rent vs Own
- Severe rent burden
- 602.0
Population outlook (Valencia County) Hauer SSP2
- Today (2025)
- 73,788 people
- By 2030
- 72,101 · -2.3%
- By 2040
- 67,930 · -7.9%
- By 2050
- 63,191 · -14.4%
- By 2075
- 53,644 · -27.3%
- By 2100
- 40,882 · -44.6%
Race, ethnicity, and origin ACS 2023
- Neighborhood character
- Majority Hispanic (63%)
- Race & ethnicity
- Hispanic / Latino 63% White 30% Two or more races 29% Native American 4% Black 1%
- Hispanic origin (detail)
- Mexican 38%
- Common ancestry
- Serbian 1% Russian 1% Slovak 1%
- Foreign-born
- 8% · Canada
- Languages at home
- 71% English-only · Spanish 27%
Political lean MEDSL · Valencia
- 2024 margin
- R (+16.4) · D 40.9% · R 57.3% · Other 1.8%
- 2008→2024 swing
- -24.1pp toward R · 2008: 7.7pp · 2024: -16.4pp
- All cycles
- 2024: R+16.4 2020: R+9.6 2016: R+8.7 2012: D+2.5 2008: D+7.7
Not yet ingested
- Civics
- —
Market trends
- HPI YoY
- ▼ -85.17%
- Current HPI
- 201.0508
- Rent YoY
- ▲ 33.16%
- Metro
- Albuquerque, NM
- State GDP YoY
- —
- F500 in state
- 0
Price history
+127.9% since first listed6 events — show timeline
- 2026-06-10 Pending — Southwest MLS
- 2026-06-07 Relisted — Southwest MLS
- 2026-05-07 Pending — Southwest MLS
- 2026-05-01 Listed $245,000 Southwest MLS
- 2004-08-02 Sold (Public Records) $107,500 Public Records
- 1999-06-08 Sold (Public Records) — Public Records
Property tax history
+3.4%/yrLatest (2025): $1,732 · +27.1% YoY. Source: county tax records.
Cash-flow waterfall
monthlySold comps — $/sqft
last 12 mo · ≤1 miLoading sold comps…