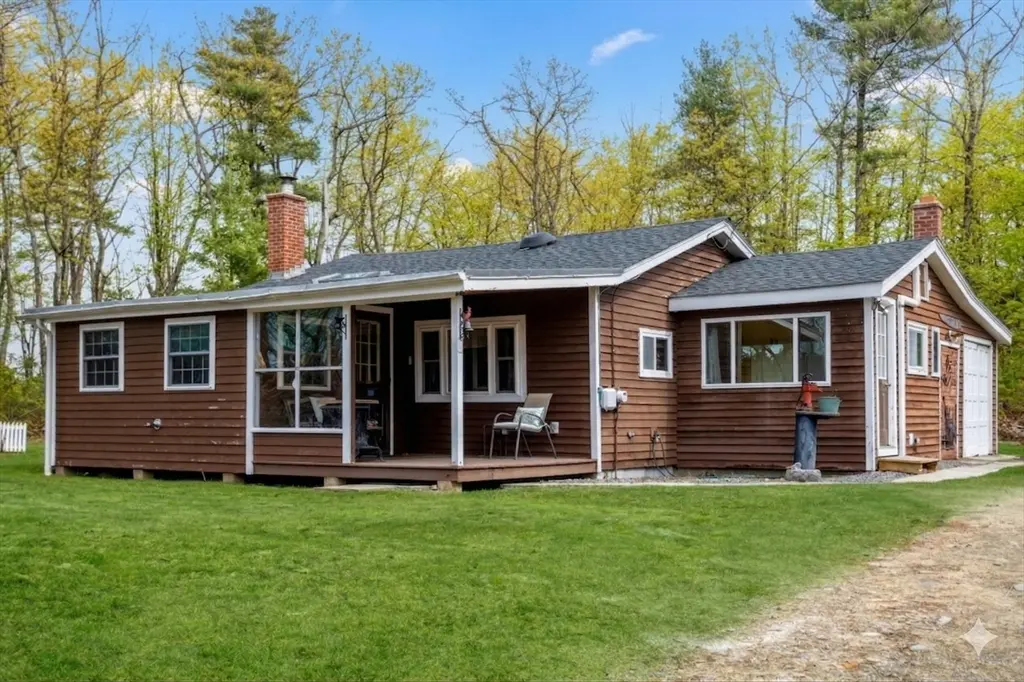
227 Log Cabin Rd · Ashby, MA
Flood risk 1/10 · Minimal
- FEMA flood zone
- X (unshaded)
- Chance of flooding over 30 yrs
- 0.0%
- Est. flood insurance / yr
- $507 – $1,088
Fire risk 3/10 · Minor
- Est. fire insurance / yr
- $915 – $1,699
Heat risk 2/10 · Minimal
- Hot days now (above 93°F)
- 5 days/yr
- Hot days in 30 yrs
- 12 days/yr
Wind risk 5/10 · Moderate
- Chance of severe wind over 30 yrs
- 23.0%
Air-quality risk 2/10 · Minimal
- Unhealthy air days now
- 1 days/yr
- Unhealthy air days in 30 yrs
- 1 days/yr
Risk factors via First Street. Map © Google.
Why this score? — see what drove the B- grade
The composite is a weighted blend of 9 inputs, each scored 0–100. Each bar is that input's sub-score; the figure is the points it added to the 100-point composite (weight × sub-score).
- Cash flow +26.9/30.0
- ARV discount +15.0/15.0
- DSCR +9.3/10.0
- 1% rule +6.8/10.0
- Schools +4.2/10.0
- Rent growth +2.5/5.0
- Livability +2.5/5.0
- Condition / age +2.5/5.0
- Appreciation +0.0/10.0
$239,900
🖨 Deal sheet (PDF) 📄 Offer letter ✓ Due diligence
Listing remarks MLS
Tucked away at the end of a private dead-end road in Ashby, this charming 1 bedroom, 1 bath home with a home office offers a peaceful retreat with a serene, secluded setting. Ideal as a summer escape or comfortable year-round residence, the property features deeded access to Lower Wrights Pond and enjoys tranquil water views from select vantage points. The home is thoughtfully laid out to maximize functionality while maintaining a cozy, inviting feel. Three sheds/outbuildings provide excellent storage and flexibility for hobbies, equipment, or outdoor gear. Surrounded by natural beauty, this setting offers a sense of privacy while remaining accessible to area amenities and recreation. Whether you are seeking a quiet getaway or single level living in your primary home, this property delivers a unique opportunity to enjoy a relaxed lifestyle in a scenic Ashby location. Check out the 3D Tour! 3 parcels to convey. Buyer responsible for Title V / Septic.
Key facts
- Three sheds
- Tranquil water views
- 0.56 acre lot
Tags
Neighborhood map
What this means for you Summary
Snapshot
- This is a 1-bed/1.0-bath single-family listed at $240k.
Deal economics
- At list price, monthly cash flow is $662 ($8k/yr) — positive.
- The deal already cash-flows at list — no discount required.
- Meets the 1% rule at list price ($3k rent vs $240k).
- Recommended offer: $226k (6.0% below list) — sets the bar for market timing.
Location & tenants
- Location reads: area grade B — affects rentability + tenant quality, not the cash-flow math above.
- North Middlesex (rural): math 36% / reading 54% proficiency, ranked #150 of 302 in MA (top 50%) — families likely to look elsewhere, expect single-tenant / working-renter base with shorter leases; only 15% free/reduced lunch — higher-income household profile.
- Market conditions: 22 active listings in the ZIP; 3,670 units permitted in Middlesex County in 2024 (2,611 in 5+ unit buildings).
Forward outlook
- Local home prices are declining (-3.0%/yr); year-one equity from $2k of loan paydown is wiped out by about $7k of value loss. Plan a longer hold.
- Middlesex County population projected at +20% by 2050 — long-run rental-demand tailwind backs the buy-and-hold thesis.
- At projected returns (-3.0% appreciation + 3.0% rent growth), your $67k cash investment doubles in ~10 years — after that, you're playing with house money.
Negotiation context
- It's been on market 78 days — a 6% lower offer ($226k) is reasonable based on typical stale-listing flexibility.
- Current owner paid $16k; list at $240k implies a 1448% gain — meaningful room to come down on a strong offer.
Risks & watch-outs
- Climate carrying-cost: moderate wind risk, 23% chance of damaging wind over 30y — expect insurance premiums to compound above CPI over the hold.
Questions for the listing agent
- It's been on market 78 days. Have you received any prior offers? Is the seller open to a 6% concession, seller financing, or rate buy-down credit?
- Built in 1962 — when were the roof, HVAC, electrical panel, plumbing, and water heater last replaced?
- Why hasn't it sold? Are there any deal-killer items the seller is aware of (foundation, flood, title, zoning, code violations)?
- Is there a deadline driving the sale (1031 exchange, divorce, estate, relocation)? That informs how much negotiation room exists.
- What's the average days-on-market for RENTAL listings here right now (not sales)? A rising rental-DOM trend means longer vacancies and softer asking-rent achievability than the comps imply.
- What's the recent tenant-quality profile in this submarket — average credit score on applications, eviction rate, late-payment / NSF rate, and stable-employment percentage? A property-management company in the area should have these aggregated.
- How much new for-sale + rental construction is in the pipeline within 1–3 miles? Heavy new supply typically softens prices + rents 12–24 months out; constrained supply supports both.
Investment metrics
- 1% rule
- 1.18% ✓
- Cap rate
- 9.61%
- Cash-on-cash
- 11.83%
- DSCR
- 1.53
- GRM
- 7.1
CMA / ARV
- ARV (median comp)
- $327,622
- List price
- $239,900
- Delta
- -26.78%
- Verdict
- UNDERPRICED
- Comps
- 2 within 1.0 mi
Projected returns pro-forma
-3.0% appreciation · 3.0% rent growth · sell at horizon
- IRR
- 1.3%
- Equity multiple
- 1.05×
- Total profit
- $3,294
- Equity at exit
- $35,770
- IRR
- 10.9%
- Equity multiple
- 1.85×
- Total profit
- $57,141
- Equity at exit
- $20,742
Cash invested: $67,172 (down + closing). Projections, not guarantees.
Landlord ↔ Tenant lean methodology
- Overall (STATE)
- 20 Strongly Tenant-Friendly
- State Massachusetts
- 20 Strongly Tenant-Friendly · D+15
- County
- — inherits STATE
- City
- — inherits STATE
ZIP-level market 01431
- Home prices YoY
- -8.4%
- Active inventory
- 22
- Price-to-rent
- 7.1×
Monthly cashflow live
- Estimated rent
- $2,830 medium interval (Pro) →
- Mortgage (P&I)
- −$1,258
- Tax from tax record
- −$216 /mo · $2,589/yr
- Insurance
- −$100
- HOA
- −$0
- Vacancy / Maint / Mgmt
- −$594
- Net cashflow
- $662
Break-even live
Sensitivity live
| Price | -10% $798 | -5% $730 | +0% $662 | +5% $594 | +10% $526 |
|---|---|---|---|---|---|
| Rent | -10% $439 | -5% $550 | +0% $662 | +5% $774 | +10% $886 |
| Rate | -1.0pp $783 | -0.5pp $723 | base $662 | +0.5pp $600 | +1.0pp $537 |
UW: 25.0% down · 7.5% · 30yr · 1.5% tax · 5.0% vac · 8.0% maint · 8.0% mgmt
Financing live
Cash to close
- Down payment
- $59,975
- Closing costs
- $7,197
- Reserves months
- —
- Total cash needed
- —
Loan-product check · same deal, 3 products live
Conventional
25% down · 7.5% · 30yr
- Down + closing
- —
- Monthly P&I
- —
- Monthly cashflow
- —
- DSCR
- —
- Eligible?
- —
Personal DTI + credit; lowest rate.
DSCR
20% down · 8.5% · 30yr
- Down + closing
- —
- Monthly P&I
- —
- Monthly cashflow
- —
- DSCR
- —
- Eligible?
- —
No personal income docs; deal must DSCR.
Hard money
10% down · 12.0% · 12mo
- Down + closing
- —
- Monthly P&I
- —
- Monthly cashflow
- —
- DSCR
- —
- Eligible?
- —
Short-term bridge; refi at stabilization.
Listing history 17 events
-
2026-06-18days on market $239,900 Active 78 DOM
-
2026-06-17days on market $239,900 Active 77 DOM
-
2026-06-16days on market $239,900 Active 76 DOM
-
2026-06-15days on market $239,900 Active 75 DOM
-
2026-06-14days on market $239,900 Active 73 DOM
-
2026-06-13days on market $239,900 Active 72 DOM
-
2026-06-10days on market $239,900 Active 70 DOM
-
2026-06-09days on market $239,900 Active 69 DOM
-
2026-06-08days on market $239,900 Active 68 DOM
-
2026-06-07days on market $239,900 Active 67 DOM
-
2026-06-03days on market $239,900 Active 63 DOM
-
2026-06-02days on market $239,900 Active 62 DOM
-
2026-06-01days on market $239,900 Active 61 DOM
-
2026-05-31days on market $239,900 Active 60 DOM
-
2026-05-31statusdays on market $239,900 Active 59 DOM
-
2026-04-01$250,000 New 965-char remark
Show marketing remark (965 chars)
Tucked away at the end of a private dead-end road in Ashby, this charming 1 bedroom, 1 bath home with a home office offers a peaceful retreat with a serene, secluded setting. Ideal as a summer escape or comfortable year-round residence, the property features deeded access to Lower Wrights Pond and enjoys tranquil water views from select vantage points. The home is thoughtfully laid out to maximize functionality while maintaining a cozy, inviting feel. Three sheds/outbuildings provide excellent storage and flexibility for hobbies, equipment, or outdoor gear. Surrounded by natural beauty, this setting offers a sense of privacy while remaining accessible to area amenities and recreation. Whether you are seeking a quiet getaway or single level living in your primary home, this property delivers a unique opportunity to enjoy a relaxed lifestyle in a scenic Ashby location. Check out the 3D Tour! 3 parcels to convey. Buyer responsible for Title V / Septic.
-
1981-12-21soldstatus $15,500
ⓘ Source: listings_history table (triggers on properties + properties_extension) + one-shot
backfill from property_details.listing_events for pre-trigger history.
Tax reassessment forecast MA · Partial reset (capped growth)
- Current annual tax
- $2,589 · $216/mo
- Projected year-2 tax
- $2,770 · $231/mo
- Expected delta
- +$181/yr (+$15/mo · 7.0%)
ⓘ Screening estimate from a state-policy table — verify with the county assessor before closing.
Climate risk First Street
- Flood 1/10 Low FEMA zone X (unshaded) · 0% chance over 30 yrs
- Wildfire 3/10 Moderate
- Heat 2/10 Low 5 d/yr ≥93°F today · 12 d/yr by 30 yrs out
- Wind 5/10 Major 23% chance of damaging wind over 30 yrs
- Air quality 2/10 Low 1 unhealthy d/yr today · 1 by 30 yrs out
Nearby sold comps map
Loading sold comps map…
Walkable amenities ~0.75 mi
Loading nearby amenities…
Taxation est. · year 1
- Rental income
- $33,964
- − Mortgage interest
- −$13,438
- − Property taxes
- −$2,589
- − Insurance
- −$1,200
- − Repairs & maintenance
- −$2,717
- − Management
- −$2,717
- − Depreciation
- −$6,979
- Taxable income
- $4,324
- Est. tax owed @ 24.0%
- −$1,038
- After-tax cash flow
- $6,909/yr
For passive investors: Depreciation is non-cash, so a rental often shows a tax loss while cash-flowing — sheltering income. Rental losses are passive: they offset passive income freely, and up to $25,000/yr can offset ordinary (W-2) income if you actively participate and your MAGI is under $100k (phasing out to $0 by $150k); unused losses carry forward. On sale, claimed depreciation is recaptured at up to 25%, and gains may owe capital-gains tax (a 1031 exchange can defer both). Figures are a year-1 estimate at your 24.0% rate — not tax advice; consult a CPA.
Schools (NCES district)
- District
- North Middlesex
- NCES district ID
- 2508790
- Math proficiency
- 36% ▼ -18.00%
- Reading proficiency
- 54% ▼ -5.00%
- Median HH income
- $82,624
- Composite
- 41.69/100
- National rank
- #3413
- State rank
- #150 of 302 in MA
Livability — Ashby
No livability data for this city. (Only ~50 U.S. cities are tracked.)
Census & demographics
- Population (ZIP)
- 3,188
Population outlook (Middlesex County) Hauer SSP2
- Today (2025)
- 1,740,269 people
- By 2030
- 1,817,187 · +4.4%
- By 2040
- 1,963,195 · +12.8%
- By 2050
- 2,087,461 · +20.0%
- By 2075
- 2,344,036 · +34.7%
- By 2100
- 2,383,776 · +37.0%
Race, ethnicity, and origin ACS 2023
- Neighborhood character
- Predominantly White (94%)
- Race & ethnicity
- White 94% Two or more races 5% Hispanic / Latino 3%
- Common ancestry
- Lithuanian 8% Slovak 4% Romanian 4%
- Foreign-born
- 4% · Canada, Jamaica
- Languages at home
- 96% English-only · German/W. Germanic 2% Other Indo-European 1% Spanish 1%
Political lean MEDSL · Middlesex
- 2024 margin
- Solid D (+39.5) · D 68.5% · R 29.0% · Other 2.5%
- 2008→2024 swing
- +9.3pp toward D · 2008: 30.1pp · 2024: 39.5pp
- All cycles
- 2024: D+39.5 2020: D+45.2 2016: D+38.1 2012: D+26.9 2008: D+30.1
Not yet ingested
- Civics
- —
Market trends
- HPI YoY
- ▼ -25.45%
- Current HPI
- 276.7752
- Rent YoY
- —
- Metro
- —
- State GDP YoY
- ▲ 2.28%
- F500 in state
- 38
Industry mix (Fortune 500 HQ in MA)
| Industry | F500 HQs | Revenue |
|---|---|---|
| Technology | 3 | $17B |
|
||
| Insurance | 2 | $84B |
|
||
| Retail | 2 | $76B |
|
||
| Life Sciences | 1 | $43B |
|
||
| Energy Technology | 1 | $31B |
|
||
| Aerospace / Defense | 1 | $18B |
|
||
Price history
+1512.9% since first listed2 events — show timeline
- 2026-04-01 Listed $250,000 MLS PIN
- 1981-12-21 Sold (Public Records) $15,500 Public Records
Property tax history
+4.4%/yrLatest (2025): $2,589 · +2.2% YoY. Source: county tax records.
Cash-flow waterfall
monthlySold comps — $/sqft
last 12 mo · ≤1 miLoading sold comps…